NEXT: $0.042 interoperability great team
decent price
fresh issue
no coverage
see other threads to set Limits Stops Sizing entries exits
good lucks
Crypto market

Chainlink on the Weekly Timeframe LINKHitting a Macro Support. I drew many areas of interest out on the chart for places to look for the price to turn and move about.
Pretty Straight forward. We are coming off a major support while the rsi is forming an uptrend.
I dont know much about the fundamentals of this token, this is more for the TA specifically.
Please Comment!
Absolutely Not Financial Advice
Do your own DD

PDAUSDT IDIA Hello traders hope you are enjoying our Analysis.
Now we are here again with a new trading opportunity ,we will discuss today about PDAUSDT
Bearish pennant Break out done in 12h time frame ✅
Expecting 30% profit 📈

SNXUSDT.PHello Trader BINANCE:SNXUSDT
1 day chart shows patten Ihns, but for the right soulder it is not 100% valid at this time. You can monitor it or if you want to try to enter, just go ahead.
It is not recommended for futures, if you really want to enter futures, the maximum leverage is to use only 2-5%
entry area : market price - 2,597
take profit 60%
stop loss 10%
Please add a comment and Positive feedback and constructive criticism are important to authors and the community.
Disclamer: Not Financial Advice

FLOKIUSDT.PHello Trader BITGET:FLOKIUSDT.P
I took it in the HH area, the 4H area for shorts. It is possible to go down first and consolidate first before experiencing a sustainable increase
take profit 10%
stop loss 3%
Please add a comment and Positive feedback and constructive criticism are important to authors and the community.
Disclamer: Not Financial Advice

Let's see how this strategy and analysis can help youHello traders
According to the picture, the candle is at the edge of the triangle and at the bottom of the channel. With good resistance, break the top edge of the triangle and continue rising to the channel ceiling
Daily analysis and advice will hopefully help you

Binance Coin (BNB): Bollinger Bands Exploaded / Major ResistanceWe are back with Binance Coin, where we are now looking at a slightly bigger timeframe.
What is catching our attention is still that strong and major resistance zone, (which is currently being tested, but also the Bollinger Bands, which have been exploaded complitely.
Usually, when Bollinger Band is expended like that near Resistance ( + we are in an overbought zone with RSI), there are some major moves to come soon.
There's of room to move for a healthy correction, so keep an eye!
Swallow Team

BNB ready for $800BNB ready for $800.
Maybe a BNB Spot ETF? 👀 If there were to approve a Solana Spot ETF, BNB might be the next one. During the election year, anything can happen. Ready to catch opportunities.


EOSUSDTHi guys
Tangent with the medium-term uptrend line, in the lower time frames, a head and shoulder pattern is formed at the end of the downtrend.
The support areas are also well preserved so far; Provided that the previous price floor is maintained, and the resistance range of $0.831 is consumed, we expect an upward trend similar to the scenario.

Bitcoin is fake breakoutHello dear friends,
Bitcoin can correct after a fake breakout and touch $74500 to the target of $49600 and follow the path of the picture.

API3USDT UPDATE#API3USDT (Update)
Hey dear traders. Hope you are enjoying analysis with our team. we are here to analyze API3USDT today.
16% profit Done ✅
Expecting more in coming days🚀

DARUSDT UPDATE #DARUSDT(Update)
Hey dear traders. Hope you are enjoying analysis with our team. we are here to analyze DARUSDT today.
Running towards our target .
28% profit done✅
Expecting more in coming days📈🚀

When everyone is busy on other alts, ADA cooking its own MOVE!↑↑I'll simplify on this one -- reflective of ADA's non complicated nature.
KEY NOTE:
WEEKLY Price Yearlong standing price support -- currently bouncing off it with accuracy.
WEEKLY NET VOLUME surge.
Weekly Histogram Higher Lows.
Thinning movements on the lower price range -- HUGE HINT.
Currently sitting just above 1.0 FIB level -- beyond bargain / discount.
THIS IS RIPE for BIG MOVES. A bottom fish opportunity that doesn't come very often.
Previous ATH target will not be far-fetched.
Spotted at 0.29
TAYOR
Safeguard Capital always.


LTC is duplicating BTC's pre surge DNA based on MONTHLY metrics.FOCUS ON LTC.
A theoretical and technical analysis of these two major coins price movements.
LTC's recent monthly price metrics is reminiscent of BTC's September 2023 movements before it shot up from 20k to 40k. As we speak, it is following the DNA of that certain movement. We are now at the critical heat point for that X2 surge.
BTC post surge price touched 38.2 fib trend levels with precision at 40k from its 20k++ base range. A similar scenario for LTC will likely play out. A 38.2 fib trend level would mean a 150 price valuation after a break in structure. We are now at that crosspoint.
Spotted at 70.0
Conclusion: If you're late with the BTC bull party, LTC will now be your ultimate friend.
TAYOR.
Safeguard funds always

ETH, recent pump barely scratching the surface MASSIVE MOVE NEXT
ETH recent pump was an indication of things to come -- good things.
The coin went from 1700 to 1900 within 72 hours -- indicating that a longer shifting trend is about to materialize. Based on recent news, low supply of ETH is being detected on most exchanges depicting a bullish scenario for the coin.
On weekly data, new higher lows was created both on Histogram and pricing -- conveying the recent ascend with the current price range to be the new base for the incoming significant price growth.
Weekly data price movement volatility has been on the conservative side hinting that for every higher low it established -- it is creating a solid support range.
On Tri monthly data -- it is hinting of the same bullish continuation scenario. Surging price valuation on longer time spectrum. A bubble up volume has finally appeared after 5 months of waiting, last one was on January 2023.
Expect significant price valuation for ETH in the next coming weeks.
The weekly chart is too clean, direction is certain -- no further explanation needed.
Spotted at 1850.
TAYOR
Safeguard capital always

BTC ready for the pump??As I marked out you can see a descending channel followed by a bullish pendent that's breaking out. I've also marked out key levels that price bounces from. As of today price has reacted of the range of 67500 (Each level being marked 2500 apart). I believe we can be seeing prices reaching 82500 pretty soon! Hope everyone is having a successful trading day so far. BTC to the Moon. good luck everyone

TROYUSD 1WTROY ~ Updated
#TROY Do not miss this. This is the bottom part. The bulls will come soon and pump from here.

Chart Pattern Analysis Of Bitcoin
K3 break up and close upon K2 under low supply pressure,
It seems that the following candles will price up to test the resistance.
I don’t think this is the start of another bull run,
It is just a Wave(B) of a larger scale consolidation process.
But during this process,
Some other crypto tokens will do better.

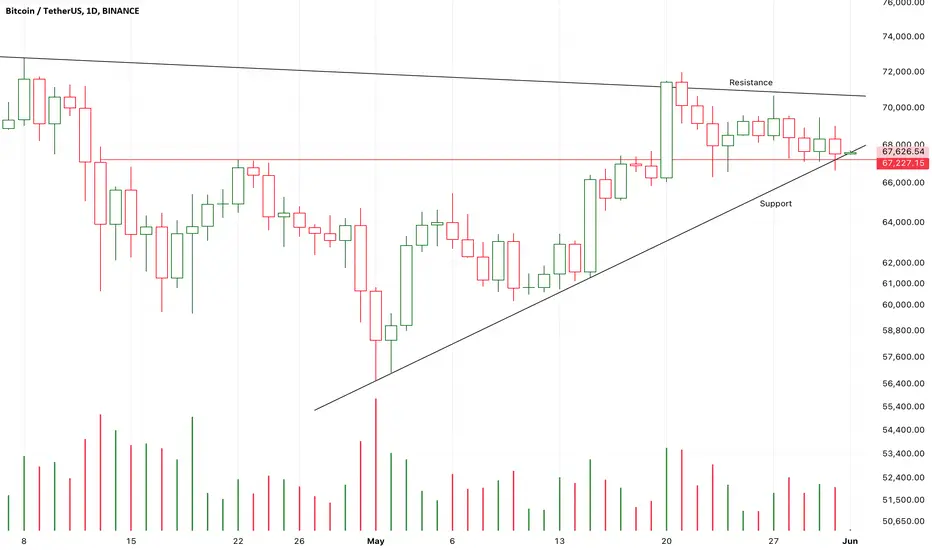
Chart Pattern Analysis Of Bitcoin
Trend Analysi:
From the chart, we can see that after experiencing a downtrend, Bitcoin's price is currently in a relatively stable consolidation range.
The recent price action shows Bitcoin fluctuating between $67,000 and $70,000. Although there have been several attempts to break through $70,000, they have all failed, and the price is currently around $67,650.
Support and Resistance Levels:
Support Level: The current support level is around $67,000, which is a strong support area. If the price breaks below this support level, it may further decline to around $60,000.
Resistance Level: The main resistance level is around $70,000. If the price can effectively break through this resistance, it may usher in a new round of upward movement.
Candlestick Patterns:
The recent candlestick patterns show a few bullish candles, but overall, the price movement is not significant, indicating market hesitation.
Observing the trading volume, we can see an increase in volume in recent days, indicating increased market activity, which may suggest a significant price movement ahead.
Conclusion
Combining the above analysis, Bitcoin is currently at a key support level, and the increase in trading volume indicates higher market activity. If it can hold above $67,000 and show signs of breaking upwards, it may be considered a good point to start building a long position. However, close attention should be paid to market movements and volume changes to prevent risks if the price breaks below the support level.
Operational Suggestions:
Aggressive Investors: Can start building long positions around $67,000, with a stop loss set below $66,000.
Conservative Investors: Wait for the price to break and hold above $70,000 before entering a long position to confirm the upward trend.
Please proceed with caution based on your personal risk tolerance and market conditions. It is advisable to combine this with other technical indicators and market information for comprehensive analysis.
This can be a sign of a good ascension.ETH/BTC 1W
Pay attention to the positive divergence and Fibonacci 0.618 and the support line. This can be a sign of a good ascension.
Did I do the right analysis?

$OM is ready for the bullrun #MANTRA team is pushing forward and I am still holding from late 2023!
Only a matter of time before NASDAQ:OM goes higher. We still got a long way to go until even #ATH so I’m holding a nice bag.
NASDAQ:OM seems well-prepared for the next #RWA token run.
