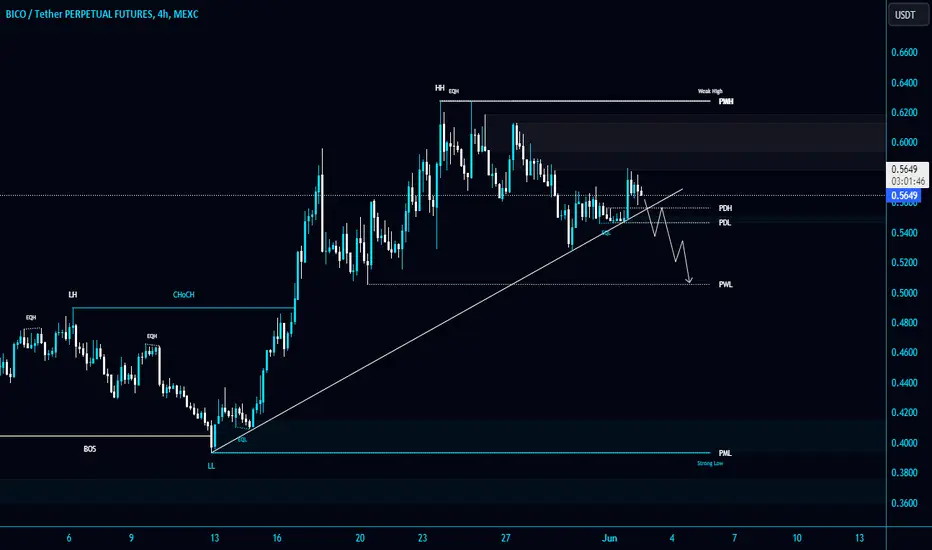
#BICO/USDT is trying to hold the Diagonal Trendline in 4-Hour TF#BICO/USDT is trying to hold the Diagonal Trendline in 4-Hour TF!
OMXSTO:BICO needs to hold this level to remain bullish. If it breaks down and retests, we can short it. The local support level is PWL $0.506.
Crypto market
BNB retracing back to 50%??this could be possible
the on monthly and weekly we can see the price action is sell on high and buy on low, and price recently hit the high and forming triangle on the daily time frame
we can see rsi falling and with price it could be bearish divergence
450-425 is the 50% from the swing low
let see how the structure forms .......

ETH wait for 3000 for buy/longCMP the price at eth is going side ways incase the price starts making lower low and lower high on daily time frame, then follow the structure and wait for change of trend at the zone of 3000 where we have a order block and we can if we see impulsive move towards it will be target for 4250

UNI/USDT formation of a 5 or a B; got another leg upAs the title suggests, feel free to comment tickers you want to get charted

suitable price for BUY and SALE? $TONToncoin (TON) is the native cryptocurrency of the decentralized layer-1 blockchain, The Open Network (TON). The TON blockchain is open-sourced and supported by many network contributors, including the Switzerland-based non-profit organization, the TON Foundation.

PYR is retesting the 100day SMA (Break or not)Technical Analysis only:
PYR have been testing the 100day SMA with a 3 time retest to the 4.1$ Support level which also has been acting as a strong support.
Moreover, we’re standing still waiting for a 100-day SMA break (Yellow line) to enter a long position with a TP 5.4$.
This is not a financial advice but rather my own idea and analysis.

Bitcoin - The Marco MazeHistory doesn't necessarily have to repeat! I see a lot of history based derivation for the timelines and price as to when and how high or low bitcoin can sore. As exciting and adrenaline pumping as these ideas seem, the outcome will just be as good as any coin toss! The truth however is the "macro maze" above. I've taken sensible assumptions to derive on the timelines and humanly possibe price floors and ceilings! In this environment sensible assumptions can easily turn out to be the most major blunder, so as I always say, please do your own analysis!
How to read the chart? It's quite simple, red is resistance or sell, green is support or buy. The intersections are where Bitcoin's price would likely be attracted to. There is no saying with precision when and where it would be. Kinda of like the Schrödinger's cat, you will only know when it happens. Anyone who says otherwise has a 50/50 chance of being right. Now, are you a trader or a gambler? Stay safe, peace out!
Disclaimer: These are not trading signals. Trade at your own risk!

DYDX - Highlight Wanted to highlight DYDX as the month as it has some very important patterns forming.
The chart on the right is the monthly and the chart on the left is the daily. Let's begin with the monthly chart.
The key level the bottom was created at is the psychological $1 level (white line). This is the most key level of support for DYDX on the macro. We just formed a doji candle on the monthly which could signal a reversal for DYDX back to the upside. We can also assume this is the case as the monthly RSI is trying to climb from oversold conditions back into the RSI channel which could really increase the momentum. TSX:GMX (a similar related coin) just climbed over 70% over the last couple weeks. With DYDX being an ETH narrative related token, and the ETH ETFS being recently approved, this could also provide fundamental/sentiment reasons for DYDX'S increase in price.
The daily chart gives us our current pattern which looks to be a falling wedge. Falling wedges are usually bullish patterns that lead to upwards price action. Upon breakout of our upper line of resistance we could see a substantial rise, but if the lower level of support is broken we could see an additional 40-50% collapse. Right now the bullish case scenario is much more likely as DYDX is also trying to establish the $2 level as a strong support level .

C&H inside C&H to a 1000% soon on solid project $BTAFThe Bitcoin Trend and Forecast token, $BTAF is performing a stunning pattern:
It is a Cup & Handle inside another Cup & Handle!
What you see is a bigger picture, some 15 months; it has performed a very large C&H that has already broke out from handle (downward yellow channel), with target at stunning 1000%
The handle of this bigger C&H formation is another C&H! This smaller handle is a perfect wedge that is sitting over the black VWAP line
Targets from yellow flag is 280% from today price and it coincides with the Beam Band (thin purple line) and target from the small C&H is 100%
But look at larger picture! While you go to 1000% you can make small profit takes on the way up

Wait for a sign!The 4-hour chart highlights key support zones around $0.0046 and $0.0041. The RSI shows a bullish divergence, indicating potential upward momentum. A breakout from the descending triangle could lead to a rally towards $0.0070, with further targets at $0.0120 and $0.0220. However, a failure to hold support may see prices testing lower levels around $0.0036

Short ABT (Arcblock) SELLHey! I think Arcblock will drop here.
It is very overextended in the larger time frame and looks ready for a correction.
Lots of other coins are also looking bearish.
- Dalin Anderson

OMUSDT IDEAHello Traders Hope You Are Enjoying Our Analysis. Today We Will Discuss About OM
(Analysis)
Running In +20% Profit So Far☑️
Moving Exactly As We Expected⚡️
I Expected More Profit In Coming Days✍️

BITCOIN MARKET ANALYSISThis publication not a financial advice. We just give our own opinion about the BITCOIN MARKET

Next 100% Pump for $Pambi Incoming Hello guys, this meme coin looks very promising general due to its big community, high volume a good chain, SOL, as well as the fact that the creator is a influencer with more than 11 million followers.
I am scooping up here as I interpret the micro structure as a first 1-2 Setup with successfully built out 5 waves to the up and 3 waves to the downside.
Looking for the pump in wave 3 next ;D
Definitely a meme coin play to add to my list!!
BITMART:PAMBIUSDT
Also tradable on Raydium.
No financial advise as always.

BTCUSD 8hrAs you can see, my trade still good! I even acquired a few more entries when Price dipped. It's Buy Time!!!! Bullish Continuation & New All Time High's are on the horizon!
_SnipeGoat_
_TheeCandleReadingGURU_
#Like #Share #Subscribe #PriceAction #MarketStructure #TechnicalAnalysis #Bearish #Bullish #Bitcoin #Crypto #BTCUSD #Forex #DayTrader #SwingTrader #PositionalTrader

CUBE $0.99 | VR1 Kick Off Oculus a simple headset was acquired by Meta at FWB:2BN
this SOMNiUM project complete with its daily times of the happenings in the metaverse
can be at par with any daily Newspaper to get u up to speed with the latest news
an ecosystem built from ground up
and the Twins of FB together with SOLANA Fund Managers are on board for the next Circus
an Apple like approach with hardware and software in place
it just needs a bit of marketing ambassador to peddle this to the moon next year.. AGAiN!

AVAXUSDT Buy setup We have bullish signal on AVAX H1 chart. This time risk reward is 1:5, Price retested strong demand zone. On H1 candles bulls showed their power, normally this kind of bullish OrderBlocks makes good moves on the market. Good luck!

BNB/USDT 4HInterval Chart ReviewHello everyone, let's take a look at the 4H BNB to USDT chart as we can see that we are getting close to trying to break out of the triangle.
Let's start by setting goals for the near future that we can include:
T1 = $600
T2 = $608.50
T3 = $614.50
T4 = $621
AND
T5 = $643.50
Now let's move on to the stop-loss in case of further market declines:
SL1 = $595
SL2 = $583
SL3 = $573.50
AND
SL4 = $563
When we look at the EMA Cross 50 and 200 indicator, we will see the yellow ema cross 50 line staying above the blue ema cross 200 line, which confirms that the uptrend is continuing.

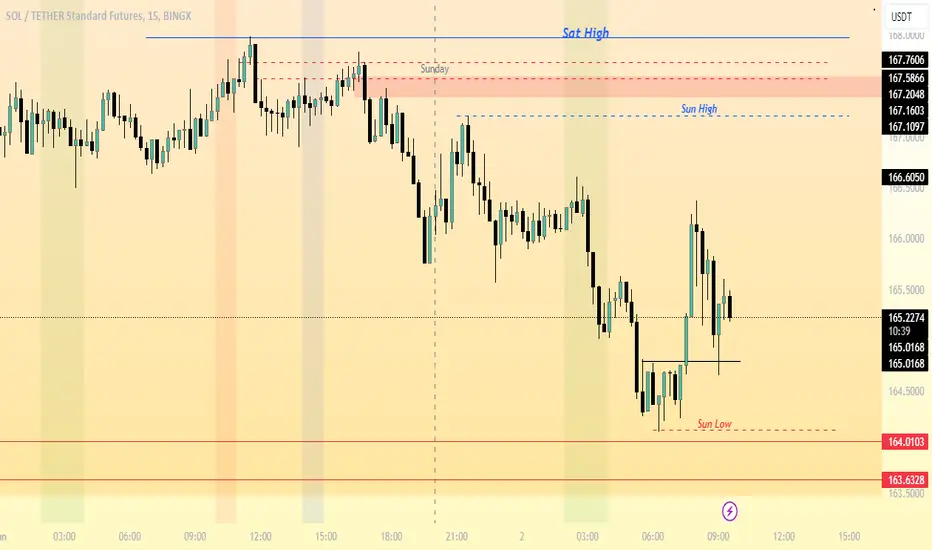
Solana Has no Weekend?Solana was resting yesterday!
Lets see whats move today!
Do Break the Sunday High or Saturday High?
Can Get Short Position on NY session or Pm Session?
I am looking for short Position!
You?
VET/USD 1 DAY Time frame As per Range Sentiment profile Vet coin is in consolidation since 01st May to till date.
For Spot Buying consider 1st Support From 0.03300 major Support @ price level 0.02800.
Resistance @ Price Level 0.03700 Major Resistance @ Price Level 0.0400.

GMX: Ascending Triangle BreakoutTrade setup : Bullish breakout from Ascending Triangle could signal a bullish trend reversal with near-term upside to $40-$43 resistance zone. That's a stiff resistance area as it also lines up with 200-day moving average. Overall, price remains in a downtrend until it breaks back above that 200-day MA.
Pattern : Ascending Triangle which is a continuation pattern (it typically breaks out in the direction of existing trend). Most traders wait for a breakout but Swing traders could trade between the trendlines (Buy at Support, Sell at Resistance) as long as the trendlines are still relatively far apart. Learn to trade chart patterns in Lesson 8.
Trend : Short-term trend is Up, Medium-term trend is Neutral and Long-term trend is Strong Down.
Momentum is Bullish but inflecting. MACD Line is still above MACD Signal Line but momentum may have peaked since MACD Histogram bars are declining, which suggests that momentum could be nearing a downswing. Price is neither overbought nor oversold currently, based on RSI-14 levels (RSI > 30 and RSI < 70).
Support and Resistance : Nearest Support Zone is $30.00, then $24.00. Nearest Resistance Zone is $40.00.


descending channel break outWhat Is a Descending Channel?
A descending channel is drawn by connecting the lower highs and lower lows of a security's price with parallel trendlines to show a downward trend. Officially, the space between the trendlines is the descending channel, which falls under the broad category of trend channels.
A more potent signal occurs with a breakout, which is when a security's price breaches an established channel's boundaries, either on the upper or lower side. When this happens, a security's price can move quickly and sharply in the direction of that breakout. If this move is in the direction of the prior trend, the descending channel would have been a continuation pattern. If the move is counter to the prior trend, the descending channel would have been a prelude to a reversal.
going long here on the potential retest guys.
