$VUTY - Accumulating Needs to break above 17.40 to confirm, but I am liking the higher lows and slowly building a position in anticipation of a break higher.
ETF market

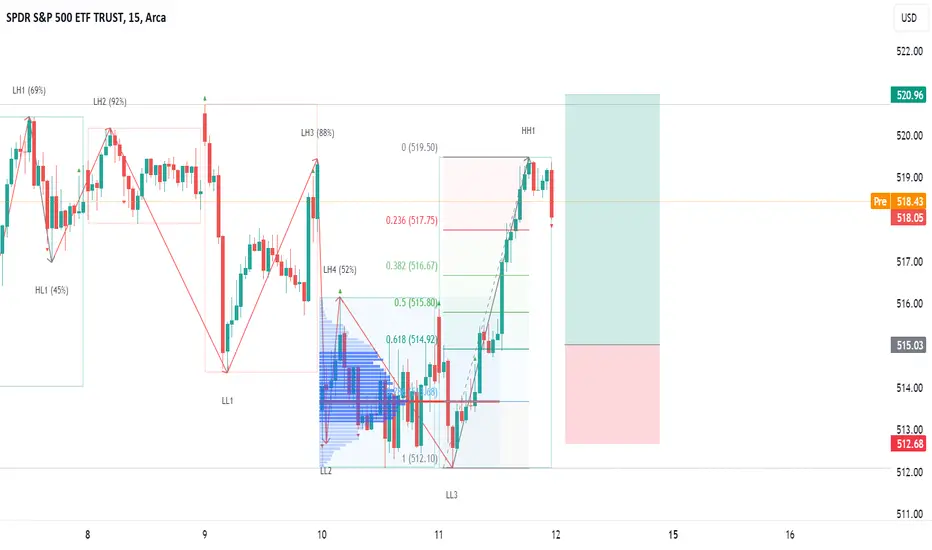
SPY LONG: scout for hourly higher lowBulls defended the weekly low and made a convincing breakout yesterday. This is a powerful statement, although buyers have not yet proven their control. To do that, they must first establish a weekly higher low, which is likely to happen next week (of course, we need to monitor how things develop). This presents a great opportunity for a long play, but buyers should wait for a pullback and scout for an hourly higher low. Ideally, this should occur near the previous Volume Area High (VAH). An example of the trade is shown on the chart.
You can read full analysis of the market below
Disclaimer
I don't give trading or investing advice, just sharing my thoughts.
LTCN About To Print MillionairesHello everyone, I figured I would do an updated chart on LTCN. My previous chart played out as predicted so far.
So, LTCN is in a clear breakout. Local top is coming around $30 with a possible 50% correction back down to $15 at that time. Coincidentally after the current cup and handle plays out, this correction will be forming a much larger cup and handle pattern on a higher degree of trend. If this larger cup and handle plays out then I can see LTCN hitting all time highs and probably breaking through into price discovery where we could see $1000 + LTCN. For this to happen then the native Litecoin cryptocurrency would have to be into the thousands of dollars. Either we are all crazy or Litecoin crypto is about to print bigger millionaires. Hold onto your hats folks, things are about to get interesting. Good luck out there.
This is just my opinion, none of this should be considered financial advice in any way.

Precious Metals minersThis is something I look at in terms of health (outlook) for PM mining stocks (see GDX and GDXJ etfs)
Mining stocks have been battered in recent times but just when everyone gives up on them is probably a decent contrarian time to start looking for higher prices
the ratio of small miners/big miners looks like it is about to break out a little higher which generally is a positive signal for the sector as a whole (risk on for the sector)

LTCN Following BCHG, Dont Get Shaken Out Here!I just wanted to point out where I believe we are in the LTCN cycle. BCHG seems to have front run LTCN in this cycle. BCHG broke through the .786 and corrected perfectly down to touch the .7 LTCN is correcting are the .618 where BCHG didnt. So what I see is LTCN is going to break the .786 at $132 spike up to $160 and then come back down to the .7 at $84 before a straight shot up to all time high. Dont get shaken out here right before the massive parabolic rally in cryptos and crypto stocks.
Also something to note is the STOCH RSI and RSI look much more bullish on the LTCN chart where the BCHG chart looks a little more toppy and corrective.
Not financial advice just my opinion. Thank you

GOLD: NOT SO STRANGE AT ALLHi guys, if you follow daily the market here there is not a strange situation.
Many guru claim that we're on the verge on something big, obviously I don't know but this movement was so called.
When you find a pattern you don't have to act but react.
If you are wrong positioned, you can close and change position, it's so easy.
I was bearish 2yrs ago (if I well remember) on Gold, but since 2023 the pattern is clear and this breakout has confirmed that short the market is always a bad decision.
Let's see if we play in the same way or we could see something different.

TLT Treasuries Long breaks down under VWAP SHORTTLT on a 120 minute chart has continued its trend down since early December after a suddent
uptrend in November lasting for a two month until the end of 2023.
Inflation data is kicking the rate cut down the road of time.
Price has now fallen under the VWAP and all of the EMA lines including the EMA20.
Relative strength trending correlates with price . I conclude, TLT continues to be set up
SHORT or alternatively TBT LONG . I will take short trades at weekly highs on a 30-60
minute chart until signs of a reversal are seen on the chart.

FAZ Triple Leveraged Bearish Financial Sector LONGThe idea is on this FAZ 15 minute chart. This is a ply on the idea that a rate cut may get kicked
down the road and a rate increase may come into consideration as a result of the report
of "sticky inflation".

The SPY is going up for 2 more days...The SPY will continue to go up for 2 more days staying within this channel area. I suspect it will hit the target point I have indicated on my chart by Feb. 6th.
I have also used Fibonacci on this chart and you can see that both my time and target price prediction matches the Fibonacci retracement of 2.618 when it meets the top of the channel. The target price is 506 on Feb. 6th before it heads down towards the lower part of the channel.
Happy trading!

Triangle peaking March 12, when US Inflation data released ...There is a triangle forming which is peaking around March 12 which is when the US inflation data is being released. According to the theory, the market can either go up or down at the peak of the triangle by approximately the same distance as the height of the triangle formation.
I suspect it will go down at the peak of the triangle due the weekly indicators showing an overbought signal. I would wait for my daily indicators and weekly indicators to align to confirm an entry point.
In the past, such as the beginning of Feb, 2018 or October, 2018 or even the big drop in 2020, the market dropped 61%, then retraced between 38.2-50% of the previous move then moved back down to another Fibonacci level. You can also find the end of the move by measuring the distance between the top of the triangle (A) to the bottom of the move (B). After the market retraces upward,the distance between C to D should equal A to B.
Typically, I find that the market progresses in 6 day moves or fractions of 6 days. So, if the market moves around March 12th like I think it will, the SPY will drop 6 days down from Point A, March 12th to Point B, March 19th. The Fed meeting is scheduled on March 19th and 20th, 2024. So around that time, the market will bounce back up (retrace) between 38.2% to 50% (Point C). It will probably peak on that retracement around March 21st or 22nd before heading down again the following week. It will stop around March 28th just before the Easter long weekend (Point D). After the Easter long weekend, the SPY should bounce back up.
I only use important events or long weekends as beginning and end points as I find chart movements seem to pivot around those days. But I use the daily and weekly chart indicators as barometers as when the market will move.
I use the DMI, MacD, Stoch RSI and MOM as indicators to guide my entries and exits.
EXTRA INFORMATION:
INFLATION: When Bill Clinton was in power, congress changed the definition of inflation and how it was calculated. Why?!? To reduce transfer payments from the government to the people. The inflation calculation changed when Congress implemented the Boskin Commission Findings where it implemented substitution, weighting, and hedonics into the calculation of inflation, thereby manipulating the inflation rate to reduce the transfer payments from the government to the people.
Substitution Effect - We no longer measure the cost of goods and services from one year to the next because of the substitution effect. This effect assumes when the price of something goes up, we will switch to something cheaper. So, if milk goes up, we will switch to powder milk or something cheaper to drink.
Weighting Effect – When something rises too fast, it is assumed people will use less of these things. For example, Health Care is calculated at 17% in the GDP calculation but is only being recorded as 6% of the CPI basket. Because health care costs are increasing so rapidly, the impact of recording a smaller weighting of health care costs means a reduction of reported inflation.
Hedonics – This is supposed to adjust for the quality improvement which leads to greater enjoyment or utility of the product. It assumes new features are always beneficial and are synonymous with falling prices. Hedonics accounts for 46% of CPI. So, if a TV is bought with a new feature, this is synonymous with quality improvement and a greater utility of this product. So, this new feature is synonymous with falling prices.
Added to this manipulation of inflation is the fact that years ago, common purchases such as gasoline, fruits, vegetables, and cigarettes were removed from this already manipulative calculation on the grounds that their prices are volatile. And we know that no one here buys gas or eats fruits and vegetables -- We all walk and eat candy to keep us alive.
If we were to calculate inflation without these manipulative methods, inflation would be much higher, hence increasing transfer payments from the government to citizens. John Williams of Shadowstatistics.com calculates everything like it was in the 1980s. Mr. Williams finds if inflation was calculated like it used to be, then we would have around 10% inflation rate or more as opposed to under 2% rate that is currently being reported every year. Inflation is not reduced just because you calculate it a different way. That is why there is such a huge disconnect between the declared inflation rate and the prices you see in the store.
To illustrate this manipulation of facts and numbers, I will use the calculation of a person's age and the Canadian Pension as an example.
Let's say the government wants to save some money through the Canadian Pension. They decided to implement the Sunday Commission Findings which was a study done by some retired politicians. (This is a fictitious study used just to illustrate the manipulation of inflation.)
In this study, these retired politicians realize the public typically has 2 days off a week. On one of those days the public needs to get errands done but the other day off is used to relax a bit and regroup. Therefore, this commission makes an assumption that there is little to no aging done on that one day where a person relaxes .
So this commission now states that one day a week the public has time off to relax should not be included in the calculation of his age in relation to the Canadian Pension.
Now, the government states a 65 year old who is just about to retire isn't really 65 years old but instead just a little over 58 years old. (Given that 1 day a week does not age you because you relax so there are 52 days/year you relax, multiply that by 47 years (given a person starts working at 18).) That equals 2,444 days or 6.69 years where a person does not age due to the fact he is relaxing on his day off. So a 65 year old is now just a little over 58 years old with this new calculation.
With this 'new' calculation, a 65 year old man isn't really 65 years old and therefore is not deserving of a pension yet.
So now the government does not have to give the man a Canadian pension for another 7 years. Now multiply that number by all the retirees. That's a lot of money saved!!!
That is exactly what this "new" calculation of inflation or the Boskin Commission Findings is doing. It is just a manipulation of numbers just like the politician's Sunday Commission Findings.
KONDRATIEFF WAVE CYCLE - There are 4 cycles to the Kondratieff Wave Cycle; Spring, Summer, Fall and Winter. Each cycle lasts between 24-26 years. This could be the final drop of the 24-26 Kondrateiff wave cycle, but for some reason I do not think it is. I have a sneaking suspicion this is just a temporary drop and it will go back up around 2026 before it makes the final drop. But we will have to wait and see. All I have now, are suspicions.

Going back up for a while I suspect the Spy will continue to go up at least until March 1, 2024.
There were 2 budget deadlines for the US set for Jan. 19th and Feb. 2 of 2024. But both of those deadlines have been pushed out in the future.
The first budget deadline at midnight on January 19 was pushed out to Mar.1, 2024 includes the following areas: Agriculture, Rural Development, and the Food and Drug Administration; Energy and Water Development; Military Construction and Veterans Affairs; and Transportation, Housing and Urban Development.
Next on Mar.8, 2024, the remaining areas would lose funding. These are: Defense; Commerce, Justice and Science; Financial Services and General Government; Homeland Security; Interior, Environment and Related Agencies; Labor, Health and Human Services and Education; The Legislative Branch; and State and Foreign Operations. The previous deadline for this was on Feb.8, 2024.
I suspect there will be another triangle that can be drawn in the future with the tip around the beginning of March, but we will have to wait until we have some more points are formed on the chart to draw from. For now, all I can conclude is that the market will go up for a little while due to the weekly and daily indicators changing.

$SPY April 12, 2024AMEX:SPY April 12, 2024
15 Minutes.
As expected ying yang is going on. Stop loss would have hit on both sides.
After the quick fall from 523.86 to 512.76 AMEX:SPY has multiple times taken support at 512 levels.
At the same time it is being resisted at 61.8% of the fall around 520 levels multiple times.
For the first time in days has managed to close above averages in 15 minutes.
For the day AMEX:SPY must hold 515 levels to continue uptrend next week.
On the downside at the moment first support is 510 levels which is 50 days in daily.
So not worth shorting today.
If AMEX:SPY can consolidate between 515 to 520 levels today, then next week should be interesting.
No trade today for me.

The Market Overall - JournalSPX (SPY) is my 'overall market' instrument which is why i have used it for this analysis.
Given:
FED remains the primary determinant for overall market movement
Drawdown 1 aligned with RSI MA cross-over
Duration of Bull Run 2 is 'overbought' per RSI
50W MA (White) is extrapolated-projected (White dashed)
It is noteworthy that:
SPX / SPY failed to reach 50D MA (Gray) on Bull Run 2, whereas it had on its Bull Run 1
RSI approaches its MA
A Multi-month Drawdown (like Drawdown 1) would align with the June FOMC Minutes
Expectations:
Price Continues Down
SPY ~50DMA (gray) resist and fails, or simply fail. Subsequent retest(s) would fail.
Disregard price closes above ~50DMA w/out RSI confirm (close above its MA)
Trade Instrument:
SPY Bear Call Spread (Credit)
16-20DTE
45-60DTE

S&P bears attack, bulls still holdLast week was marked by the aggressiveness of sellers and the resilience of buyers. On Monday Buyers were ideally positioned for another break out but they didn’t have enough steam to accomplish it. Sellers, long awaiting their opportunity, pushed the price down, breaking the weekly support. However, they couldn’t develop this into something more significant, as the bulls returned with a firm "no". The rest of the week continued in the same tug-of-war fashion.
The most confusing days were Thursday and Friday. Thursday started very bullish but ended with a dramatic bearish turn. Friday, expected to be bearish, unfolded under the bulls' control.
This was a story. Now, let’s now review all the signals more formally:
Bearish Signals
• Confirmed downtrend on the daily chart, indicated by a lower high and lower low.
• Weekly consolidation has begun.
Bullish Signals
• The week closed right at the previous week's low after price shaped hourly higher low
• Friday’s value zone is within the value zone of the previous four days.
The context remains very bullish – price is in a strong weekly uptrend, last month closed very strong. Overall, it is a very ambiguous case with neither side having a clear advantage. Buyers are exhausted, yet not willing to capitulate. Bears are attempting to play their game but lack sufficient strength.
The short-term outlook is neutral. From this position market can go in any direction. We need additional signs of one side gaining an upper hand. Until then, it is not advisable to place big bets on either side.
Wednesday is a very important day, with both the release of inflation data and the FOMC meeting
Disclaimer
I don't give trading or investing advice, just sharing my thoughts.

Follow Inflation: KIEMotor Vehicle insurance prices are up 2.6% month-over-month and 22% year-over-year according to the latest Consumer Price Index report published by the Bureau of Labor Statistics. This should benefit insurance sector equities, so let's take a look at the KIE Insurance ETF.
First Chart (Trend Line; 1 Year):
Taking a 1 year view we can see that (KIE) has been following this trend line perfectly since October 2023 with no breaches below.
Second Chart (50DMA; 1 Year)
Same timeframe but remove the trend line and add a 50D moving average and what do you see? Perhaps we have a bounce here at the 50D moving average, with some volume above average to support (see bottom of chart for volume bars).
Third Chart (5 Year)
Zoom out to the 5 year chart and we notice that (KIE) broke out of its sideways price action in November 2023. If using previous price action as a measurement for future price action, the range would suggest we could see a total of 25% gain from breakout area. If this measurement tool proves correct in this analysis it would suggest we have another 12% of upside left in the (KIE).
Price Targets & Gameplan:
Long @ $50
Stop Loss: $48.50
Profit Targets: $52, $55, $56
Thank you for reading and follow for more.
Sources:
U.S. Bureau of Labor Statistics. (2024, April 10). Consumer Price Index Summary . Retrieved April 11, 2024, from www.bls.gov

DxyzThis stock has been getting amazing action!
It’s super volatile but since it’s now got a monster rejection from 100+ area we can now find retracement fibs to see
Where could we get a bounce.
This has found support bounce off .618 fib of 46$ and currently trading and considlating under the 50% retracement.
If we can get a breakout of this current triangle , which is super tight right now, we can see a push to first retest 56.70 which is the 50% retracement but overall targeting the .382 fib at 68$
I have been currently buying the 51$ area with stoploss at 49$ risking 1$ per share right now. If we get a breakout above 55$ that’ll be breakout if the triangle and holding above 56.70 is gearing up to retest 68/69$ area
I am looking for a bullish push, Howver this is very volatile and a break and hold below 49$ is a stoploss to the trade as the downside tarhet os 37$ so be ready with risk management !! Good luck to all I hope we all make money on this trade

update on SPY move down to 509 and lowerthese are the zones now that i am using to short spy and get a move down to 509 and below.

Its ok to take a LOSSThis video breaks down how its ok to take a loss even when our plan does work out in the long run. We have to be able to maintain these good risk management habits even if we are eventually right. Because in the event we aren't right on the end we have a much heavier loss that's harder to recover from.

GBTC: SAME 2016 PATTERN?Hi guys,
I was looking on GBTC chart and I saw this pattern that seems too similar to first cycle for Grayscale.
Rsi moved quite similar, if we see the same scenario Btc could drop 40-50% just 1 week later the Halving, but who knows.
Is this relevant for who has bought the low? Obviously not, so for me it's not important but understanding the psychology behind the scene it is.
Let's see.

SMH in a symmetrical triangle hi traders,
The price is clearly in a symmetric triangle. Depends on which sloping it will break, it will then move upwards or downwards.
The long position can be taken if the price breaks to the upside. Target for long is 264.64$.
On another hand, short position can be taken if the price breaks down, with target 184.38$.

SPY SHORTif spy can come up into that zone, that is a shortable set up with the stop above the highs (red line)

SPY All eyes on the 1D MA50. Will it hold?SPY broke below the (blue) Channel Up and the only Support standing now is the 1D MA50 (blue trend-line). This level has been holding since the November 03 2023 break-out. If it holds, a new pattern will emerge but the medium-term bullish trend will stay intact.
If the 1D MA50 breaks though, we expect a bearish extension similar to August 15 2023, February 24 2023 and December 16 2022. As you can see those 1D MA50 bearish break-outs coincided with the 1D CCI breaking below the -100.00 oversold barrier. This is the level that the CCI is at today.
As a result, once the 1D MA50 breaks, we expect further decline towards the 1D MA100 (green trend-line). The shortest decline among the pull-backs mentioned above has been -5.93%. This gives us a rough estimate of 495.00. That would be the most optimal buy entry for the long-term. Our Target by the end of May will be 524.50.
-------------------------------------------------------------------------------
** Please LIKE 👍, FOLLOW ✅, SHARE 🙌 and COMMENT ✍ if you enjoy this idea! Also share your ideas and charts in the comments section below! This is best way to keep it relevant, support us, keep the content here free and allow the idea to reach as many people as possible. **
-------------------------------------------------------------------------------
💸💸💸💸💸💸
👇 👇 👇 👇 👇 👇

TLT- #TLT Long Idea- $TLT BuysEntry: Price broke through the 4H and 1D swing highs. Will be looking for longs/buys if the market taps the bullish zone.
Stops: Close below the all time lows will invalidate the idea.
Take Profit: Discretionary.
