A BULLISH SCENTThe Pressure on 72K is accumulating power for a gravitational breakthrough for the crypto Indutry.....BRIGHTSON
Crypto market


BTCUSDT Forms Bullish Flag Pattern, Eyeing $80000 Target.BTCUSDT has recently formed a bullish flag pattern, indicating potential for a substantial price increase. The immediate target is set at $75,000 following three months of consolidation. However, traders are advised to maintain a stop-loss strategy to manage risks.
BTCUSDT (1D Chart) Technical analysis
BTCUSDT (1D Chart) Currently trading at $69600
Buy level: Above $69500
Stop loss: Below $65900
TP1: $72000
TP2: $75000
TP3: $80000
TP4: $90000
Max Leverage 5x
Always keep Stop loss
Follow Our Tradingview Account for More Technical Analysis Updates, | Like, Share and Comment Your thoughts

CLOCK IS TICKING XRPI am sharing this small update as a reminder for everyone: the clock is ticking for XRP and i still think we will see a new ATH in less than 6 months. I think that the real price pump will begin around mid September and we will touch a new ATH in October/November. As of now, a new ATH it's around 6/7x from the actual price

BTC/USD Long TradeThis trade involves a bullish flag pattern on the 4H timeframe within an overall bullish trend. The risk to reward ratio is excellent at 1:4. With an anticipated post-halving move approaching, it offers a strong potential for significant gains relative to the risk taken.

A Practical Guide For Candlestick Patterns!Intraday trading is a method of investing in cryptocurrencies where the trader buys and sells cryptocurrencies on the same day without any open positions left by the end of the day. Intraday traders aim to either purchase a cryptocurrency at a low price and sell it at a higher price or short-sell a cryptocurrency at a high price and buy it at a lower price within the same day. This requires a good understanding of the market and relevant information to help them make the right decisions. In the cryptocurrency market, the price of a cryptocurrency is determined by its demand and supply, among other factors.
Tools such as candlestick chart patterns are very helpful to traders. We will discuss these candlestick charts and offer steps to help you read them.

Long signal for INJ/USDTThis technical analysis is based on the daily chart of BINANCE:INJUSDT on the Binance exchange. This analysis draws two price channels and evaluates support and resistance levels.
Price Channel Analysis:
The previous bearish channel is broken out, and a bullish channel is formed.
The suggested entry point is around 23.95 USDT.
Entry and Exit Points:
Entry: 23.95 USDT
Take Profit: 36.18 USDT (51.03%)
Stop Loss: 20.56 USDT (14.13%)
R/R Ratio: 3.61
Conclusion:
This analysis suggests that by adhering to the specified take profit and stop loss levels, a successful trade can be achieved. The Reward/Risk Ratio for this trade is approximately 3.61, indicating a highly favorable risk-to-reward scenario. To manage risk effectively, it is recommended to strictly follow the stop loss level.

repeat ?The current pattern is a bit similar to the one below.
The growth of the lower pattern was about 800%.
If the previous move is repeated, it will be great.
Of course, repeating the movement is not certain and is a theory.

PORTALUSDT(PORTAL) Daily tf Range Updated till 03-06-24PORTALUSDT(PORTAL) Daily timeframe range. another fairly new price action here. cause of that its gold mine of trading setups. if you can use range levels right its free profits. not much of holdup till 1.4189 all it needs retail interest. local support at 0.7491.

SANDUSDT Reversing From Its Major Support Zone!The price of SANDUSDT is reversing from its major support zone. It appears to be forming an inverse head and shoulders pattern. We can expect a 50-100% move in the next few months.
Regards
Hexa

SLPUSDT IDIA#SLP
Hello traders hope you are enjoying our Analysis.
Now we are here again with a new trading opportunity ,we will discuss today about SLPUSDT
Falling wedge Break out done in 1D time frame ✅
Expecting 50-60% profit📈

$$$IDEXUSDT, Update.Massive bull run preparation doneWelcome, Trader. Welcome to our cryptocurrency community! 🚀We are delighted to welcome you, whether you are an experienced trader or a newcomer to cryptocurrency.
We are going to discussing #IDEXUSDT 💹
#IDEXUSDT 🔥🚀
---------------
Update:
#IDEX formed a bullish peanut pattern over a 4Hr time frame 👉✅.
Breakout to this pattern is already done✔ 🎯.
We are expecting a minimum of 31% 💰 very soon
Crypto Analyst Hub
#crypto #cryptocurrency #bitcoin #ethereum #blockchain #btc #cryptotrading #cryptonews #eth #cryptocurrencies #nft #bitcoinnews #bitcoins #trading #bitcoinmining #forex #binance #cryptoart #nfts#trading #forex #trader #investing #stocks #forextrader #stockmarket #daytrader #forextrading #invest #bitcoin #daytrading #cryptocurrency #crypto #investor #investment #forexsignals #nse #chartpattern #cedarforex #candlepatterns #learntrading #bseinstitute #shorttermtrade #bankniftytrading #stockmarketph #calloptions #mqlsignal #futuretrader #tradingmemes #chartpatterns #tradingview #tradinglife #tradinglifestyle #tradingstrategy #tradingtips #tradingplan #tradingsignals #tradingaccounts #tradingsignal #tradingforex #tradingsync #tradingroom #litecoin #ethereum #bitcoincash #cryptocurrencies #ripple #btc #bitcoinnews #bitcoinmining #blockchain #eth #bitcoin #bitcoins #coinbase #cryptocurrency #crypto #bitcointrading #dogecoin
BTC
ETH
USDT
PEPE
DOGE
ALT
🛑To Get Regular Crypto Updates about crypto coins
👉Join Us at Telegram for free
👇👇👇👇👇
🛑https://t.me/CryptoAnalystHub
✅To Get Signals with Proper TP and SL or VIP Inquiriess ✅

MBOXUSDT UPDATE #MBOXUSDT(Update)
Hey dear traders. Hope you are enjoying analysis with our team. we are here to analyze MBOXUSDT today.
Symmetrical Triangle breakout done in 1D time frame .
Expecting Massive Bullish wave📈🚀

DARUSDT UPDATE #DARUSDT
UPDATE
Hey dear traders hope you are enjoying trading and analysis with our team. we are here to discuss about DARUSDT
Running towards our target 30% profit done ✅
Expecting more profit

Trade Signal for BTCUSDT: Sell**Direction:** Sell
**Enter Price:** 67540.01
**Take Profit:** 66458.64
**Stop Loss:** 68832.74
**Justification for the Forecast:**
This trade signal is generated based on a comprehensive analysis using the EASY Quantum Ai strategy. Several key factors have contributed to this prediction that BTCUSDT will move in a downward direction:
1. **Technical Analysis:** Recent price movements indicate that BTCUSDT is facing strong resistance near the entry price. Historical data from the EASY Quantum Ai strategy shows a significant number of rejections at this level, suggesting a high probability of a downward move.
2. **Volume Analysis:** An analysis of trading volumes indicates that selling pressure has been increasing, with sell orders significantly outweighing buy orders. This imbalance often precedes a price decline.
3. **Market Sentiment:** Sentiment analysis derived from social media trends and news headlines related to Bitcoin has shown an increase in negative sentiment. This is often a precursor to selling pressure as traders react to bearish news.
4. **Macro-economic Factors:** Recent reports indicate potential regulatory changes and economic factors that are less favorable for Bitcoin. These macro-economic elements contribute to a bearish outlook for BTCUSDT.
5. **Indicator Analysis:** The EASY Quantum Ai strategy utilizes a suite of technical indicators like moving averages, RSI, and MACD. Current readings show bearish crossovers and overbought conditions, further supporting a sell signal.
**Risk Management:**
- The **Stop Loss** is set at 68832.74 to limit potential losses, taking into account recent volatility and technical levels.
- The **Take Profit** target is placed at 66458.64, considering support zones and previous lows identified by the EASY Quantum Ai strategy.
This signal aims to capitalize on a short-term bearish trend while employing prudent risk management practices.
**Disclaimer:** Trading cryptocurrencies involves substantial risk, and it is essential to perform your own analysis before making any trading decisions. Always consider your risk tolerance and consult with a financial advisor if necessary.

$LINAUSDT is drawing a very interesting setupI see a lot of movements and crossing of figures on the graph of BYBIT:LINAUSDT.P
1. From the top to the down trend-line inside the tapering triangle in the left side.
2. Stochastic lateral movement inside the diamond pattern borders in the middle.
3. Forming of a probable expanding triangle on the right side.
4. Global pressure in the form of ascending triangle under all the changes above.
I know, that we are working with tons of probabilities, but I believe, that basing on my investigations and intuition, in the next 5-6 months we will observe an raising upstairs walking to the range between 0.025 and 0.031. And the first step will start very-very soon.
Does not constitute a recommendation.
#furoreggs #investing #stocks #shares #idea #forecast #trading #analysis
If you want to discuss, please subscribe and challenge this point of view.

ETH, recent pump barely scratching the surface MASSIVE MOVE NEXT
ETH recent pump was an indication of things to come -- good things.
The coin went from 1700 to 1900 within 72 hours -- indicating that a longer shifting trend is about to materialize. Based on recent news, low supply of ETH is being detected on most exchanges depicting a bullish scenario for the coin.
On weekly data, new higher lows was created both on Histogram and pricing -- conveying the recent ascend with the current price range to be the new base for the incoming significant price growth.
Weekly data price movement volatility has been on the conservative side hinting that for every higher low it established -- it is creating a solid support range.
On Tri monthly data -- it is hinting of the same bullish continuation scenario. Surging price valuation on longer time spectrum. A bubble up volume has finally appeared after 5 months of waiting, last one was on January 2023.
Expect significant price valuation for ETH in the next coming weeks.
The weekly chart is too clean, direction is certain -- no further explanation needed.
Spotted at 1850.
TAYOR
Safeguard capital always

&&&& PEOLEUSDT TARGETS HITTED %%%%PEOPLE hitted out all targets as predicted. Now here this is getting a small retesting . After this small retesting it will again follow bullish wave. Alway trade with confidence

BTC Price Prediction and Elliott Wave AnalysisHello friends,
we are at a different crossroads running, irregular a flat pattern. or starting a huge bullish to end blue (X).
Thank you for joining me in my analysis. Remember to like, subscribe, and stay tuned for more updates. See you soon!
Thanks, Bros


Ranging Market Coins remain stale during this crypto range market. WIFUSD is on my watchlist and will be buying more at the low of the range in anticipation of a bull run.

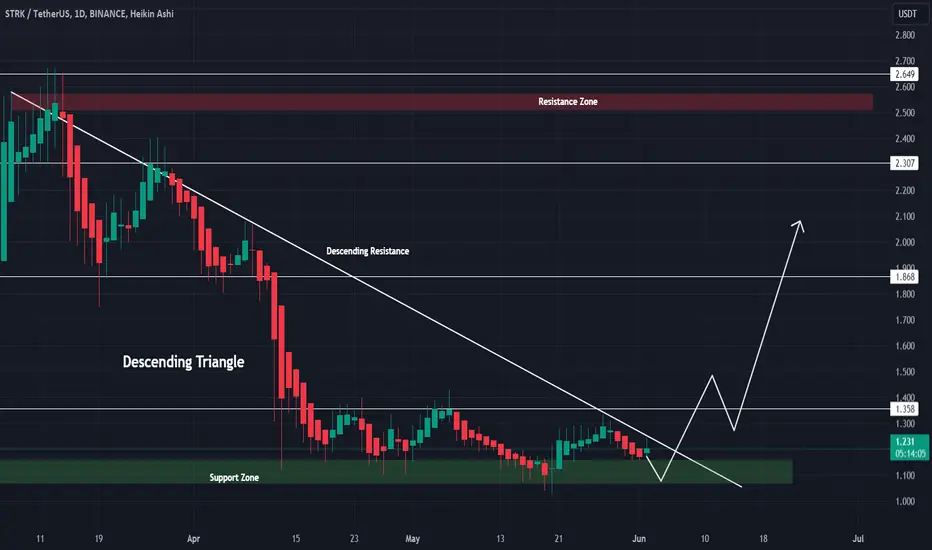
$STRK is trading within the descending Triangle chart patternSTRK/USDT
IDX:STRK is trading within the descending Triangle chart pattern. 🔺️ 🔎
The successful breakout is considered a Bullish signal. ⚡ 📈
The short-term price target for IDX:STRK is set at a minimum of 15% upside. 🚀 🎯
Detailed Analysis of Bitcoin's Recent Price MovementsDetailed Analysis of Bitcoin's Recent Price Movements
Bitcoin has recently exhibited a pattern known as an upward wedge. Initially, the price rebounded from the wedge's support line and rose to a support level that aligned with a significant buyer zone. This support level was eventually breached by the price, leading Bitcoin to trade near the 66,700 level for a period. After this consolidation, the price fell back into the buyer zone.
Following this decline, Bitcoin made a strong upward move, creating a sharp impulse that took the price up to the wedge's resistance line. During this move, it also broke through a resistance level that was associated with a seller zone. However, this upward momentum did not last long, and Bitcoin's price soon reversed direction, declining rapidly to the support level, thereby breaking the 70,400 level again.
After this drop, Bitcoin began to rise once more, eventually reaching the resistance level again. Upon hitting this resistance, the price rebounded and underwent a correction back down to the support level. Recently, Bitcoin has bounced off this support level and started to rise again.
Currently, it is anticipated that Bitcoin might make another corrective move towards the support line before rebounding to the wedge's resistance line. Therefore, the target price is set at 69,400 points, which corresponds with the resistance line of the wedge pattern.
---
This detailed explanation provides a clearer understanding of Bitcoin's recent price movements and potential future behavior based on the upward wedge pattern.
Psychology, discipline, and capital management are the three essential factors for achieving victory.
If you find our analytics valuable, please show your support by liking and commenting. Your engagement is greatly appreciated!❤️
Trade Wave.
