20/5/2024 Doge Long TradeIn 1D timeframe, DOGE had breakout Blue Trendline for few days and didn't formed a Fakeout.
(4H)
Long Plan:
Entry Price : 0.15146 (Market)
CL : Below Trendline 0.14720 (add 3-5% buffer)
TP : 0.175 - 0.187 (Between this zone)
Crypto market

Bitcoin bull signalWe found the history of 1W MACD. When MACD crosses, the price tends to fall.
We've found it at least twice in history.
Will it happen this time? If it is. $55,000 to $52,000 is the closest that is possible at this point.

ETHFI looks bullishIt looks like we have three big ABC waves on the chart.
Wave B has started from where we placed the red arrow on the chart. Wave B looks like a triangle and now it looks like we are at the end of wave d of B.
After the completion of wave e of D, we can see the rising movements of the big C wave.
The targets are clear on the chart.
Closing a daily candle below the invalidation level will violate the analysis
For risk management, please don't forget stop loss and capital management
When we reach the first target, save some profit and then change the stop to entry
Comment if you have any questions
Thank You

Batter UpAll ideas are strictly my interpretation of price action. I am not a professional trader nor is this
professional advice.
I will continually update all trades.

Official Alt Season Call: Could be close!This is a follow up on the ascending wedge forming on BTC.D
I personally think that the break of this wedge will possibly happen in a range bound environment for the price of BTC. However when there are pullbacks the alt coins will recover faster than BTC - leading to a downwards break of the thick white lines and a retest - which will probably see many alt coins increasing considerably.
A self fulfilling prophesy or fate identified?
I will update this chart once I see a break of the trend.
I do think the BTC.D can spike higher to my targets in a previous post.
note the lines on here are for this posts purpose, they are just levels i have previously identified

The Massive Potential of June's BULL-RUNNow that all of the speculations are pointing to the approval of the Ethereum ETFs , along with the positive CPI reports this week, it's safe to assume that we're about to break out of the current accumulation period.
After +60 days of correction, everyone is eager to explore the potential of the next bull-run, so let's delve right into it. HOLD YOUR BREATH!
- STAGE ONE: MAKING A NEW HIGHER HIGH
In case you haven't noticed, on the 4th of this May, we have already broken out of the downtrend that lasted since the first day of April. However, we haven't made any higher high yet, so the bearish structure is technically still valid.
Thanks to a whole bunch of good news and won rounds for crypto in the regulatory and judicial war, starting with RIPPLE surviving court and -hopefully- ending with the Ethereum ETFs approval, a break of the bearish structure seems inevitable to me, leading to a surge towards the 700B milestone.
This is going to significantly refresh the alt-coins market, making up for April's harsh losses.
- STAGE TWO: SELLING THE ETHEREUM ETF NEWS
Now that things are looking greenish for the bulls, it's time for the exchanges to make money too. A minor correction and a retest of the 700B level would be reasonable, liquidating a ton of long positions, reigniting the trauma of the resistance that ended the February - March Mini bull-run and shaking more and more hands.
And of course, there's the excuse of 'selling the news' for the exchanges to use before liquidating the crypto Futures market.
I expect the traditional Alt-coins (ETH, XRP, ADA, etc..) and AI coins to perform extremely well at this stage.
- STAGE THREE: THE JUNE BULL-RUN
May wasn't as tough as we had expected, right?
Well, this cycle is just getting started surprising us. As June approaches, Alts should see positivity due to the impact of the adoption of Ethereum. And of course, the largest piece of that green cake will be handed to the holders of any Alts related to Ethereum.
We should see AI coins continuing their dazzling performance, promising projects related to RWA and Solana's competitors performing really well at this stage.
I expect this stage to end when Ethereum makes its new ATH and as July approaches, then we should see Bitcoin taking back the lead and making its REAL ATH. Because.. you know.. 73K wasn't a real ATH (whispers).
In my opinion, this scenario can be invalidated in two cases ..
First case is if the Ethereum ETFs get disapproved.
Second case is if we somehow revisit the current cycle bottom (highlighted on the chart).
So that was it! My humble advice?
- DO NOT use leverage, you don't need to challenge the exchanges and risk your capital. Enjoy a happy and calm June by buying your favorite coins on the Spot market.
- DO NOT hold your alts for too long after Ethereum makes its new ATH. Bitcoin has to take back the lead and make its way to a new ATH. Don't worry, you will get many new opportunities during Bitcoin's bull-run.
Note: This was an exploration of a potential scenario based on the current context and state of the market, not financial advice.

There are two falling possibilities for BTCThe first possibility is that it has made a double peak, there is a possibility of it falling down.
Then it will go up again, make the right shoulder, create the obo formation and hit the bottom harder.
If this scenario occurs, the bottoms will be crushed excessively
There is no certainty in crypto, this is a possibility

BTC/USDT 4HInterval Chart ReviewHello everyone, let's take a look at the 4H BTC to USDT chart as we can see that the price has bounced off the upper boundary of the downtrend channel, potentially giving room for a stronger downward move.
However, if BTC tries to exit the channel again, the price must overcome a very strong resistance zone from $71,959 to $73,853. However, after breaking above this resistance zone, an upward impulse to the area of $83,029 will be possible.
Now let's move on to the stop loss in case of further market declines:
SL1 = $68,378
SL2 = $66,144
SL3 = $62,363
SL4 = $60,014
AND
SL5 = $56,634
Looking at the RSI indicators and the STOCH indicator, you can see how both of these indicators rebounded from the upper limit, which resulted in a downward price movement, with room for the price to recover more. It is worth mentioning here that the RSI indicator has approached the upward trend line, which is worth watching because relying on it may again result in an upward movement.

BTCUSDT at hourly support, likely to bounce towards 71.2kThe price has hit the weekly resistance WR1 and has pulled back from there. The price has been pushed down from that resistance and it has now hit hourly support HS1 on this pullback. This support zone will provide support to the price and the price is likely to bounce enough for a long trade opportunity. We try this long trade towards weekly resistance around 71.2k area. If we lose this support then we are going likely for the daily support zone.

LDO ROADMAP (1D)We have been following LDO for a long time.
The F wave is ending. The price will soon enter the bullish wave G.
The target could be to sweep the liquidity pool above the chart, which we have shown in $$$
If the price returns to the green range, we will look for buy/long positions
The targets are clear on the chart.
Closing a daily candle below the invalidation level will violate the analysis
invalidation level: 1.0403
For risk management, please don't forget stop loss and capital management
When we reach the first target, save some profit and then change the stop to entry
Comment if you have any questions
Thank You

Alikze »» SOL |Continuation of scenario 5 bullishAccording to the previous analysis, now with more than 110% growth since the time of the analysis, which is in the ascending wave 5, it can continue until the area of 2.618 or the next supply area of this extension of the wave, which will reach the major ceiling area, which is an important supply area. It will be and after that I expect a correction wave after which we have to do the update. But for now, a short-term trend can be imagined for it.
If the behavior and structure of the post changes, it will be updated.
»»»«««»»»«««»»»«««
Please support this idea with a LIKE and COMMENT if you find it useful and Click "Follow" on our profile if you'd like these trade ideas delivered straight to your email in the future.
Thanks for your continued support.
Sincerely.❤️
»»»«««»»»«««»»»«««

Short term trade ideaRSI, EMA, and trend lines all point bullish on the 15 min time frame. The Trend line sitting at roughly 71,150 would be good entry on a short. Bitcoin should come back to 67k. Take profit on short around 67k. Not financial advice

BAND - short-term analysisHi traders,
BANDUSDT on 1D time frame looks very good.
Triple bottom playing out and more bullish price action is expected in the next days and weeks.
This year it's not 'sell in May and go away' for altcoins but more like 'BUY IN MAY'.
Target: 2,49 $
If you're very bullish on BANDUST, you can target 2,80$
Each fib level shown on the chart may act as a resistance so don't forget to take profit on the way up.
Good luck

BTC reached top - ready for correction The 72k area was most probably the top for now. Probably the ETH ETF news will be selling the news again this week. Expecting at least 48k for reversal and continuation of the bull.

EthereumI am taking Ethereum long. Risk is clearly defined, and I believe there is good upside to be had.
I have been filled at $3,027


SAME IDEA FOR 4HSAME IDEA FOR 4H
NOTE FOR 1D (I think it will move like this, but meanwhile it can change. For now, I think we need to close above the EMA 200 first, then try to get back and fill the FVG. After that, we can get back above the EMA to reach the Fibonacci levels of 50-61.8.)

Nice analysis. I hope it helpsDoge lags behind Bitcoin, but seems to be forming a nice upward lane.
Looks like a nice long shot

Trust me, this analysis will get you more moneyI think we're in a long wave of the overall wave. However, it may be a long reaccumulation phase before we reach wave 5, which will be a very high phase. An ambitious end to this wave could be a sell-off/rally to 2075 before it surges (can't go below Wave 1), and my Wave 5 forecast can reach Fibonacci levels of 1.618-8648 or 2.618-13442.
Good luck!

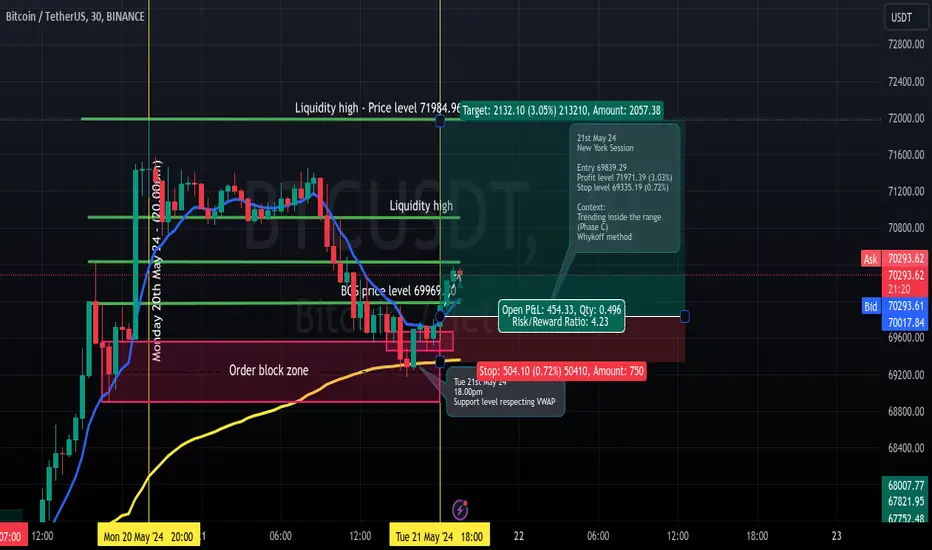
Long trade
21st May 24
Entry 69839.29
Profit level 71971.39 (3.03%)
Stop level 69335.19 (0.72%)
Context:
Trending inside the range
(Phase C)
Whykoff method
It might be end of the bullish trend in 4h chart.If daily price closes in the orange channel and continues to range around the roof in the mentioned channel, it might be a good opportunity for a short position. I'm still long, BUT am waiting for some more confirmations in the solbtc and btc.D charts.

FIL Pump To 24 % ?After a 40-day consolidation period within a box range, a breakout opportunity may be imminent. However, a crucial decision arises:
High-Risk Entry vs. Optimal Entry Point
The $6.37 support level provides a risky entry point, but could also be an optimal entry. Conversely, the $6.72 resistance level could provide a more conservative entry, but the price may have started to rise from $6.37 and we may not be able to make a decent entry in the $6.72 range.
Keep in mind that RSI it is in a range that can cause a strong upward movement
Your Entry Strategy:
The decision of where to enter the trade lies with you, exercising sound capital and risk management principles.
Disclaimer:
This analysis solely reflects my perspective and should not be construed as financial advice. The responsibility for any profits or losses rests solely with the individual trader. I merely identify potential entry points for consideration.

Avax exits demandAVAX is finally exiting the weekly demand zone and consolidation phase on this BTC pump. I expect a steady push towards 60 dollars over the next few weeks. There is a ton of resistance between 41-43$. AVAX is finally back above the EMAs, that with the reversing stochastic on the weekly show the pivot.
Short-term: 43$ area
Medium-Term: 60$
Year target over 100$
