EURUSD - Sell SignalHello, here's a sell signal for EURUSD.
All analysis are covered extensively on the chart. I hope you enjoy this trade.
EURUSD trade ideas

EUR-USD SellI see potential sells for eur-usd if price simply breaks back below 1.08480 for entry 1 or 1.08359 for entry 2. Making my tp at 1.08051. I could see myself taking this position if price goes down with momentum perferably at New York session. But this might also occur during London session. Good Luck

EURUSD Swing trade IdeaEURUSD has formed a Bullish Flag continuation pattern in 28 days which will mature in 2-3 days for a proper entry and will take four weeks to most probably hit TPs. There is no divergence and RSI value is 58 which both adds to my theory for EURUSD to continue uptrend.

EUR USD PRICE - BACK TO THE RESISTANCE ZONE we got a breakout from down trend line, make a small long entry to resistance zone, follow for more live updates...

Analysis of Currency Correlations in Forex TradingAnalysis of Currency Correlations in Forex Trading
Navigating the complex landscape of forex trading requires a nuanced understanding of currency correlations. This article discusses the various aspects of the concept, from its definition to practical applications in the world of forex trading.
Understanding Forex Currency Correlation
Acknowledging the correlation concept may help traders get a better understanding of forex market conditions and aid in the planning of their trades.
Currency correlations refer to the statistical relationship between different currency pairs, revealing how they tend to move in relation to each other. This concept is grounded in the idea that the values of currencies can be influenced by common factors such as economic indicators, interest rates, and market sentiment.
Historical and Dynamic Correlations
Observing the historical and dynamic relation between forex pairs that correlate provides a nuanced perspective on the evolving nature of market relationships. Historical price data shows the patterns and trends over time, offering insights into how pairs have moved in relation to each other in various market conditions. On the other hand, dynamic correlations acknowledge the ever-changing nature of financial markets.
Influencing Factors
Economic indicators of a country, such as inflation rates and employment figures, serve as fundamental drivers influencing the strength or weakness of its currency. Also central to the landscape are interest rates, with decisions made by central banks impacting currency values significantly. Market sentiment also contributes to the ebb and flow of currency interrelations.
Interpreting Currency Correlations
The relationship between currency pairs can vary in terms of intensity and duration. Let’s explore how traders measure correlations and which aspects they need to consider.
Identifying Strong and Weak Relationships
The correlation coefficient is the technical indicator that quantifies the degree to which two currency pairs move in relation to each other. A reading close to +1 indicates a strong positive correlation, while a coefficient near -1 signifies a strong negative correlation. An indicator reading near 0 suggests a weak or non-existent correlation.
Correlation Between Forex Pairs May Change Over Time
Major economic shifts and events can alter the relationships between currency pairs. The usual negative correlation can transform into a positive one, showcasing how economic turbulence can reshape established relationships. For example, AUD/USD and GBP/USD pairs have a strong positive correlation on the daily chart, which becomes neutral on the weekly timeframe. If we consider a monthly period, the correlation will become positive again.
Correlations can manifest differently over various timeframes. Short-term correlations may be influenced by daily economic releases or unexpected events, while long-term correlations may be shaped by broader economic trends, including adjustments in a country's interest rates, alterations in monetary policies, or a combination of economic and political events. Short-term correlations may guide intraday or swing trading, while long-term correlations can influence position trading and investment decisions. The suitability of timeframes is closely tied to the chosen forex correlation strategies.
Tools and Resources for Currency Correlations Analysis
In addition to the correlation coefficient, there may be custom indicators to calculate and display currency correlations. These indicators can be programmed to suit your specific needs and preferences. Charting platforms equipped with customisation features also enable the simultaneous visualisation of multiple pairs, aiding in the identification of patterns and trends. Forex correlation matrices, available on various trading platforms, offer a comprehensive overview of the interdependencies of currency pairs.
Types of Currency Pair Correlation
The relative movements of forex pairs can be discussed from two different perspectives. Below, we delve into that matter, offering some practical examples.
Currency Correlations
While analysing the interrelationship between currency pairs, traders distinguish between three types of correlation.
Positive: EUR/USD and GBP/USD
A positive relationship is when two currency pairs move in the same direction. Over a specific period, when the EUR/USD experiences an upward movement, the GBP/USD also tends to rise correspondingly.
Negative: GBP/USD and USD/JPY
Negative correlations indicate movement in opposite directions. For example, when the USD/JPY experiences an upward trend, the GBP/USD tends to exhibit a downward movement, and vice versa.
Neutral: EUR/GBP and AUD/CAD
This is the case when there is no systematic relation between the exchange rates of the two currencies. The chart below shows that the price movements of EUR/GBP and AUD/CAD currency pairs do not exhibit a consistent pattern of moving in the same or opposite directions.
Curious about how other pairs move in relation to each other? Visit FXOpen and try out TickTrader’s free charting tools.
Intermarket Correlations
In addition to currency pairs, intermarket correlations explore the interconnected relationships between various financial assets. For instance, the relative price movements between currency pairs and commodities or equity markets can influence forex trading strategies. Traders always consider these broader market dynamics to make informed trading decisions.
Risk Management
By identifying pairs with negative correlations, traders can potentially offset losses in one position with gains in another through a good hedging strategy. Positive patterns, on the other hand, can help confirm trends and reinforce trading strategies. Incorporating correlations into risk management strategies may help traders assess the overall risk exposure of their portfolios more accurately.
Challenges and Limitations
One challenge lies in the dynamic nature of correlations, which can shift unpredictably in response to economic events or changing market sentiment. Over-reliance on historical data poses a risk, as past patterns may not necessarily repeat in the future. Additionally, currency pairs are influenced by various global markets, while liquidity issues in certain currency pairs may affect the reliability of the patterns identified, particularly in times of heightened market volatility.
Takeaway
Understanding currency correlations is one of the key components in designing forex strategies. While their analysis offers valuable insights, a broader approach that considers various other market factors is essential for effective performance in forex trading. Ready to try your forex strategies? You can open an FXOpen account today!
This article represents the opinion of the Companies operating under the FXOpen brand only. It is not to be construed as an offer, solicitation, or recommendation with respect to products and services provided by the Companies operating under the FXOpen brand, nor is it to be considered financial advice.

EURUSD continues to increase prices Hello everyone,
As anticipated, the EUR/USD pair has risen in line with the flag pattern, breaking out of the downward trendline and is now trading above 1.087. A stronger recovery could see EUR/USD revisiting the May high of 1.0894, followed by the March high of 1.0981.

EURUSD STRUCTUREHi guys its DR Trade again, your best market structure coach, like In said im not here to tell you that your trading strategy is wrong and you should use my own , im here to show you the direction of the market for you to align it with your trading style, we will be following this for the weak to come, we are in a bearish market for this pair so till we get our blocks and confirmations we will sit on our hands and wait, do well to like share and follow, stay tuned for more updates.
EUR/USD Long Setup: Strategic Entry at 1.08288 EUR/USD Buy Trade Analysis
We are planning to enter a long position on EUR/USD at 1.08288, aligned with the 61.8% Fibonacci retracement level. The overarching trend remains bullish, indicating potential for a continued upward movement after the current corrective phase.
we may see further downside before the uptrend resumes, presenting a strategic buying opportunity at more favorable risk/reward levels.
- Key Levels:
- Entry:*1.08288 (61.8% Fibonacci retracement level)
- Stop Loss: 1.0790
- Take Profit: 1.0872 (targeting a significant resistance level)
Fibonacci Confluence:
- There is a Fibonacci confluence area around 1.0828, reinforcing this level as a strong support zone and an ideal entry point for long positions.

EUR/USD in multi timeframe Hello everyone,
I would like to share my opinion on EUR/USD across multiple timeframes. Upon analyzing the daily chart, it is evident that the price is currently in a critical zone and is displaying signals that suggest a potential move towards lower prices in the 4-hour and 1-hour timeframes.
Based on this analysis, I believe that as long as the price remains below 1.0940 in higher timeframes, it could present an opportunity for a short position. However, it's important to note that if the price closes above the daily zone, it would invalidate this analysis and require a reassessment.
Please remember to exercise caution and use appropriate risk management techniques when trading EUR/USD or any other currency pair.
If you have any further questions or need clarification, please let me know.


EURO - Price can exit from channel and continue rise to $1.0910Hi guys, this is my overview for EURUSD, feel free to check it and write your feedback in comments👊
Recently price started to grow near support line and reached $1.0860 level, which coincided with resistance area.
Then EUR made downward impulse, breaking support line and support level, which coincided with support area too.
But then, price started to grow inside rising channel, where it broke $1.0655 level, and then continued to grow.
A short time later, EUR rose to resistance line of channel and exited, after which rose to resistance area.
After this, price turned around and soon declined lower $1.0860 level, breaking it again inside falling channel.
In my mind, Euro can decline a little, after which bounces up to $1.0910, exiting from channel and breaking resistance level.
If this post is useful to you, you can support me with like/boost and advice in comments❤️

EURUSD LONGEURUSD has successfully broken and retested the ascending triangle pattern it formed last week. Expecting this to be a high quality trade to end the month.

EURUSD Expected Growth! BUY!
My dear subscribers,
My technical analysis for EURUSD is below:
The price is coiling around a solid key level - 1.0833
Bias - Bullish
Technical Indicators: Pivot Points Low anticipates a potential price reversal.
Super trend shows a clear buy, giving a perfect indicators' convergence.
Goal - 1.0849
About Used Indicators:
By the very nature of the supertrend indicator, it offers firm support and resistance levels for traders to enter and exit trades. Additionally, it also provides signals for setting stop losses
———————————
WISH YOU ALL LUCK

EURUSD Trade Idea - May 22, 2024The expectation for EURUSD - price continued its upward trajectory as evidenced by the continuation of HH and HL. Low trade volume at this time is causing the expected consolidation/weakening of the uptrend.
Bearish orderflow has been noted at the 1.08827 region, just above a previous daily high created on April 9, 2024. The expectation is that the combination of the orderflow and previous will cause price to retrace.
An important level being watched is the 1.08008 price region due to the folowing factors: 1) Golden Ratio Fib Level 2) Previous support/resistance level on the 4h TF.
Increased trading volume during the London and New York session, combined with an overall positive outlook for the pair, should see the increase in price at least up to the 1.09660 level over the next 18 hours.


E/u berish FVGe/u berish fvg on a 15m TF i aspect e/u to have a short time sell before continuing the up trend making 1 more swing to my flag

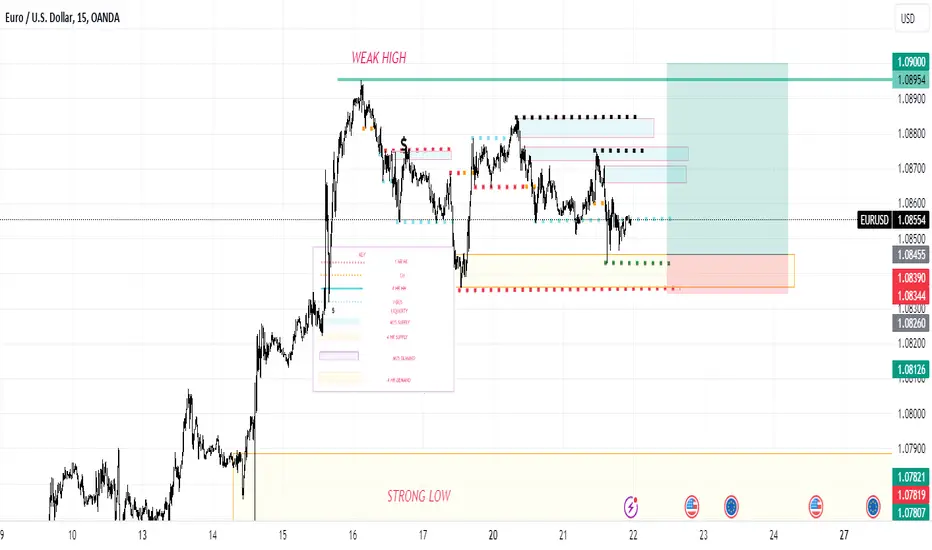
Euro / U.S. Dollar_ Prices _ Next _ week_ Under _ Trading _Euro / U.S. Dollar_ Prices _ Next _ week_ Under _ Trading _ Venue _ OANDA. \
I don't do Patters, Indicator etc as they follow (me = Mathematics) so the market = Time, Date, History but I will do one so this provide a clear evidence of beauty of mathematics!
This cover for the next 3 weeks prices:
Distribution price : 1.09284
Retest after the distribution price: 1.07937
Then:
next price : 1.10645
Retest : 1.08979
Then:
$1.11609
Expecting a major drop from here!

EURUSD : Continue adjusting !The EUR/USD exchange rate declined on Wednesday after the latest Federal Reserve (Fed) meeting minutes revealed that the Federal Open Market Committee (FOMC) remains steadfast in waiting for more evidence that inflation will decrease to 2%. This has lowered risk appetite, as investors continue to hope for dovish signals from the US central bank.
EUR/USD is currently falling below the 34 and 89 EMAs, sitting at 1.0834, and is trying to maintain the 1.0820 level. The pair has retreated after an unsuccessful attempt to sustain a rally at 1.0900.
The daily candle is inching towards the 0.618-0.5 Fibonacci retracement levels, despite the ongoing short-term bullish movement.

EUR USDLooking at the current market structure we, have not broken the 4 hour swing high and we far from the swing low. I expect for the EURUSD to continue on a HTF uptrend it will need to first draw on liquidity below my demand, and then rally up. However due to fomc tomorrow we could see that demand zone get mashed through and it could try to break my send 4 hour demand zone which is also at my swing low. If it does break the swing low could expect a change of direction for EURUSD
DXY break down, means EURUSD upThis is a continuation of my previous TA. We have to look at DXY, it's currently touching support. If it breaks down (I am a bit biased there). Then we will see EURUSD go up. Daily graph on EURUSD looks even more bullish. The only downside would be that the pattern really is pulled towards support and I have seen this kind of patterns breaking down.
My previous chart:

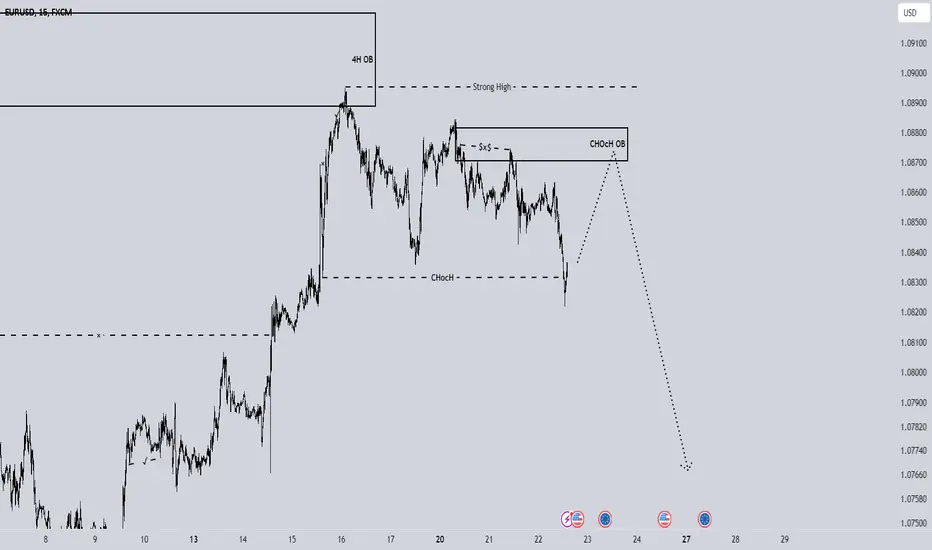
Euro / U.S Dollar _ Under _ Trading _ Venue _ FXCMEuro / U.S Dollar _ Under _ Trading _ Venue _ FXCM
Note : Price can be different with other Trading Venue.
Next prices :
$1.08721
$1.08763
$1.08817
$1.08839
$1.08873
1.08889
1.08904
1.08925
Short break from here.

EURUSD: DAY 3 SHORTS in the marketHi everyone and welcome to my channel, please don’t forget to support all my work subscribing and liking my post, and for any question leave me a comment, I will be more than happy to help you!
“Trade setups, not movements”
Let’s jump into the Technical Analysis:
WEEKLY TEMPLATE (1hr chart):
Since Monday this market has been trending down, triggering shorts breakout traders in the market for three days in a row, potential signal of reverse considering the price at the low of the week
DAILY TEMPLATE (15min chart):
Price after asian session printed high low of the day, it pinned down into the LOW and pumped up.
THESIS :
Major red news on calendar, no trade before 9:45am NYT
Long: considering 3 days of order flow trapped lower and lower, money and stops are placed above the HOW, this could complete a weekly dump and pump template by tomorrow.
Short: I can't exclude that this market is still breaking down and keep going lower considering, however, the market still in the backside of the move.
SETUP :
Long: dump into the previous closing price (CP), consolidation for 30/45 min and pump back to the HOW, or eventually first bar entry after news release If a green strong momentum bar is presented with news.
Short: Pump into Monday low (opening range), or previous HOD, consolidation for a dump back into the current LOD/LOW.
If none of this scenario will present, I wouldn't consider any other trade setup variations.
Please note that the purpose of my analysis is to help me and you hunting the best trade setup for the day, none of my technical aspects are a way to forecast any directional market movement.
Gianni

EURUSD has broke back of interests for the weekEarlier this week, ECB President Christine Lagarde expressed confidence in the euro zone inflation being under control. In contrast, the recently released Fed minutes indicate a negative impact on the committee's confidence in achieving 2% inflation and suggest that it will take more time to recover. The minutes were recorded before the latest US CPI data, highlighting that a single positive print is not enough for the Fed to consider interest rate cuts seriously.
EURUSD was expected to give up last week's gains as the FX market focused on higher yielding currencies like the US dollar, Pound Sterling, and the Kiwi dollar. Despite breaking out of an ascending channel, EURUSD traded slightly higher in the London AM session following improved European flash PMI data for May. German manufacturing data showed signs of improvement, moving closer to the neutral 50 mark, and there was a slight increase in sentiment in the services sector as well.
Channel support, now resistance, serves as the nearest challenge to dollar strength heading into the end of the week. 1.0800 and the 200-day simple moving average (SMA) present downside levels of interest.
