Sell GBPAUD H&S PatternSell GBPAUD H&S Pattern in m30
Entry @ 1.9054
TP - 1.8950
SL - 1.9110
Thank you
GBPAUD trade ideas

GBPAUD SELL | Idea Trading AnalysisGBPAUD is moving in a descending channel between the trend lines and Resistance area. Is near the resistance, where price dropped before.
We expect a bearish move from the confluence zone.
Hello Traders, here is the full analysis.
I think we can soon see more fall from this range! GOOD LUCK! Great SELL opportunity EURJPY
I still did my best and this is the most likely count for me at the moment.
-------------------
Traders, if you liked this idea or if you have your own opinion about it, write in the comments. I will be glad 🤝

GBPAUD Long Setup1.GBPAUD broken the current trendline but hasn't crossed 200 EMA yet. So we have to wait for it.
2.Once we got the confirmation we can take an entry for Long from the support zone.
3.Recent AUD negative news may impact against GBP after a huge a Short. This might be a reversal for a GBPAUD.

GBPAUD PLAYED OUT AS I PREDICTEDPSTG 1& 2 were hit after 3 weeks,
One of the most hard weeks of my trading career


GBP/AUD SHORTGBP/AUD SHORT " break of structure + 72% fib retracement + daily resistance with 50% fib retracement "


GBPAUD SELLGot a 3m BoS on the 15/3m order block
Price has pulled back to .786 OTE
TP 1 is Green line


Buy GBPAUD Triangle BreakoutThe GBP/AUD pair on the M30 timeframe presents a Potential Buying Opportunity due to a recent breakout from a Triangle Pattern. This suggests a shift in momentum towards the upside and a higher likelihood of further advances in the coming hours.
Possible Long Trade:
Entry: Consider Entering A Long Position Above The Broken Trendline Of The Triangle After Confirmation. Ideally, This Would Be Around 1.9235.
Target Levels:
1st Resistance – 1.9334
2nd Resistance – 1.9400
Stop-Loss: To manage risk, place a stop-loss order below 1.9180. This helps limit potential losses if the price falls back unexpectedly.
Opportunity Breakdown:
Triangle Breakout: Price action recently broke above a bullish triangle, a continuation pattern suggesting further upside potential.
Retest Confirmation: The price has retested the broken resistance line of the triangle and held, indicating strong buying pressure. This retest adds confidence to the breakout.
Ichimoku Cloud Support: The current price sits comfortably above the Ichimoku cloud, a technical indicator that often signals bullish momentum when the price is above the cloud.
Thank you.

GBPAUD Turned bullish ?Today GBP's CPI was good and it just broke a minor trendline however it's still behind 200EMA though

Could GBP/AUD reverse from here?Price is rising towards the pivot which has been identified as an overlap resistance and could reverse to the 1st support.
Pivot: 1.9313
1st Support: 1.9093
1st Resistance: 1.9429
Risk Warning:
Trading Forex and CFDs carries a high level of risk to your capital and you should only trade with money you can afford to lose. Trading Forex and CFDs may not be suitable for all investors, so please ensure that you fully understand the risks involved and seek independent advice if necessary.
Disclaimer:
The above opinions given constitute general market commentary, and do not constitute the opinion or advice of IC Markets or any form of personal or investment advice.
Any opinions, news, research, analyses, prices, other information, or links to third-party sites contained on this website are provided on an "as-is" basis, are intended only to be informative, is not an advice nor a recommendation, nor research, or a record of our trading prices, or an offer of, or solicitation for a transaction in any financial instrument and thus should not be treated as such. The information provided does not involve any specific investment objectives, financial situation and needs of any specific person who may receive it. Please be aware, that past performance is not a reliable indicator of future performance and/or results. Past Performance or Forward-looking scenarios based upon the reasonable beliefs of the third-party provider are not a guarantee of future performance. Actual results may differ materially from those anticipated in forward-looking or past performance statements. IC Markets makes no representation or warranty and assumes no liability as to the accuracy or completeness of the information provided, nor any loss arising from any investment based on a recommendation, forecast or any information supplied by any third-party.

Corrective sideway patternDear analysts and traders,
I trust this message finds you in good health and high spirits as you prepare to approach the upcoming week with renewed vigor. I extend my best wishes for continued success in all your business pursuits. It is essential to emphasize that sustained success in business hinges significantly on the consistent establishment and adherence to your principles.
As an advocate of the Elliott Wave principle, I regard this methodology as a valuable instrument for market analysis. Over the past three years, I have honed my approach by amalgamating this principle with a meticulous evaluation of diverse market scenarios. I strive to mitigate market uncertainties by upholding a broad spectrum of market perspectives, enabling me to discern market structures with utmost precision.
I am pleased to share my analysis with you, with the disclaimer that I do not offer buy or sell recommendations. My perspective on analytical ideas remains entirely impartial, and if my analysis aligns with your standards, it can serve as a compass for informed decision-making.
I have enclosed my prior analysis of the same market for your perusal and comparison. All aspects of my analysis are clearly delineated for clarity. Nevertheless, familiarity with the Elliott Wave principle theory facilitates comprehension of the analytical concept. I apologize for the repetitive nature of the text, as my week is occupied with formulating analytical and educational ideas, as well as engaging in trading activities and managing my social networks. Due to time constraints, I am unable to provide textual explanations for every idea, hence the inclusion of a separate text alongside the labeling. Should the text be unclear, I am available to elucidate the key points.
My rigorous study of the Elliott Wave Principle spanned nearly three years, during which my grasp and utilization of this invaluable tool evolved. My progress thus far stands as a tribute to the legacy of Ralph Nelson Elliott, whose brilliance underpins my accomplishments. May he rest in peace.
I am grateful for your unwavering support and benevolence, and I eagerly anticipate your feedback and constructive criticism.
May my analysis serve as a valuable asset in your business endeavors, and I remain yours sincerely,
Mr. Nobody
Previous analytical ideas
Double zigzag pattern bearish scenario

Could GBP/AUD bounce from here?Price is falling towards a support level which is an overlap support that aligns with the 50% Fibonacci retracement and could potentially bounce from this level to our take profit.
Entry: 1.90167
Why we like it:
There is an overlap support which lines up with the 50% Fibonacci retracement.
Stop loss: 1.89433
Why we like it:
There is a pullback support level.
Take profit: 1.91494
Why we like it:
There is a pullback resistance level which aligns with the 61.8% Fibonacci retracement.
Please be advised that the information presented on TradingView is provided to Vantage (‘Vantage Global Limited’, ‘we’) by a third-party provider (‘Everest Fortune Group’). Please be reminded that you are solely responsible for the trading decisions on your account. There is a very high degree of risk involved in trading. Any information and/or content is intended entirely for research, educational and informational purposes only and does not constitute investment or consultation advice or investment strategy. The information is not tailored to the investment needs of any specific person and therefore does not involve a consideration of any of the investment objectives, financial situation or needs of any viewer that may receive it. Kindly also note that past performance is not a reliable indicator of future results. Actual results may differ materially from those anticipated in forward-looking or past performance statements. We assume no liability as to the accuracy or completeness of any of the information and/or content provided herein and the Company cannot be held responsible for any omission, mistake nor for any loss or damage including without limitation to any loss of profit which may arise from reliance on any information supplied by Everest Fortune Group.

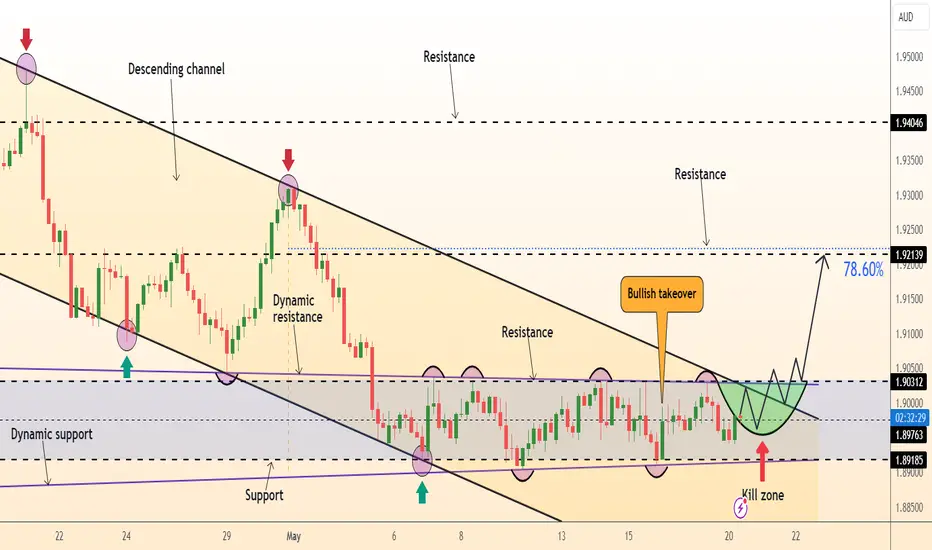
DeGRAM | GBPAUD trading on a range breakoutGBPAUD is moving in a descending channel between the trend lines.
The chart is trading in the range between the levels. The longer the price stays in the upper half of the range, the more likely an upward breakout.
After reaching the support, the pair formed a bullish takeover.
We expect growth after the breakout of the range.
-------------------
Share your opinion in the comments, and support the idea with a like. Thanks for your support!
GBP AUD IDEA- structure in fib
- Trend Line Break in the weekly
- Elliot wave sequence completed
- waiting on a entry in the daily or 4h time frame in the 'daily zone'

Short GAVery simple strategy.
Impulse…
… Correction
The main confluence with price action is the current rejection on the fib level
Price is showing signs of exhaustion
It can be risky to go against the trend
But that’s what we do

GBPAUD forming a top?GBPAUD - 24h expiry
Although the bulls are in control, the stalling positive momentum indicates a turnaround is possible.
Price action looks to be forming a top.
Risk/Reward would be poor to call a sell from current levels.
Preferred trade is to sell into rallies.
Bespoke resistance is located at 1.9230.
We look to Sell at 1.9230 (stop at 1.9280)
Our profit targets will be 1.9110 and 1.9070
Resistance: 1.9230 / 1.9260 / 1.9315
Support: 1.9170 / 1.9120 / 1.9065
Risk Disclaimer
The trade ideas beyond this page are for informational purposes only and do not constitute investment advice or a solicitation to trade. This information is provided by Signal Centre, a third-party unaffiliated with OANDA, and is intended for general circulation only. OANDA does not guarantee the accuracy of this information and assumes no responsibilities for the information provided by the third party. The information does not take into account the specific investment objectives, financial situation, or particular needs of any particular person. You should take into account your specific investment objectives, financial situation, and particular needs before making a commitment to trade, including seeking advice from an independent financial adviser regarding the suitability of the investment, under a separate engagement, as you deem fit.
You accept that you assume all risks in independently viewing the contents and selecting a chosen strategy.
Where the research is distributed in Singapore to a person who is not an Accredited Investor, Expert Investor or an Institutional Investor, Oanda Asia Pacific Pte Ltd (“OAP“) accepts legal responsibility for the contents of the report to such persons only to the extent required by law. Singapore customers should contact OAP at 6579 8289 for matters arising from, or in connection with, the information/research distributed.

Short IdeaBearish structure, re-tracement leg in progress. Waiting for price to reach zone before initiating sells. Price may potentially create more liquidity within range before taking zone.
Safe and happy trades.

GBPAUD Bank Bullish Money heist Plan to be RichMy Dear Robbers / Traders,
This is our master plan to Heist GBPAUD Bank based on Thief Trading style Technical Analysis.. kindly please follow the plan I have mentioned in the chart. Our target is Red Zone that is High risk Dangerous Level, market is overbought / Consolidation / Trend Reversal at the level Bearish Robbers / Traders gain the strength. Be safe and be careful and Be rich.
Note: If you've got a lot of money you can get out right away otherwise you can join with a swing trade robbers and continue the heist plan,
Loot and escape on the target 🎯 Swing Traders Plz Book the partial sum of money Use Trailing Stop To Protect Looted Money and wait for next breakout of dynamic level / Order Block, Once it is cleared we can continue our heist plan to next new target it will update after the Breakouts.
support our robbery plan we can easily make money & take money 💰💵 Join your hands with US. Loot Everything in this market everyday.

Gbpaud likely more upside...Hello fellow traders , my regular and new friends!
Welcome and thanks for dropping by my post.
Could have break up or some pullback before heading higher. In my watchlist
Do check out my recorded video (in trading ideas) for the week to have more explanation in place.
Do Like and Boost if you have learnt something and enjoyed the content, thank you!
-- Get the right tools and an experienced Guide, you WILL navigate your way out of this "Dangerous Jungle"! --
*********************************************************************
Disclaimers:
The analysis shared through this channel are purely for educational and entertainment purposes only. They are by no means professional advice for individual/s to enter trades for investment or trading purposes.
*********************************************************************

GBP/AUD BEST PLACE TO BUY FROM|LONG
Hello,Friends!
GBP/AUD pair is in the uptrend because previous week’s candle is green, while the price is evidently falling on the 2H timeframe. And after the retest of the support line below I believe we will see a move up towards the target above at 1.922 because the pair is oversold due to its proximity to the lower BB band and a bullish correction is likely.
✅LIKE AND COMMENT MY IDEAS✅
