0-618

EURUSD:A Buying OpportunityThe starting point of last drop has been broken out,maybe a short-term rally is coming and the market is pulling back the 0.618RET.
So it is good to buy at 1.074-1.076 levels when price action gives the signal.
SL:below 1.07
TP1:1.08
TP2:1.085 and further more

BTCUSD:Short AgainIt is a good opportunity to short BTCUSD and reasons are as follows:
1.the 0.618RET of previous decline is at 718 level;
2.the 1.618EXT of previous rise is at 715 level;
3.the potential AB=CD is completing at 716 level;
4.the previous structure also works at this zone.
So short positions could be opened at 712-718 levels when price action is good at the PRZ.
SL:above 725
TP1:700
TP2:690 and further more

COPPER:Short by the 0.618 and 1.618EXTThe market has soared in last three weeks and the price has entered a very important zone.
The 0.618 retracement of previous decline is at 2.56 level and 1.618EXT of previous rise is also at the same level.
Meanwhile a previous structure also works at this zone.
So it is good to sell short at 2.56-2.63 levels when bearish candles appear.
SL:above 2.63
TP1:2.30
TP2:2.08 and further more

USOIL:Buy at 0.618 RetracementThe market has broken though the starting point of last drop and the price is pulling back the 0.618 retracement.
Meanwhile the previous symmetrical low point also locates in this zone.
So it is good to buy long at 43.8-44.2 levels when bullish candles appear.
SL:below 43
TP1:46
TP2:47 and further more

AUDCHF:Potential Bearish Bat Pattern and 0.618 RetracementThe potential bearish bat pattern will complete at 0.756 level and the 1.618EXT of the AB is at the same level.
Meanwhile the 0.618 retracement of the previous decline locates at 0.756.
In addtion,the previous strcuture also works at this zone.
So it is good to sell at 0.756 level.
SL:above 0.758
TP1:0.750
TP2:0.744

USDJPY:A Shorting OpportunityThe market is retesting the 0.618 retracement and the neckline works at this area.
So it is good to sell at 104.4-104.6 levels.
SL:above 105.2
TP1:103.2
TP2:102.5 and further more

BIDU:A Good Oppotunity to BuyThe upper edge of triangle has been broken through and the market has pulled back the breached down trendline. Meanwhile the market is retesting the 0.618 fibo retracement.
So it is a good opportunity to buy long at 167-172 levels.
SL:below 155
TP1:200
TP2:215
TP3:ultimate target 250

NGAS:A Good Opportunity to SellThe NGAS has pulled back the 0.618 retracement of the previous decline and the market will be likely to continue the down trend.
Meanwhile a pinbar appeared after the market hit the 0.618.
So it is good to sell short at 3.06-3.08 levels.
SL:above 3.20
Target:2.66 and further more

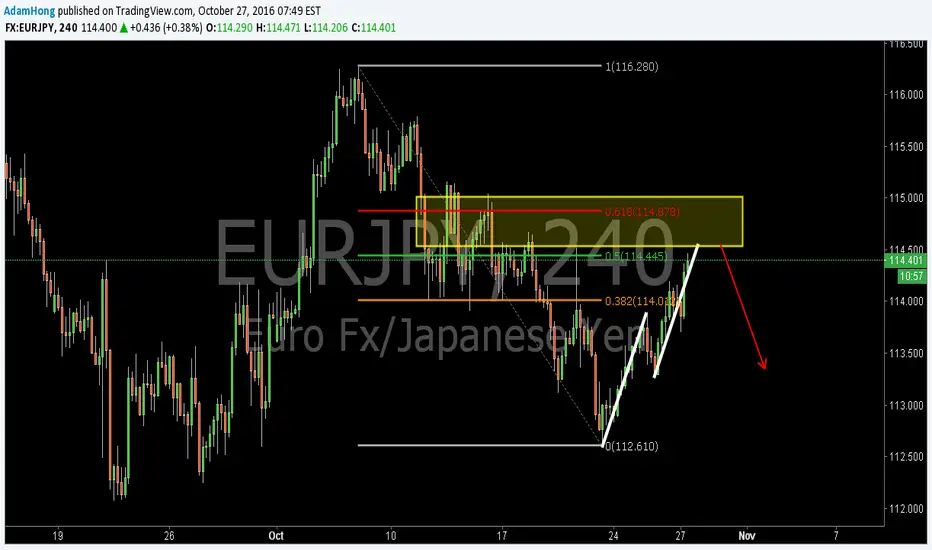
EURJPY:Potential AB=CD Pattern and the 0.618 RetracementA potential bearish AB=CD pattern will complete at about 114.5 levels and the 0.618 retracement of the previous decline is at 114.8 level.
Meanwhile the previous structure is also located in this zone.
So it is good to sell short at 114.5-115.0 levels when bearish candles appear.
SL:above 115.2
TP1:113.8
TP2:113.3 and further more
BULLISH GARTLEY - AUDUSD - STRUCTURE TRADE ALSOBullish Gartley coming in at strong support, great long opportunity.
Trade with care.

GBPJPY SHORT BIAS?This is not a signal but expecting more downside on GJ despite the earlier bb% break's long favour. Current yen-strenght and on 3m projections a 1.618 confluence? Good R2R

GBPUSD / 1HR / 2-618 TradePAIR: GBP/USD
TTF: 1HR
TRADE: 2-618
NOTE: These are potential Trade opportunities based
on my own personal Analysis. Please respect my Trade
ideas with kindness. Thank you,
Star Prosper
Philip Stewart


Watch out Sellers, Buyers Might Slap The Sh*t Out of You Price has broken out of a w-x-y-z, so a consolidation on a lower timeframe for a buy is a good idea. With this trading idea in mind, be prepared to be slapped if you are a seller. It doesn't mean the buyers can't be slapped either, it's just that there is high probability of price moving in their direction.
If you taking this trade, please use a strategy you have tested. Thank you for your support.

USDCAD TREND CONTINUATION TRADE (TRADE WALK THROUGH)HELLO TRADERZ! SO THIS MORNING I IDENTIFIED A FEW KEY PRICE LEVELS THAT I POINTED OUT TO MY GROUP OF TRADERZ FOR A SHORT OPPORTUNITY. WE WERE LOOKING FOR A RETRACT BACK UP INTO PREVIOUS SUPPORT WHICH NOW SHOULD BE RESISTANCE. CONFLUENCE WITH THE 61.8 AND AN OVER BOUGHT CONDITION ON THE RSI. LET'S SEE IF WE HIT OUR FIRST TARGET AT AROUND 1.30300s.

7/6/16 - EUR/USD - SHORT " NFP / UNEMPLOYMENT "Predicting one more leg down to meet the bullish trend line depicted in the chart.
NFP and Unemployment event risk might instigate this move.


GBPCHF 61.8 TradeGetting good signal for long here..
Scenarios;
Head & Shoulders pattern on the 38.2% and then we go down to 88.6
61.8 bullish retracement for bullish continuation

QIWI in a .618 down channel, long to 14 then short watch the 618 retrace level, when it bounces back to there, price drags down.

EURUSD Bullish Cypher Daily Having a look at the Daily and Weekly Time frames a cypher is nearing completion.
If it completes point D should see us down in the oversold area of the RSI
318 target is 1.49 RR and the 618 target is 2.4 RR


