WTI Crude Oil – Bullish Recovery & Upside Continuation Setup📊 WTI Crude Oil – Bullish Recovery & Upside Continuation Setup
🔍 Market Overview
WTI Crude Oil is showing signs of a bullish recovery after finding strong buying interest near a key support zone. The recent decline appears to be losing momentum, while buyers are attempting to build a base for a po
About CFDs on WTI Crude Oil
Crude Oil is a naturally occurring liquid fossil fuel resulting from plants and animals buried underground and exposed to extreme heat and pressure. Crude oil is one of the most demanded commodities and prices have significantly increased in recent times. Two major benchmarks for pricing crude oil are the United States' WTI (West Texas Intermediate) and United Kingdom's Brent. The differences between WTI and Brent include not only price but oil type as well, with WTI producing crude oil with a different density and sulfur content. The demand for crude oil is dependent on global economic conditions as well as market speculation. Crude oil prices are commonly measured in USD. Although there have been discussions of replacing the USD with another trade currency for crude oil, no definitive actions have been taken.
USOIL Bullish Rebound from Support Zone
USOIL is holding above a key support zone after a recent pullback, showing signs of renewed buying interest. Price is attempting to recover within a consolidation range, and a sustained bounce from support could drive the market toward the **71.52** target. A break above the nearby resistance woul
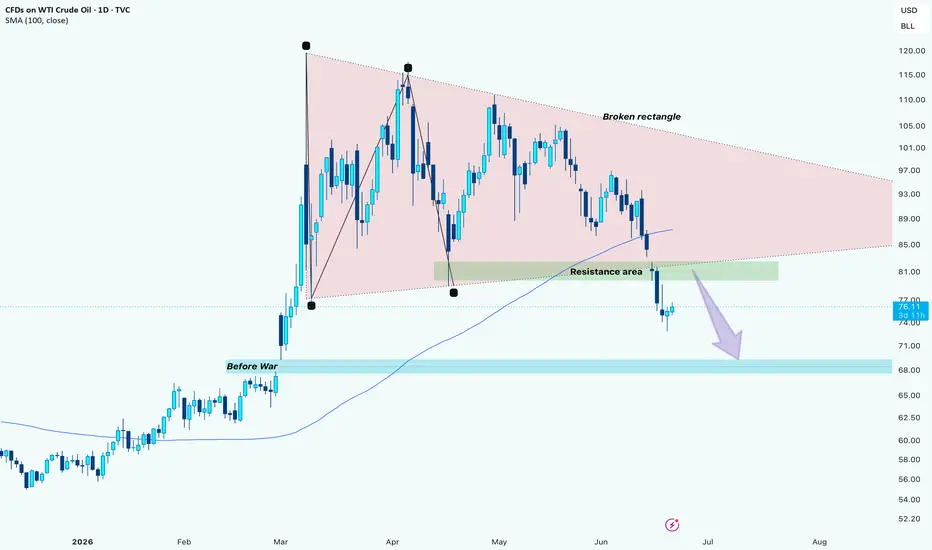
WTI Crude Oil: $81 Resistance level, towards $68Hi!
I’ve been tracking this setup on WTI Crude Oil, and the bearish breakdown is playing out exactly as anticipated.
Here’s my game plan for WTI Crude Oil right now. We broke out of that massive consolidation pattern and dropped below the green zone.
Current price is sitting around $75.83, but I’
OILUSD Bearish SMC Analysis | Sellers Eye 66.00OILUSD continues to trade within a bearish Smart Money Concepts (SMC) market structure, characterized by a series of lower highs (LH) and lower lows (LL). The overall trend remains bearish, indicating that sellers continue to control the higher-timeframe order flow.
The highlighted bearish order bl
WTI WEEKLY INSIGHT CRUDE OIL WTI OIL is a bullish from the technical on analysis weekly timeframe.
the Current Price is trading around $67–68.77. The chart highlights a recent price area near $67–68 as a key retest zone of a broken previous supply roof now a key demand.
My Thesis presents a buying opportunity in the $66.90–$68
USOIL Potential Sell at 70 as Strong Dollar Pressures Crude!In today's trading session, we are monitoring USOIL for a potential selling opportunity around the 70.00 zone. USOIL is trading in a broader downtrend and is currently in a correction phase, with price approaching the 70.00 support and resistance area, a key resistance zone that could provide an att
USOIL 30Min Engaged ( Bullish Reversal Detected )HANZO MARKET LIQUIDITY REPORT
USOIL
Timeframe: 30min (Volume Basis)
Scale: Higher Timeframe Context / Deep Volume analysis
━━━━━━━━━━━━━━━━━━━━━━
Market Observation
This analysis is focusing on structural behavior, liquidity zones, Volume analysis
and key areas of interest within the current range.
Hellena | OIL (4H): SHORT to the 60-62 support area.If we look at the OIL chart in a broader way, last time we assumed that wave "3" had already been completed. But now the market suggests that this assumption was probably premature. The bearish move seems to be still developing, which means the price may reach deeper levels.
At the moment, I see tw
USOIL 30Min Engaged ( Bearish Reversal Detected )HANZO MARKET LIQUIDITY REPORT
USOIL
Timeframe: 30min (Volume Basis)
Scale: Higher Timeframe Context / Deep Volume analysis
━━━━━━━━━━━━━━━━━━━━━━
Market Observation
This analysis is focusing on structural behavior, liquidity zones, Volume analysis
and key areas of interest within the current range.
WTI OIL 4-month Channel Down nearing its bottom.WTI Oil (USOIL) has been trading within a Channel Down that is close to its Lower Lows bottom trend-line. Having broken already below its 1D MA200 (orange trend-line), we see a 4 day sideways streak, potentially a consolidation before the short-term bottom.
Given that the 1D RSI is also oversold, e
See all ideas
Displays a symbol's price movements over previous years to identify recurring trends.