Eurusd H4Hi guys Hope you well, and start great week
Chart for eurusd we have great trendline and nice liquidity under the trend ,
SecondChanceCrypto
⏰24/April/23
⛔️(DYOR)
Brent

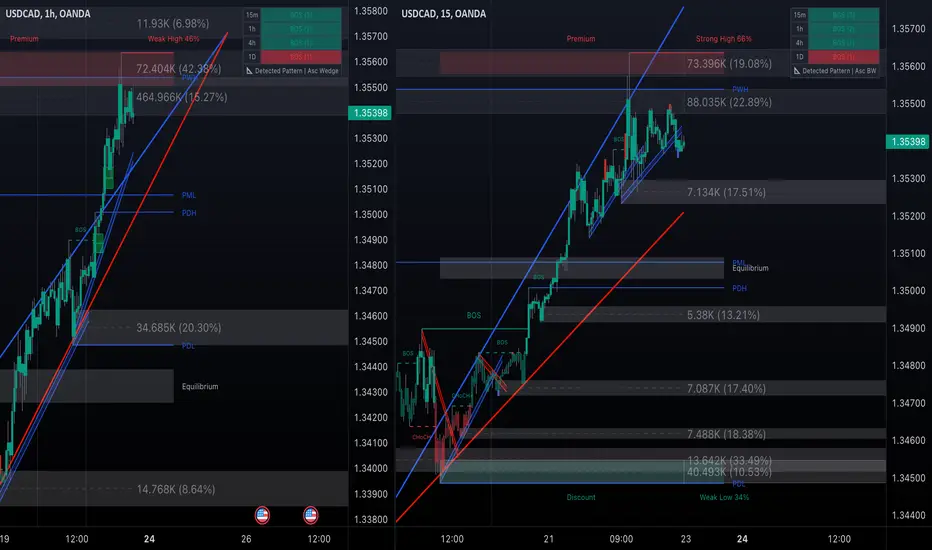
USD/CAD - On the READYOANDA:USDCAD
1H price action hitting resistance order blocks above, and top range (premium) of the most recent swing structure.
Price unable to break above, and looking for possible short scalps on the 15m when structure breaks to the downside.
CRUDE OIL (WTI) Will The Gap Be Filled Next Week? 🛢
Crude Oil is filling the gap.
The market finally dropped this week and the price managed to fill the first half of the gap.
I believe that the market may drop lower.
I will anticipate a bearish continuation to gap close level.
❤️Please, support my work with like, thank you!❤️

CRUDE OIL (WTI) Time to Fill The GAP?! 🛢
Important update for WTI Oil.
Recent bearish movement explained.
Trading plan & trading recommendations.
❤️Please, support this video with like and comment!❤️

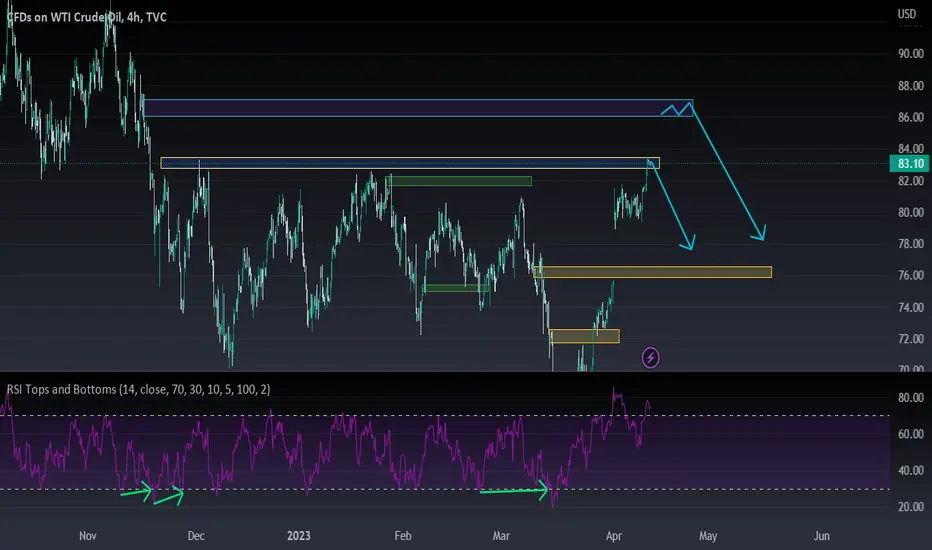
⚡️UPDATE: OIL PRICE, 21 March 2023My last update was over 1.5 months ago.
I was looking for a continuation of the downtrend in the price of Oil down to the mid-60s area. I expected this to happen soon or after a period of side-ways movement.
Subsequently, Oil proceeded to trade sideways and in recent days has reached the support level as outlined in the chart.
We should expect strong support around this area. Extending back to 2019, this area has acted as both support and resistance on numerous occasions.
📉 A strong move below this area could see an acceleration in the pace of the downtrend with Mid-40s being the next stopping point. The narrative/rationale for such a move would be a collapse in inflation expectations/demand destruction due to the current banking crisis and flow on effects.
📈 A bounce higher is also possible. An outsized bounce would signal a change of behaviour that may result in a trend reversal. On the other hand, a minor bounce would not change the bearish trend and we should expect 📉 as outlined above.
Last time: 7th Feb 2023
No change of opinion. Looks to be headed lower. Currently moving in a choppy sideways pattern (horizontal green arrow) . There are currently no reversal signs such as a large bullish candle or significant bounce - the scale of which will need to surpass the Oct 2022 short-term rally.
In the short-term, prices can move higher to the upper range of the current side-ways movement or just simply fail to the downside. I don't forsee a long period of consolidation.
The medium-term price target is still the mid-$60s. That's the strongest immediate support zone.
DYOR, not investment advice.

What influences the price of OIL?In today’s volatile global market, the price of oil can be affected by a variety of factors. From wars and international trade agreements to financial market dynamics and global economic outlook, understanding what influences the price of oil is essential for both governments and individuals alike. In this post, we will look at how geopolitical factors, financial market dynamics, the global economy, oil producers’ strategies, and weather events all play a role in determining the cost of one of our most valuable resources. By examining each factor in turn, we can gain insight into why prices fluctuate so drastically over time and how to respond appropriately when they do. Read on to learn more about what influences the price of oil.
Geopolitical Factors:
Geopolitical factors have a major impact on oil prices, as the global demand for oil is heavily influenced by political events and decisions. The instability of certain regions and countries can reduce their production levels, leading to a rise in prices. International trade agreements can also affect oil prices: the recent US-China trade war has had a significant impact on oil markets, with supply chain disruptions causing uncertainty and increased volatility.
The presence or absence of certain governments in oil-producing nations can also influence prices dramatically. For example, the toppling of Muammar Gaddafi's regime in Libya caused a sharp spike in global crude prices due to its immediate effect on oil production levels. Similarly, political unrest in Iraq and other Middle Eastern countries have resulted in supply disruptions that have pushed up prices.
Lastly, global political events such as wars, coups, and other acts of aggression can disrupt the production of oil and drive up its price. For instance, when the US imposed sanctions on Iran following its nuclear program activities, it caused an immediate jump in crude prices due to fears about potential supply disruptions from Iran’s fields. In addition to these direct effects on production and supply levels, geopolitical events often lead to market speculation which further drives up prices even if there is no actual disruption to supplies.
Supply and Demand
The balance between global supply and demand for crude oil plays a key role in determining the price of oil. Changes in global supply can cause shifts in prices, such as when OPEC (Organization of the Petroleum Exporting Countries) countries agree to reduce production, or natural disasters affect output from offshore rigs or refineries. On the other hand, changes in global demand can also have an impact on oil prices. For example, economic booms can cause an increase in demand for fuel, while recessions tend to weaken it.
When demand is high and supply is low, then oil prices tend to be higher as customers are willing to pay more for limited resources. Conversely when supplies are plentiful and demand is low, then prices decrease as suppliers compete with each other by offering lower rates. The interplay between these two factors is what drives the price of oil.
It's important to note that both short-term and long-term forces influence the price of oil; geopolitical events may create temporary disruption but underlying trends are always at play too. For instance, if there's a sudden increase in production due to new technologies used by producers or a drop in consumption due to changing energy needs, then this could result in long-term changes to the price of crude oil.
In addition to this kind of market fundamentals affecting the cost of oil on a macro level, some countries may choose to manipulate their own domestic supplies which can have significant implications on regional markets as well as global ones. Some governments even use subsidies or taxes on petroleum products as part of their fiscal policy strategies – practices which can help cushion consumers against fluctuations in international markets but could also lead to imbalances over time if left unchecked.
Overall, understanding how supply and demand dynamics interact with one another helps explain why prices may go up or down depending on current events and market conditions – knowledge which provides valuable insight into how companies should approach pricing strategies for their goods and services around energy costs.
Economic Sanctions
Economic sanctions are a strategic tool wielded by governments to implement international law or force compliance. This approach can take the form of trade restrictions, investment prohibitions, financial transaction limitations, travel bans and technological access constraints.
The application of economic sanctions can have a major effect on global oil prices - as evidenced in 2018 when US-imposed sanctions caused Iranian exports to plunge, with an ensuing surge in oil prices across the world. Similarly, US-driven sanctions against Venezuela had a similar effect on pricing the following year.
It is not only reductions in production that influence price movement; sentiment can also play a role. Sanctions against Iran saw market sentiment affected, resulting in increased volatility and more expensive oil for consumers. If an embargo were imposed on a major producer such as Saudi Arabia or Russia there could be widespread disruption to supplies and increased pricing for everyone involved.
Even if production isn't hit directly by particular sanctions then long term trends may still be affected: An embargo on Saudi Arabia would likely lead to reduced crude inventories over time as production levels adjust accordingly causing higher prices across the board down the line. This could stimulate demand for renewable energy sources like solar or wind power which would decrease global demand for fossil fuels while bringing down crude costs overall.
Overall it is clear that economic sanctions can have both short term and long lasting effects on global oil prices - depending upon their scope, duration and severity. Therefore businesses tied up with energy trading or others parts of the industry should stay vigilant regarding these types of events so they are prepared for any disruptions that may arise from them ahead of time.
Political Unrest
Political turmoil can have a significant influence on the cost of oil, producing instability in the market and creating price volatility. Elections, uprisings, strikes or civil wars can cause disruptions to supply chains, resulting in higher costs for purchasers. Additionally, alterations to United States foreign policy and government regulations can also affect the oil industry. For instance, when the US exited the Iran nuclear deal in 2018 and placed sanctions on Iranian oil exports, international petroleum prices rose significantly.
Oil is traded globally so unrest in one country may cause an impact on oil costs around the world. In 2019, demonstrations against fuel tax hikes precipitated a global crude oil increase due to worries about supply interruptions from Total SA's leading refinery in France. Similarly, Yemen’s civil war has caused upheaval across the globe - with Saudi Arabia stopping most of its crude shipments via the Red Sea due to safety issues connected to Houthi rebels.
Political turbulence could also lead to a decrease in investment into energy infrastructure projects such as pipelines or refineries - meaning that even if there is demand for petroleum products they might not reach customers because of logistics issues. This could result in shortages of certain goods and consequently greater fees for buyers.
Overall it is evident that political unrest has wide-reaching consequences for the price of oil both locally and internationally. It is crucial for businesses working within this sector to keep up with current events so that they are better prepared for any potential disturbance or cost variations that may occur as a result of political instability around the world.
Financial Market Dynamics:
Financial markets play an important role in influencing the price of oil. Large institutional investors, such as pension funds and hedge funds, often make decisions based on short-term trends in the energy sector. When these investors buy or sell futures contracts for oil, it can affect the supply and demand balance of crude oil and thus its price.
The futures market is another factor that affects the price of oil. Futures traders purchase contracts to buy or sell oil at a later date, which impacts crude supply and demand levels. Speculation on OPEC production cuts can also have an effect on oil prices, as can political unrest or economic sanctions against certain countries.
Weather and natural disasters are another important factor to consider when discussing financial market dynamics. In some cases, extreme weather conditions can lead to disruptions in production, supply chain issues, or increased demand due to cold snaps or heatwaves. Natural disasters such as hurricanes or floods can also cause major disruption to infrastructure and temporarily reduce supplies of certain commodities including crude oil.
Finally, global economic outlooks may influence both investor sentiment and consumer spending patterns which could lead to changes in demand levels for commodities like oil over time. As such it is important for businesses in the energy trading industry to stay up-to-date with global developments so they can make informed decisions when it comes to pricing strategies related to energy costs.
Hedge Funds and Speculators
Hedge funds and speculators are influential participants in the energy market. They are responsible for buying and selling oil contracts as well as futures to take advantage of price fluctuations. By doing so, they can make profits from their trades but also assume risk if markets turn against them. Moreover, their activities may be affected by external developments such as geopolitical events or economic sanctions imposed by governments. Therefore, it is important for investors to keep a close eye on these factors in order to make informed decisions about pricing strategies for oil-related goods and services.
Futures Markets
Futures markets are an important factor in influencing the price of oil, as they can provide a platform for buyers and sellers to make profits or protect against price fluctuations. A futures market is a type of financial market that enables participants to buy and sell commodities, such as oil, at predetermined prices for delivery on a future date.
In the energy sector, large institutional investors and hedge funds use futures markets to speculate on the direction of oil prices. By buying contracts today with an expectation that prices will rise in the future, these investors can increase their profits from rising oil prices. On the other hand, hedgers use futures markets to protect themselves from unexpected drops in price by locking in current prices for delivery at a later date.
Speculative activity in futures markets can lead to large swings in the price of oil because participants have greater influence on pricing than actual demand and supply. This means that speculation can cause oil prices to move independently of actual supply shortages or excesses. Regulatory bodies also use futures markets to set limits on trading and production levels, which impacts prices and volatility levels.
For businesses involved in energy trading it is important to keep track of developments in futures markets as these movements can have significant impacts on pricing strategies. Businesses should also be aware of speculation by large institutional investors who are looking to profit from changes in oil prices over time. Understanding how these activities are impacting market sentiment will help businesses make informed decisions about pricing strategies related to energy costs.
Global Economy:
The global economy is a major factor in the fluctuating price of oil. Investor confidence, currency values, GDP growth and trade disruptions all have an impact on pricing. Additionally, as alternative energy sources become more accessible and affordable they can contribute to a decrease in demand for traditional fossil fuels such as oil. Companies involved in energy trading must stay informed of these developments to ensure their goods and services related to energy costs remain competitively priced.
Currency Values
The value of a country’s currency can have a direct impact on the price of oil, with fluctuations in exchange rates influencing import costs and buying power. A stronger currency will enable an importing nation to buy more oil for less money, whereas a weaker currency will require more of the local currency to purchase the same amount of oil from other countries.
Currency devaluation can also affect the cost of imported goods, as it reduces the buying power of a nation’s citizens and businesses. This means that each dollar or euro is worth less on the global market and makes it more expensive to purchase foreign-made goods, including oil. If countries devalue their currencies, they may have to pay higher prices for imports, which could cause oil prices to rise as well.
On the other hand, when a country’s currency appreciates in value, it can help reduce import costs and increase buying power. This makes imported goods cheaper for consumers and businesses alike, which could lead to lower prices for oil in those countries. In addition, appreciation of a nation’s currency can make its exports more attractive to foreign buyers who can now obtain them at relatively lower prices than before. This could help drive up demand for domestically produced crude oil and result in increased revenues for exporting nations.
When considering how currency values can influence the price of oil, it is important to remember that these effects are often short-term in nature and only apply when purchasing from abroad. Furthermore, changes in exchange rates are not necessarily an indication that domestic production costs have changed significantly - rather they reflect shifts in market sentiment towards one particular currency compared with all others around the world. Therefore companies should remain aware of current exchange rate trends while also monitoring their own costs over time so they are able to adjust pricing strategies accordingly depending on changing market conditions
Oil is now the biggest staple on the world stage. Its importance is difficult to overestimate. The entire economy is based on indicators related to oil. But time passes and the economy changes its face and new favorites enter the arena.
Traders, if you liked this idea or if you have your own opinion about it, write in the comments. I will be glad 👩💻

sell idea Oil has already reached one of its important ceilings, but we have a divergence in the 4-hour time frame that needs to be emptied, and also a gap that has not yet been filled, so I expect it to drop to 80 and 78.
WTI Crude - Step 1) $88 --> Step 2) $58.When it comes to oil, it was supposed to do the super moon back to $120 thing when Xi Jinping and his Chinese Communist Party finally stopped welding people in their homes and going full blown technocratic social credit while humans tried to "fight" Wuhan Pneumonia (COVID-19), but for one reason or another, the pump never got off the ground.
Probably because a whole lot more than the 87,468 people Xi and his CCP claim to have died from the disease are actually dead, and so demand is just legit in the toilet and industry can't get going, because China has big time problems stemming from its 23-year-long persecution of Falun Gong, which includes the unprecedented crime of live organ harvesting (they've done it to Uyghurs too), and the Party's outright fetish for human rights, freedom of speech, and freedom of belief abuses.
Being bullish on "China" is a totally separate thing from being bullish on "the Chinese Communist Party." One is extremely wise, while the other is totally moronic.
Totalitarian regimes never last a long time, and the Party has already had more than a century. Clinging to Marxism is like clinging to the Titanic when it's 5/6ths of the way under the water.
When it comes to WTI oil, both the fundamentals and the price action are strange. This is a commodity that you don't want to be very bearish on after it traded at literally $0 during 2020's western COVID pseudopandemic theatre hysterics. Yet, while oil also isn't liking to go down, it isn't liking to go up.
In October, I had a pretty accurate call that WTI would plink the $70 range.
WTI Crude Oil / CL1 - Accumulation Before Global Conflict
And a pretty good call in September too when everyone was convinced oil could never trade low again
WTI Crude / CL - An Intervention: Saving Blind Bulls
But the ultimate endgame of the calls, $50, has not manifested. It seems as if perhaps these prices won't manifest, and it's almost time for the uppy.
There's some problems with this narrative, however.
The key factor is that the United States and its vassal states (including Canada) are the world's largest producers of oil, by far. Russia and OPEC combined are really the only challengers, but the US has the advantage in that you need the USD to buy oil, and so ultimately the Biden Administration is the legit market maker.
The problem with the bull thesis is that the SPR was filled at $29.70 over the years while Biden and friends sold half of it off in the $80s and $90s. This inherently tells you not that they're trying to destroy themselves, but just that they're short on crude oil.
The news in December, right after oil wicked the $70 mark, was that the Biden Admin was buying it all back .
But then in January, the tune changed as the US Government said "The bids didn't come in low enough, so we haven't bought yet." Media says they want to buy around $70.
And this brings us to our very strange price action in WTI.
Crude has a gap at $85-86 and combines with a Dec. 1 pivot around $83, while recent trading activity was a triple top of successive lows at $82~.
Then we dumped to $72, but did not make a new low, and have since bounced back to $80.
All of this combines to give us no reason to believe that a hybrid short-killer/breakout trader-crusher play is not about to be made around the $88 level.
This gives us 10% to the upside, which is really quite nice to work with when WTI trades 1,000 barrel lots and you also have access to the leveraged ETFs like UCO and SCO.
But the bottom is not in. Look at the weekly candles.
Oil just hasn't retested the long-term trendline from late 2021, and in combination with the US Government having been unwilling to refill the SPR at $75+, should give you all the reason in the world to be extra cautious with going long as more than a scalp.
Under $60 **combining** with media chatter that Democrats are refilling the SPR is where you want to go long. And if you do it right, you'll get the bottom for what will quickly turn into $180.
2023 is going to be a wild year starting in July. If humanity makes it to 2024, it will be even more of a ride.
TL;DR: Long to $88 --> Short to $55, and start treating Bloomberg's Javier Blass like Jim Cramer. Trade against the narrative. Be patient. It's too early for the next moon, yet $120 in '22 was no top.
This should combine with natural gas being on the cusp of pumping:
Natural Gas? More Like Natural Go. 4-Handle Coming
Be careful, and trade safe.

BRENT BULLISH OUTLOOKThe price cap on oil imposed on Russia as far is proving unsuccessful, since China and India are bulk purchasing Russian oil, and Japan is opting out to lift the cap as well since it is dependent on oil from Russia.
Both MACD and RSI indicators are confirming the trend, with MACD histogram rising and RSI approaching 50 neutral line from below.
If this scenario continues, the price might test levels of 89 USD. As a pivot point might be considered levels of 77.5, and if the price passes that point, it might test levels of 72.5
Risk Disclosure: Trading Foreign Exchange (Forex) and Contracts of Difference (CFD's) carries a high level of risk. By registering and signing up, any client affirms their understanding of their own personal accountability for all transactions performed within their account and recognizes the risks associated with trading on such markets and on such sites. Furthermore, one understands that the company carries zero influence over transactions, markets, and trading signals, therefore, cannot be held liable nor guarantee any profits or losses.
Oil will continue rising to 300$-400$ zoneYou can see my old analysis for oil that linked in bottom and after that you can understand what i mean and how the wave move with my analysis
Good luck all.

UKOIL W1 AnalysisHey Traders.
TrendLine + Static Level increase probability of retracement.
We had a look at Brent Crude 3M chart before.

usoil 8h chart buy low after pullback tp 85 usd/bbl🔸Today let's review the 8 hour chart for crude oil . Previous setup was invalidated due to
the unexpected OPEC production cuts. Right now technical outlook flipped to bullish.
🔸Price gapped higher almost 10% after the OPEC production cuts were announced.
Bulls hit the strong overhead resistance at 82 USD/bbl and right now I'm expecting
a short-term pullback and re-test of the key s/r bulls below market price.
🔸Recommended strategy for crude oil traders: expecting short-term pullback and
therefore the recommended strategy for bulls is to buy low after we re-test the key s/r
price levels at 72/73 usd bbl. stop below recent market lows and TP1 is 80 USD/bbl and
TP2 is 85 usd/bbl. This is a swing trade setup, so may take a while. good luck traders!
🎁Please hit the like button and
🎁Leave a comment to support our team!
RISK DISCLAIMER:
Trading Futures , Forex, CFDs and Stocks involves a risk of loss.
Please consider carefully if such trading is appropriate for you.
Past performance is not indicative of future results.
Always limit your leverage and use tight stop loss.

Xau/UsdHello traders! In my opinion, in short term is pair is buy.
Target:
Buy 2060.00
Be careful and wait for a confirmation!
Don`t forget to look at the economic calendar!
MAKE MONEY AND ENJOY LIFE 💰
THANK YOU!
GOOD LUCK!
🙏🏻🙏🏻🙏🏻

Crude Oil (WTI): Have You Seen That GAP? 🛢️
With a sudden OPEC decision to cut oil production rate,
the market opened with a huge gap up.
The price is currently testing a solid horizontal supply cluster.
What we know about gaps is the fact that in 80% of the time they tend to be filled.
I believe that sellers will push the price from the underlined resistance and initiate a bearish move.
Goals will be 78.57 - middle of the gap, 75.75 - gap open.
❤️Please, support my work with like, thank you!❤️

Just a Bounce?Clearly the support has held and a bounce is occurring due to news on oil production cuts over the weekend.
Now we just have to see if price action results in a CHANGE OF BEHAVIOUR to usher in a potential long-term price reversal. As it stands, the downtrend remains in tact.

OIL, USDCAD & InflationThe USDCAD pair is correcting; it could last months. This probable down move will push up oil prices, thus, raising inflation rates worldwide!


crude oil bears will target 60 usd/bbl in april 2023🔸Hello traders, today let's review the 4 hour chart for crude oil. Previously we were stuck in
trading range, locked between 73 usd and 81 usd, however recently the trading range broke
down and this exposed further downside below 70 usd / bbl.
🔸The active trading range is defined by 81 usd range highs and 73 usd range lows.
Bears pulled the price down recently due to US banking crisis woes.
It's still worth noting that this distribution fractal setup is continuation of the
prior downtrend, established in 2022.
🔸Recommended strategy for crude oil traders: bears should look for reversal trade
setup near mid range, which is 77.50 USD/bbl. Once we get a decent rejection, bears
should scale in on sell side, initially targeting 70 USD / bbl and subsequently a fresh
low at 60 USD/bbl. We can hit this level sometime in April/May 2023.
🎁Please hit the like button and
🎁Leave a comment to support our team!
RISK DISCLAIMER:
Trading Futures , Forex, CFDs and Stocks involves a risk of loss.
Please consider carefully if such trading is appropriate for you.
Past performance is not indicative of future results.
Always limit your leverage and use tight stop loss.

A potential buying opportunity in oilOil broke through another resistance level and now faces another resistance level at 73.00, which is also the meeting point of the upper trend line of the local ascending channel. Wait for it to rebound to retest the previously broken level at 71, where it will also meet the 38.20 Fibonacci level and a local upward trend line. If any signs of a reversal appear from there, it could be a buying opportunity up to 74.30.
-------------------------------------------------------------------------
Let me know your thoughts in the comments, and show your support by liking the idea.
Please follow if you're interested in more ideas like this.
Your support is greatly appreciated!

USOIL - KOGIf anyone took this you should be loving it. I'd say that's the potential region now for a RIP, if it get's there.
As always, trade safe.
KOG

Crude Oil (WTI): Massive Zone to Watch Next Week 🛢️
Crude Oil has recently broken a massive horizontal demand cluster.
70.0 - 74.0 is the zone that was a key structure support and that was respected multiple time in the recent past.
After a breakout, the underlined area turned into a supply zone.
Probabilities will be high that the next bearish wave will initiate from that.
Goal - 66.3
❤️Please, support my work with like, thank you!❤️

DXY (US DOLLAR INDEX)Hello traders! In my opinion, in long term this index is sell.
If the price breaks the level of 100.00, this brings a decrease to the level of 93.54. Also the alternative scenario is up at the 108.80 level and then at the 93.54 level.
Be careful and wait for a confirmation!
Don`t forget to look at the economic calendar!
MAKE MONEY AND ENJOY LIFE 💰
THANK YOU!
GOOD LUCK!
🙏🏻🙏🏻🙏🏻

Long term view on WTI CRUDE OILThe big recession will have impact for price of crude oil. Short from retest (73-74$) to ~40$.

OIL PRICE IS TOO LOW TO STAY AT THIS LEVEL FOR LONG#COMMODITIES #TRADESETUP
📡🔞 TRADE $BRENT
🔽 LONG (BUY) > 76.20$
❌ STOP > 75.10$ (1.18%)
✅ T1 > 93.32$ (RR 19.31)
✅ T2 > 119.5 (RR 48.41)
☠️CAUTION !!!!
2 IMPORTANT INFORMATION TO TAKE INTO CONSIDERATION:
> THIS IS A MT/LT TRADE. REGARDING THE SETUP. JAC IS DONE AND WE ARE WORKING ON THE EXIT. PIV D (76.47$) MIGHT BE THE KEY.
> IF WE REINTEGRATE THE FORK (BACK BELOW 75$). LAST CALL MIGHT BE THE LEFT LQ ZONE (73.30$)
> FUNDAMENTALS
OPEC+ likely to stick to its guns despite price slump, delegates say
www.reuters.com
Wo1and, PhD
