EURAUD - Overall Bearish Medium-Term!Hello TradingView Family / Fellow Traders. This is Richard, also known as theSignalyst.
📈EURAUD has been overall bearish trading within the falling wedge pattern marked in red.
Moreover, the green zone is a strong structure and resistance.
🏹 Thus, the highlighted red circle is a strong area to look for sell setups as it is the intersection of the upper red trendline and resistance.
📚 As per my trading style:
As #EURAUD retests the red circle zone, I will be looking for bearish reversal setups (like a double top pattern, trendline break , and so on...)
📚 Always follow your trading plan regarding entry, risk management, and trade management.
Good luck!
All Strategies Are Good; If Managed Properly!
~Rich
Disclosure: I am part of Trade Nation's Influencer program and receive a monthly fee for using their TradingView charts in my analysis.
CFD

GBPJPY - Crazy Bullish!Hello TradingView Family / Fellow Traders. This is Richard, also known as theSignalyst.
📈GBPJPY has been overall bullish trading within the rising channel marked in blue.
Moreover, it is retesting a strong demand zone marked in green.
🏹 Thus, the highlighted blue circle is a strong area to look for buy setups as it is the intersection of demand and lower blue trendline acting as a non-horizontal support.
📚 As per my trading style:
As #GBPJPY approaches the blue circle zone, I will be looking for bullish reversal setups (like a double bottom pattern, trendline break , and so on...)
📚 Always follow your trading plan regarding entry, risk management, and trade management.
Good luck!
All Strategies Are Good; If Managed Properly!
~Rich
Disclosure: I am part of Trade Nation's Influencer program and receive a monthly fee for using their TradingView charts in my analysis.

EURNZD - The Bull of the Week!Hello TradingView Family / Fellow Traders. This is Richard, also known as theSignalyst.
📈EURNZD has been overall bearish trading within the falling channel marked in red.
However, it is retesting the lower bound of the channel acting as an over-sold area.
Moreover, the blue zone is a strong demand!
🏹 Thus, the highlighted blue circle is a strong area to look for buy setups as it is the intersection of demand and lower red trendline acting as a non-horizontal support.
📚 As per my trading style:
As #EURNZD approaches the blue circle zone, I will be looking for bullish reversal setups (like a double bottom pattern, trendline break , and so on...)
📚 Always follow your trading plan regarding entry, risk management, and trade management.
Good luck!
All Strategies Are Good; If Managed Properly!
~Rich
Disclosure: I am part of Trade Nation's Influencer program and receive a monthly fee for using their TradingView charts in my analysis.

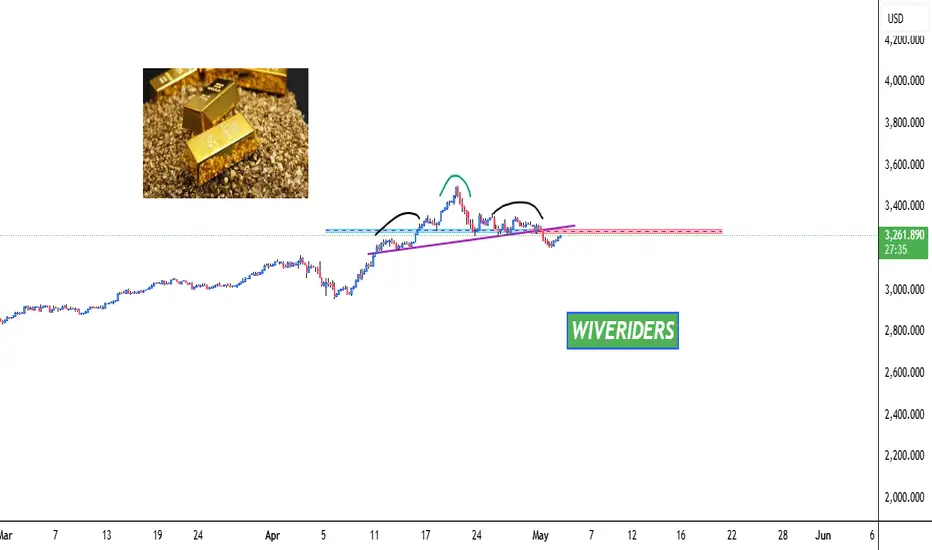
GOLD Formed Bearish Head and Shoulders Pattern🚨 TVC:GOLD Formed Bearish Head and Shoulders Pattern 🚨
TVC:GOLD has formed a bearish head and shoulders pattern and appears to be making a pullback to the neckline before a potential drop. However, if the price breaks out above the right shoulder, the bearish pattern could be invalidated.
📈 Technical Overview:
Pattern: Bearish Head and Shoulders
Neckline: Current pullback area.
Bearish Confirmation: A drop below the neckline could confirm the bearish move.
Invalidation: If the price breaks out above the right shoulder, the bearish pattern may be invalidated.
Gold (XAU/USD) Intraday Trade Idea NOWGold (XAU/USD) Intraday Trade Idea
Entry: $2,698
Stop Loss: $2,693
Target: $2,705
This setup provides a risk-reward ratio of 1:1.6, making it a favorable short-term trade opportunity. The entry is based on a key support level, with the target aligning with the next resistance zone.
It’s essential to monitor price action closely at the target level for signs of reversal or continuation.
👉 Follow me for more trading setups and updates:

GOLD - Trio Retest!Hello TradingView Family / Fellow Traders. This is Richard, also known as theSignalyst.
📈After rejecting the $3,500 round number and upper bound of the wedge, XAUUSD has been in a correction phase trading within the falling red channel.
📚 As Gold approaches the $3,100 - $3,150 support zone, I will be looking for buy setups on lower timeframes as it is the intersection of three rejections:
1- The lower bound of the falling red channel
2- The lower bound of the rising orange wedge
3- $3,100 - $3,150 support zone
📚 Always follow your trading plan regarding entry, risk management, and trade management.
Good luck!
All Strategies Are Good; If Managed Properly!
~Rich
Disclosure: I am part of Trade Nation's Influencer program and receive a monthly fee for using their TradingView charts in my analysis.

Symmetrical Triangle Nearing Resolution: Breakout or Breakdown?BTC/USD H4 Analysis – Symmetrical Triangle Nearing Resolution: Breakout or Breakdown?
📊 Technical Outlook – 4H Timeframe
Bitcoin is currently consolidating within a clear symmetrical triangle, with price tightening ahead of a potential major breakout. The chart shows price testing the upper boundary of the triangle, supported by MA13 and MA34 from below.
Key resistance zones: 86,594 and the extended target zone at 88,753. A successful breakout above this region could trigger a strong rally toward 90,000+.
Key support levels: 81,397 – 78,725 – 75,102, acting as critical retracement zones in case of downside rejection.
The structure suggests two primary scenarios:
Bullish breakout to 86,594 → 88,753, followed by a pullback and continuation higher.
False breakout or breakdown, leading to a sell-off toward 78,725 and possibly down to 75,102 if market sentiment deteriorates.
🌍 Macro Context & Market Sentiment
Investor sentiment remains fragile, impacted by ongoing geopolitical risks and the Fed’s cautious stance on monetary policy.
Altcoins are underperforming, signaling that capital rotation remains limited – often a precursor to short-term correction or distribution in BTC.
Volume is fading as price coils inside the triangle, typically a precursor to a sharp move in either direction.
🧠 Trading Strategy Ideas
Watch closely for price action near 86,594 – 88,753. If rejection or wick rejections occur, short-term pullback trades may be viable.
A breakdown below the triangle support (~84,000 area) could open up downside targets at 81,397 and 78,725.
A clean breakout with volume confirmation? Look for retest buys around 86k with continuation potential.
⚠️ Caution Advised
BTC is in a “calm-before-the-storm” zone. This is not the time to chase moves or overleverage. Let the market confirm direction and trade based on structure, not emotion.
💬 Are you leaning bullish or bearish on BTC’s next move? Will we see 90k or a drop back to 75k? Share your thoughts below! 👇👇👇

Gold (XAUUSD) — Technical and Fundamental Analysis 2HTechnical Outlook
On the 4H chart, gold is forming a rising structure and is currently trading near the 3236–3260 resistance zone, aligned with the 1.272 Fibonacci extension. This area is expected to act as a short-term cap, with a potential corrective move ahead.
🔹 Key Levels:
Resistance: 3236, 3260
Support: 3132–3140 (trendline), 3082 (horizontal zone)
🔹 Formations:
Potential retracement setup after an extended impulse
Expected correction toward 3132–3140 (rising trendline)
If support holds, price may resume the uptrend toward 3308 (1.414 Fibonacci extension)
🔹 Indicators:
RSI near overbought zone
MACD shows momentum weakening
EMA 50/200 continue to support the bullish trend
Fundamental Drivers
Inflation concerns and soft landing expectations support safe-haven flows
Market is pricing in potential Fed rate cuts in H2 2025
Central banks continue to accumulate gold reserves
Dollar weakness provides additional support for gold prices
Scenario
Base case:
Rejection at 3236–3260 → pullback to 3132–3140 → continuation toward 3308
Alternative:
Break above 3260 → direct move to 3308.
Break below 3132 → possible slide toward 3082.

Connecting Your Tickmill Account to TradingView: A Step-by-Step In this step-by-step guide, we’ll show you exactly how to connect your Tickmill account to TradingView in just a few seconds.
✅ Easy walkthrough
✅ Real-time trading from charts
✅ Tips for a smooth connection
Don’t forget to like, comment, and subscribe for more trading tutorials!
All Strategies Are Good; If Managed Properly!
~Richard Nasr

Gold (XAUUSD) – Technical Analysis for April 7, 2025 (1H)After a sharp drop, price reached the key demand zone around 3025-3030. This area forms a potential buy zone from which a rebound toward 3080–3100 may occur. The chart suggests a possible W-shaped recovery. A breakout above 3100 could unlock further upside toward 3127 and then resistance at 3167.
However, a breakdown below 3015–3020 could increase bearish pressure and lead to a decline toward 2997 support. Indicators are showing signs of local oversold conditions, hinting at potential technical recovery.
Main scenario – reversal from 3025-3030 with a move toward 3080–3100.
Alternative – breakdown to 2997.

GBPAUD - Already Over-Bought!Hello TradingView Family / Fellow Traders. This is Richard, also known as theSignalyst.
📈GBPAUD has been bullish trading within the rising channels in orange and red.
Currently, GBPAUD is retesting the upper bound of the channels.
Moreover, the $2.085 - $2.1 is a strong resistance zone.
🏹 Thus, the highlighted red circle is a strong area to look for sell setups as it is the intersection of the upper trendlines and green resistance zone.
📚 As per my trading style:
As #GBPAUD approaches the red circle zone, I will be looking for bearish reversal setups (like a double top pattern, trendline break , and so on...)
📚 Always follow your trading plan regarding entry, risk management, and trade management.
Good luck!
All Strategies Are Good; If Managed Properly!
~Rich
Disclosure: I am part of Trade Nation's Influencer program and receive a monthly fee for using their TradingView charts in my analysis.

Gold Outlook – Steady Range Before Key Data Hits🟡 Market Context:
Gold has been trading in a steady range since the start of the week, with no significant breakout or momentum shift observed.
Today’s session is expected to remain quiet, as there are no major economic events scheduled.
All eyes are on the Thursday GDP release and Friday’s PCE inflation data from the US — both of which are likely to determine the direction for gold into the end of the month and quarter.
📆 Key Data to Watch:
Thursday: US Quarterly GDP
Friday: US PCE Price Index (Federal Reserve’s preferred inflation gauge)
These events are considered high-impact catalysts that may trigger sharp moves in gold, especially if surprises occur.
🔍 Technical Structure:
Price continues to respect key support and resistance zones identified earlier this week.
There is no confirmed breakout yet, so the strategy remains range-based:
➡️ Trade the levels. Watch for reaction signals at extremes.
➡️ Wait for clearer momentum following the macro releases.
🧭 Key Price Levels:
🔺 Resistance: 3,010 – 3,036 – 3,046 – 3,057
🔻 Support: 3,010 – 3,001 – 2,988
🎯 Trade Plan – 26/03
BUY ZONE: 2988 – 2986
SL: 2982
TP: 2992 – 2996 – 3000 – 3004 – 3008 – 3015
SELL ZONE: 3045 – 3047
SL: 3051
TP: 3042 – 3038 – 3034 – 3030 – 3026 – 3020
🧠 Final Notes:
The market remains in accumulation mode ahead of key US data.
No need to rush — protect your capital, wait for clean setups, and let the market reveal its hand.
— AD | Money Market Flow

GOLD - Eyeing Two Levels!Hello TradingView Family / Fellow Traders. This is Richard, also known as theSignalyst.
📈 XAUUSD remains overall bullish in both the short and medium term, trading within the rising channels marked in orange and green.
🔍 Here are two key levels I'm watching for potential trend-following long setups:
1️⃣$3,000 – A psychological round number that aligns with the lower orange trendline.
2️⃣$2,950 – A support level that intersects with the lower blue trendline.
Let’s see if the bulls hold the line! 🐂✨
📚 Always follow your trading plan regarding entry, risk management, and trade management.
Good luck!
All Strategies Are Good; If Managed Properly!
~Rich
Disclosure: I am part of Trade Nation's Influencer program and receive a monthly fee for using their TradingView charts in my analysis.

Silver – Lagging but Still Strong!Hello TradingView Family / Fellow Traders. This is Richard, also known as theSignalyst.
📈 SILVER has been bullish, trading within the rising wedge pattern marked in red.
Following the latest aggressive bullish movement, XAGUSD has formed a demand zone, marked in blue.
🏹 Thus, the highlighted blue circle is a strong area to look for buy setups, as it represents the intersection of demand, support, and the lower red trendline, which acts as a non-horizontal support.
📚 As per my trading style:
As #XAGUSD approaches the blue circle, I will be looking for bullish reversal setups, such as a double bottom pattern, a trendline break, and so on.
Additionally, for the bulls to maintain long-term control, a break above $3,500 is needed.
📚 Always follow your trading plan regarding entry, risk management, and trade management.
Good luck!
All Strategies Are Good; If Managed Properly!
~Rich
Disclosure: I am part of Trade Nation's Influencer program and receive a monthly fee for using their TradingView charts in my analysis.

Head & Shoulders Pattern Forming? 📊 GOLD (XAU/USD) 1H Timeframe Analysis – Head & Shoulders Pattern Forming? 🚀
📉 Gold is forming a possible Head & Shoulders pattern on the 1-hour chart.
🔄 Key Levels & Scenarios:
✅ Bearish Scenario: If the price breaks below the blue support zone, the next targets will be at the green line levels.
✅ Invalidation: If the price moves above the right shoulder, the bearish structure is invalidated, and we could see a bullish continuation.
📌 Watch for a confirmed breakout before taking a position!

US30; Heikin Ashi Trade IdeaPEPPERSTONE:US30
In this video, I’ll be sharing my analysis of US30, using my unique Heikin Ashi strategy. I’ll walk you through the reasoning behind my trade setup and highlight key areas where I’m anticipating potential opportunities.
I’m always happy to receive any feedback.
Like, share and comment! ❤️
Thank you for watching my videos! 🙏

GOLD - $3,000 is a Magnet!Hello TradingView Family / Fellow Traders. This is Richard, also known as theSignalyst.
📈 After recording a new all-time high this week, GOLD has been surging in a parabolic manner.
🎯 Next target? The $3,000 round number is lining up perfectly with the upper bound of the rising channel marked in red.
🏹Meanwhile , every bearish correction would be an opportunity to look for trend-following longs, targeting the $3,000 mark.
📚 Always follow your trading plan regarding entry, risk management, and trade management.
Good luck!
All Strategies Are Good; If Managed Properly!
~Rich
Disclosure: I am part of Trade Nation's Influencer program and receive a monthly fee for using their TradingView charts in my analysis.

HK50; Heikin Ashi Trade IdeaPEPPERSTONE:HK50
In this video, I’ll be sharing my analysis of HK50, using my unique Heikin Ashi strategy. I’ll walk you through the reasoning behind my trade setup and highlight key areas where I’m anticipating potential opportunities.
I’m always happy to receive any feedback.
Like, share and comment! ❤️
Thank you for watching my videos! 🙏

What Are Financial Derivatives and How to Trade Them?What Are Financial Derivatives and How to Trade Them?
Financial derivatives are powerful instruments used by traders to speculate on market movements or manage risk. From futures to CFDs, derivatives offer potential opportunities across global markets. This article examines “What is a derivative in finance?”, delving into the main types of derivatives, how they function, and key considerations for traders.
What Are Derivatives?
A financial derivative is a contract with its value tied to the performance of an underlying asset. These assets can include stocks, commodities, currencies, ETFs, or market indices. Instead of buying the asset itself, traders and investors use derivatives to speculate on price movements or manage financial risk.
Fundamentally, derivatives are contracts made between two parties. They allow one side to take advantage of changes in the asset's price, whether it rises or falls. For example, a futures contract locks in a price for buying or selling an asset on a specific date, while a contract for difference (CFD) helps traders speculate on the price of an asset without owning it.
The flexibility of derivatives is what makes them valuable. They can hedge against potential losses, potentially amplify returns through leverage, or provide access to otherwise difficult-to-trade markets. Derivatives are traded either on regulated exchanges or through over-the-counter (OTC) markets, each with distinct benefits and risks.
Leverage is a very common feature in derivative trading, enabling traders to control larger positions with less capital. However, it’s worth remembering that while this amplifies potential returns, it equally increases the risk of losses.
These instruments play a pivotal role in modern finance, offering tools to navigate market volatility or target specific investment goals. However, their complexity means they require careful understanding and strategic use to potentially avoid unintended risks.
Key Types of Financial Derivatives
There are various types of derivatives, each tailored to different trading strategies and financial needs. Understanding the main type of derivative can help traders navigate their unique features and applications. Below are the most common examples of derivatives:
Futures Contracts
Futures involve a contract to buy or sell an asset at a set price on a specific future date. These contracts are standardised and traded on exchanges, making them transparent and widely accessible. Futures are commonly used in commodities markets—like oil or wheat—but also extend to indices and currencies. Traders commonly utilise this type of derivative to potentially manage risks associated with price fluctuations or to speculate on potential market movements.
Forward Contracts
A forward contract is a financial agreement in which two parties commit to buying or selling an asset at a predetermined price on a specified future date. Unlike standardised futures contracts, forward contracts are customizable and traded privately, typically over-the-counter (OTC). These contracts are commonly used for hedging or speculating on price movements of assets such as commodities, currencies, or financial instruments.
Swaps
Swaps are customised contracts, typically traded over-the-counter (OTC). The most common types are interest rate swaps, where two parties agree to exchange streams of interest payments based on a specified notional amount over a set period, and currency swaps, which involve the exchange of principal and interest payments in different currencies. Swaps are primarily used by institutions to manage long-term exposure to interest rates or currency risks.
Contracts for Difference (CFDs)
CFDs allow traders to speculate on price changes of an underlying asset. They are flexible, covering a wide range of markets such as shares, commodities, and indices. CFDs are particularly attractive as they allow traders to speculate on rising and falling prices of an asset without owning it. Moreover, CFDs provide potential opportunities for short-term trading, which may be unavailable with other financial instruments.
Trading Derivatives: Mechanisms and Strategies
Trading derivatives revolves around two primary methods: exchange-traded and over-the-counter (OTC) markets. Each offers potential opportunities for traders, depending on their goals and risk tolerance.
Exchange-Traded Derivatives
These derivatives, like futures, are standardised and traded on regulated exchanges such as the Chicago Mercantile Exchange (CME). Standardisation ensures transparency, making it potentially easier for traders to open buy or sell positions. For example, a trader might use futures contracts to hedge against potential price movements in commodities or indices.
Over-the-Counter (OTC) Derivatives
OTC derivatives, including swaps and forwards and contracts for difference, are negotiated directly between two parties. These contracts are highly customisable but may carry more counterparty risk, as they aren't cleared through a central exchange. Institutions often use OTC derivatives for tailored solutions, such as managing interest rate fluctuations.
Strategies for Trading Derivatives
Traders typically employ derivatives for speculation or hedging. Speculation involves taking positions based on anticipated market movements, such as buying a CFD if prices are expected to rise. Hedging, on the other hand, can potentially mitigate losses in an existing portfolio by offsetting potential risks, like using currency swaps to protect against foreign exchange volatility.
Risk management plays a crucial role when trading derivatives. Understanding the underlying asset, monitoring market conditions, and using appropriate position sizes are vital to navigating their complexity.
CFD Trading
Contracts for Difference (CFDs) are among the most accessible derivative products for retail traders. They allow for speculation on price movements across a wide range of markets, including stocks, commodities, currencies, and indices, without owning the underlying asset. This flexibility makes CFDs an appealing option for individuals looking to diversify their strategies and explore global markets.
How CFDs Work
CFDs represent an agreement between the trader and the broker to exchange the difference in an asset's price between the opening and closing of a trade. If the price moves in the trader’s favour, the broker pays the difference; if it moves against them, the trader covers the loss. This structure is straightforward, allowing retail traders to trade in both rising and falling markets.
Why Retail Traders Use CFDs
Retail traders often gravitate towards CFDs due to their accessibility and unique features. CFDs allow leverage trading. By depositing a smaller margin, traders can gain exposure to much larger positions, potentially amplifying returns. However, you should remember that this comes with heightened risk, as losses are also magnified.
Markets and Opportunities
CFDs offer exposure to an extensive range of markets, including stocks, forex pairs, commodities, and popular indices like the S&P 500. Retail traders particularly appreciate the ability to trade these markets with minimal upfront capital, as well as the availability of 24/5 trading for many instruments. CFDs also enable traders to access international markets they might otherwise find difficult to trade, such as Asian or European indices.
Traders can explore a variety of CFDs with FXOpen.
Considerations for CFD Trading
While CFDs offer potential opportunities, traders must approach them cautiously. Leverage and high market volatility can lead to significant losses. Effective risk management in derivatives, meaning using stop-loss orders or limiting position sizes, can help traders potentially navigate these risks. Additionally, costs like spreads, commissions, and overnight fees can add up, so understanding the total cost structure is crucial.
Key Considerations When Trading Derivatives
Trading derivatives requires careful analysis and a clear understanding of the associated risks and potential opportunities.
Understanding the Underlying Asset
The value of a derivative depends entirely on its underlying asset, whether it’s a stock, commodity, currency, or index. Analysing the asset’s price behaviour, market trends, and potential volatility is crucial to identifying potential opportunities and risks.
Choosing the Right Derivative Product
Different derivatives serve different purposes. Futures might suit traders looking for exposure to commodities or indices, while CFDs provide accessible and potential opportunities for those seeking short-term price movements. Matching the derivative to your strategy is vital.
Managing Risk Effectively
Risk management plays a significant role in trading derivatives. Leverage can amplify both returns and losses, so traders often set clear limits on position sizes and overall exposure. Stop-loss orders and diversification are common ways to potentially reduce the impact of adverse market moves.
Understanding Costs
Trading derivatives involves costs like spreads, commissions, and potential overnight financing fees. These can eat into potential returns, especially for high-frequency or leveraged trades. A clear understanding of these expenses may help traders evaluate the effectiveness of their strategies.
Monitoring Market Conditions
Derivatives are sensitive to their underlying market changes, from geopolitical events to macroeconomic data. In stock derivatives, this might be company earning reports or sudden shifts in management. Staying informed helps traders adapt to shifting conditions and avoid being caught off guard by sudden price swings.
The Bottom Line
Financial derivatives are versatile tools for trading and hedging, offering potential opportunities to access global markets and diversify strategies. While their complexity demands a solid understanding, they can unlock significant potential for informed traders. Ready to explore derivatives trading? Open an FXOpen account today to trade CFDs on more than 700 assets with competitive costs, fast execution, and advanced trading tools. Good luck!
FAQ
What Is a Derivative?
The derivatives definition refers to a financial contract whose value is based on the performance of an underlying asset, such as stocks, commodities, currencies, or indices. Derivatives are financial instruments used to hedge risk, speculate on price movements, or access specific markets. Examples include futures, forwards, swaps, and contracts for difference (CFDs).
What Are the 4 Main Derivatives?
The primary categories of derivatives are futures, forwards, swaps, and contracts for difference (CFDs). Futures are commonly traded on exchanges, while forwards, swaps and CFDs are usually traded over-the-counter (OTC). Each serves different purposes, from risk management to speculative trading.
What Is the Derivatives Market?
The derivatives market is where financial derivatives are bought and sold. It includes regulated exchanges, like the Chicago Mercantile Exchange, and OTC markets where customised contracts are negotiated directly between parties. This market supports hedging, speculation, and risk transfer across global financial systems.
What Is the Difference Between Derivatives and Equities?
Equities signify ownership in a company, typically in the form of stock shares. Derivatives, on the other hand, are contracts that derive their value from the performance of an underlying asset, which can include equities. Unlike equities, derivatives do not confer ownership.
Is an ETF a Derivative?
No, an exchange-traded fund (ETF) is not a derivative. It is a fund that tracks a basket of assets, such as stocks or bonds, and trades like a stock. However, ETFs can use derivatives, such as futures, to achieve their investment objectives.
Is the S&P 500 a Derivative?
No, the S&P 500 is not a derivative. It is a stock market index that tracks the performance of 500 large companies listed in the US. Derivatives, like futures, can be created based on the S&P 500’s performance.
This article represents the opinion of the Companies operating under the FXOpen brand only. It is not to be construed as an offer, solicitation, or recommendation with respect to products and services provided by the Companies operating under the FXOpen brand, nor is it to be considered financial advice.

CRUDE is looking weak. Price connection is expected#CRUDE #Analysis
Description
---------------------------------------------------------------
+ Crude has formed a nice descending triangle pattern and price has broken down the support line which formed over the years.
+ A clear breakdown from this support would push down the prices further.
+ Next target is 50-40$ range.
---------------------------------------------------------------
Enhance, Trade, Grow
---------------------------------------------------------------
Feel free to share your thoughts and insights. Don't forget to like and follow us for more trading ideas and discussions.
Best Regards,
VectorAlgo

SILVER - Finally Following Gold!Hello TradingView Family / Fellow Traders. This is Richard, also known as theSignalyst.
📈SILVER has been in a correction phase and it is currently approaching the lower bound of the blue rising wedge pattern.
Moreover, the green zone is a strong structure and support zone.
🏹 Thus, the highlighted blue circle is a strong area to look for buy setups as it is the intersection of support and lower blue trendline acting as a non-horizontal support.
📚 As per my trading style:
As #XAGUSD approaches the blue circle, I will be looking for bullish reversal setups (like a double bottom pattern, trendline break , and so on...)
📚 Always follow your trading plan regarding entry, risk management, and trade management.
Good luck!
All Strategies Are Good; If Managed Properly!
~Rich
Disclosure: I am part of Trade Nation's Influencer program and receive a monthly fee for using their TradingView charts in my analysis.

Gold Buy (194pips)Dollar Index is losing value and institutions are increasing their longs. We could soon touch $3000, pay close attention to market structures for proper buy positions. This a only a trade idea, use demo account to place trades. Happy trading OANDA:XAUUSD CAPITALCOM:DXY ECONOMICS:USINTR

Trading CFDs on Stocks vs ETFs: Differences and AdvantagesTrading CFDs on Stocks vs ETFs: Differences and Advantages
Many traders wonder whether it’s worth trading ETFs vs stocks. The truth is that they both offer distinct advantages depending on your strategy. Whether you're drawn to the diversification of ETFs or the high volatility of individual stocks, understanding their differences is key. This article breaks down the difference between stocks and ETFs and the advantages of each.
What Are ETFs vs Stocks?
Although you are well aware of what stocks and ETFs are, let us give a quick overview. ETFs, or exchange-traded funds, are collections of assets like stocks, bonds, or commodities bundled into a single security. Instead of buying individual assets, traders gain exposure to an entire market segment or strategy by trading ETFs. For example, SPY tracks the S&P 500, providing access to 500 major companies in one trade. ETFs are traded on exchanges like stocks, with prices fluctuating throughout the day based on supply and demand.
Stocks, by contrast, signify direct ownership in a particular company. When trading stocks, you’re focusing on the performance of that single entity, whether it’s a household name like Tesla (TSLA) or an emerging small-cap company. In comparing stocks vs an ETF, stocks are often more volatile than ETFs, creating opportunities for traders to capture sharp price movements.
In this article, we will talk about CFDs on ETFs and stocks. Contracts for Difference (CFDs) allow traders to speculate on the rising and falling prices of an asset without owning it. To explore a world of stocks and ETFs, head over to FXOpen.
Key Differences Between ETFs and Stocks
Understanding the distinctions between an ETF vs stocks is essential for traders aiming to refine their strategies. While both are popular instruments, they behave differently in the market and suit different trading approaches. Let’s break it down.
1. Composition
The primary difference between an ETF and a stock is its makeup. ETFs are baskets of assets like stocks, bonds, or commodities, offering built-in diversification. For example, the Invesco QQQ ETF holds top Nasdaq-listed companies like Apple, Microsoft, and Tesla. Stocks, however, represent a single company. Trading a stock like Amazon (AMZN) means your potential returns depend solely on its performance, while ETFs spread risk across multiple assets.
2. Volatility
Stocks are generally more volatile. A single earnings miss or CEO resignation can send a stock’s price soaring or crashing. ETFs, because they pool multiple assets, experience smaller swings. For instance, SPY’s price tends to move more steadily than a volatile stock like Tesla, making ETFs potentially easier to analyse for certain trading strategies.
3. Liquidity and Trading Volume
Liquidity varies significantly. ETFs tracking major indices like SPY are considered liquid instruments, with high trading volumes. Stocks can be just as liquid, especially large-cap companies, but smaller or niche ETFs and stocks may suffer from lower liquidity and wider spreads or gaps in pricing.
4. Costs
Investing in stocks typically involves just the price of the shares and brokerage fees. ETFs often have expense ratios—annual fees taken from the fund’s value. While these are usually small (e.g., 0.09% for SPY), they’re an added cost traders need to consider.
However, with ETF CFDs, these fees are bypassed, leaving traders with only the broker’s spread and commission to consider. Stock CFDs work similarly, eliminating transaction costs tied to owning the underlying asset.
Advantages of Trading ETFs
Trading ETFs offers unique opportunities that appeal to a range of strategies. Their structure, diversity, and flexibility make them a valuable choice for traders. Here’s what sets them apart:
1. Diversification in a Single Trade
Trading ETFs gives exposure to a group of assets, reducing the risk of being impacted by a single asset's performance. For instance, SPY tracks the S&P 500, spreading risk across 500 companies. This makes ETFs a great way to trade entire sectors or indices without committing to individual assets.
2. Sector or Thematic Focus
ETFs allow traders to target industries, regions, or themes with precision. Whether it's technology through XLK, emerging markets via EEM, or even volatility with UVXY, ETFs open the door to strategies that align with traders’ interests and market views.
3. Lower Volatility
Because ETFs pool assets, they experience less extreme price movements than individual stocks. This steadier behaviour can make them suitable for traders looking to avoid the sharp volatility of single stocks while still taking advantage of price action.
4. Liquidity in Major Funds
Popular ETFs like QQQ and SPY are highly liquid, which may contribute to tighter spreads. Their volume also supports smooth execution for both large and small positions.
5. Accessibility Through CFDs
Many traders prefer ETFs via CFDs, which allow traders to open buy and sell positions without owning the underlying asset. CFDs often provide leverage, giving traders the potential to amplify returns while keeping costs tied to spreads and commissions instead of fund expense ratios (please remember about high risks related to leverage trading).
Advantages of Trading Stocks
Trading stocks offers a direct and focused way to engage with the market. In ETF trading vs stocks, stocks may provide unique opportunities for traders who are drawn to fast-paced action or want to specialise in specific companies or sectors. Here’s what makes trading stocks appealing:
1. High Volatility for Bigger Moves
Stocks often experience significant price swings, creating potential opportunities for traders to capitalise on sharp movements. For example, earnings reports, product launches, or market news can drive stocks like Tesla (TSLA) or Amazon (AMZN) to see dramatic intraday price changes.
2. Targeted Exposure
With stocks, traders can zero in on a single company, sector, or niche. If a trader believes Apple (AAPL) is set to gain due to new product developments, they can focus entirely on that potential without being diluted by other assets in a fund.
3. News Sensitivity
Stocks respond quickly and significantly to news events, providing frequent trading setups. Mergers, management changes, or regulatory updates often result in immediate price movements, making them popular among traders who thrive on analysing market catalysts.
4. Wide Range of Opportunities
The sheer variety of stocks—from large-cap giants to small-cap companies—offers endless opportunities for traders. Whether trading high-profile names like Nvidia (NVDA) or speculative small-caps, there’s something for every trading style and risk tolerance.
5. Leverage with CFDs
Stocks can also be traded via CFDs, allowing traders to take advantage of price movements with smaller initial capital. This opens the door to flexible position sizes and leverage, amplifying potential returns in active trading.
ETFs for Swing Trade and Day Trade
ETFs cater to both swing and day traders with their diverse offerings and high liquidity. Some popular swing trading ETFs and ETFs for day trading strategies include:
ETFs for Swing Trading
- SPY (S&P 500 ETF): Tracks the S&P 500, offering exposure to large-cap US companies with steady trends.
- IWO (Russell 2000 ETF): Focuses on small-cap stocks, which tend to be more volatile, providing swing traders with stronger price movements.
- XLK (Technology Select Sector SPDR): A tech-heavy ETF that moves in response to sector trends, popular for capturing medium-term shifts.
- XLE (Energy Select Sector SPDR): Tracks energy companies, useful for swing traders analysing oil and energy market fluctuations.
Day Trading ETFs:
- QQQ (Invesco Nasdaq-100 ETF): Offers high intraday liquidity and volatility, making it a favourite for fast trades in tech-heavy markets.
- UVXY (ProShares Ultra VIX Short-Term Futures ETF): A volatility ETF that reacts quickly to market fear, providing potential opportunities for rapid price changes.
- XLF (Financial Select Sector SPDR): Tracks financial stocks and has consistent volume for capturing short-term sector-driven moves.
Stocks for Swing Trading and Day Trading
Selecting the right stocks is crucial for effective trading. High liquidity and volatility are key factors that make certain stocks more suitable for swing and day trading. Here are some of the most popular options for both styles:
Stocks for Swing Trading
- Apple Inc. (AAPL): Known for its consistent performance and clear trends.
- Tesla Inc. (TSLA): Exhibits significant price movements, offering potential opportunities to capitalise on medium-term swings.
- NVIDIA Corporation (NVDA): A leader in the semiconductor industry with strong momentum, suitable for capturing sector trends.
- Amazon.com Inc. (AMZN): Provides steady price action, allowing traders to take advantage of consistent movements.
Stocks for Day Trading
- Advanced Micro Devices Inc. (AMD): High daily volume and volatility make it a favourite among day traders.
- Meta Platforms Inc. (META): Offers substantial intraday price swings, presenting potential trading opportunities.
- Microsoft Corporation (MSFT): Combines liquidity with moderate volatility, suitable for quick trades.
- Alphabet Inc. (GOOGL): Provides consistent intraday movements.
How to Choose Between an ETF vs Individual Stocks for Trading
Choosing between stocks and ETFs depends on your trading goals, strategy, and risk appetite. Each offers unique advantages, so understanding their characteristics can help you decide which suits your approach.
- Risk Tolerance: Stocks often come with higher volatility, making them attractive for traders comfortable with sharper price movements. ETFs offer diversification, which can reduce the impact of individual market shocks.
- Trading Strategy: For short-term trades, highly liquid ETFs like QQQ or volatile stocks like TSLA might be considerable. If you're swing trading, ETFs and large-cap stocks may provide steady trends.
- Market Focus: In individual stocks vs ETFs, ETFs give access to broad sectors or indices, popular among traders analysing macro trends. Stocks allow for focused plays on individual companies reacting to earnings or news.
- Time Commitment: Stocks typically require more monitoring due to their rapid price changes. ETFs, especially sector-specific ones, may demand less frequent attention depending on your strategy.
The Bottom Line
ETFs and stocks may offer unique opportunities, whether you're targeting diversification or sharp price movements. By understanding the differences between ETFs versus stocks and aligning them with your strategy, you can take advantage of different trading conditions. Ready to start trading? Open an FXOpen account today to access a wide range of ETF and stock CFDs with trading conditions designed for active traders.
FAQ
What Is an ETF vs a Stock?
ETFs (exchange-traded funds) are collections of assets, such as stocks or bonds, combined into a single tradable unit. They offer built-in diversification, as buying one ETF provides exposure to multiple assets. Stocks, in contrast, signify ownership in an individual company.
Should I Trade the S&P 500 or Individual Stocks?
Trading the S&P 500 (via ETFs like SPY or through index CFDs) provides exposure to the 500 largest US companies, reducing reliance on any single stock. Individual stocks offer higher volatility and opportunities for sharper price movements. Evaluate your strategy and risk tolerance to choose the suitable asset.
ETFs vs Individual Stocks: Which Is Better?
Neither ETFs nor individual stocks are inherently better—it depends on your goals. ETFs offer diversification and potentially lower volatility, making them suitable for broad market exposure. Stocks provide targeted opportunities from individual company performance.
Do ETFs Pay Dividends?
Yes, ETFs often pay dividends when their underlying holdings generate income. These are typically paid out periodically, similar to dividends from individual stocks. However, when trading CFDs, dividends are not paid in the traditional sense, as you do not own the underlying asset. However, adjustments are made to your account to reflect dividend payments.
Can I Sell ETFs Anytime?
ETFs trade on exchanges during market hours, making them highly liquid. Therefore, you can buy or sell ETFs on specific days and hours.
Trade on TradingView with FXOpen. Consider opening an account and access over 700 markets with tight spreads from 0.0 pips and low commissions from $1.50 per lot.
This article represents the opinion of the Companies operating under the FXOpen brand only. It is not to be construed as an offer, solicitation, or recommendation with respect to products and services provided by the Companies operating under the FXOpen brand, nor is it to be considered financial advice.

Gold - TRIO RETEST!Dear TradingView community and fellow traders,
I find the daily chart for Gold to be interesting as it appears to be forming one of my favorite patterns. What I call TRIO RETEST
Here is why the blue circle is a strong zone to keep an eye on:
1️⃣ => Overall Trend
Gold has been bullish long-term trading inside the rising broadening wedge in blue and now approaching the lower blue bound / trendline acting as a non-horizontal support.
2️⃣ => Round Number
The $2,500 marked in green is a strong round number.
3️⃣ => Oversold Zone
Gold is bearish short-term trading inside the falling channel in red and now approaching the lower red trendline which I consider an oversold zone.
As per my trading style:
As Gold approaches the blue circle zone, I will be looking for bullish reversal setups (like a double bottom pattern, trendline break, and so on...)
📚 Hope you find this post useful. It's important to always adhere to your trading plan, including entry points, risk management strategies, and trade management techniques.
All Strategies Are Good; If Managed Properly!
~Richard
Disclaimer: The information provided is for educational and informational purposes only and should not be considered as financial advice. It is important to do your own research and make informed decisions before entering any trades. Past performance is not indicative of future results. Always be aware of the potential for losses, and never risk more than you can afford to lose.
