#USDJPY SHORT Liquidity has been grabbed and new bullish manipulationhas been created, clear short in view
Chart Patterns

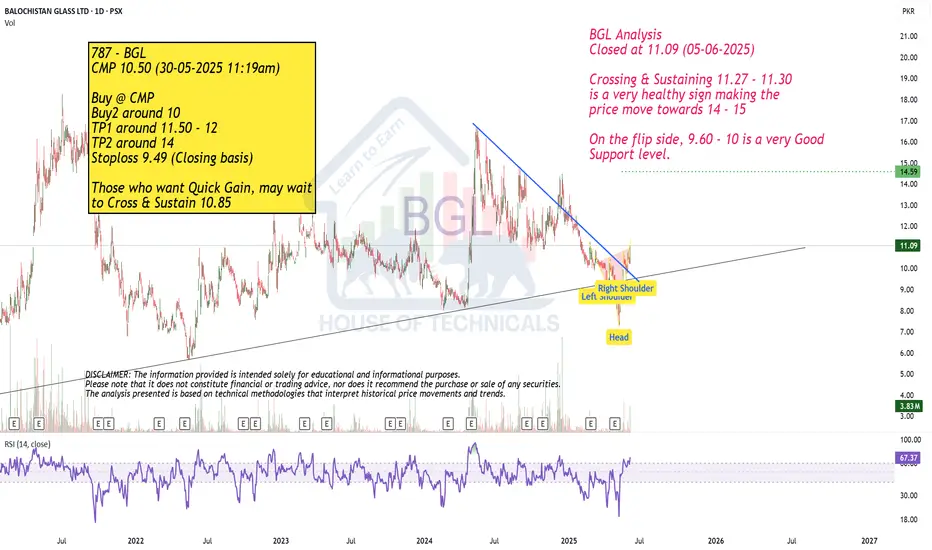
Breakout!
Closed at 11.09 (05-06-2025)
Crossing & Sustaining 11.27 - 11.30
is a very healthy sign making the
price move towards 14 - 15
On the flip side, 9.60 - 10 is a very Good
Support level.
Seems like it has printed HL.
Closed at 51.77 (05-06-2025)
Seems like it has printed HL around 50.50 - 51.50
However, if 50.20 is broken, it may test 48 again.
It has the potential to move up towards 55 , 58 &
then 60+
But should not break 44 even in extreme selling pressure.

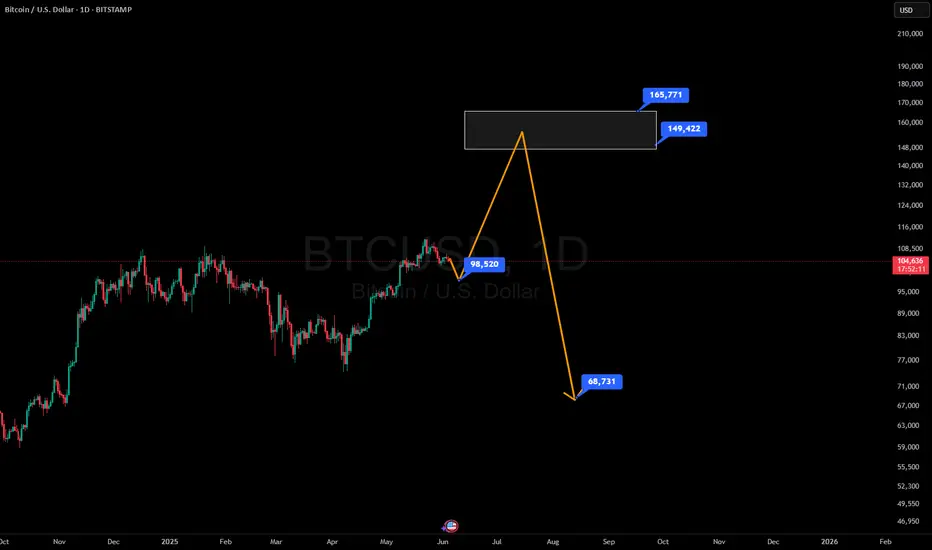
Market next move 🧨 Disruption Points:
1. Overbought Condition / RSI Divergence
Even though the price is surging (+3.30%), there could be an overbought condition forming.
If RSI or other momentum indicators (not shown here) diverge, it might signal weakness in bullish momentum.
> Disruptive idea: Price may fake the breakout (blue arrow) and then sharply reverse, trapping late buyers.
---
2. False Breakout Trap
The red-box area could be a liquidity zone where smart money might induce a fake breakout before dumping.
> Alternative path: Price breaks above temporarily (as in blue path), but then reverses violently back into the range, forming a “bull trap.”
---
3. Volume Anomaly
The volume appears to be decreasing on recent bullish candles after the initial spike.
This suggests that the uptrend may be losing strength, making the yellow arrow scenario less likely.
> Contrary outlook: Lack of volume confirmation could mean a sideways consolidation or reversal is more probable.

Is the Gold Pullback Building Momentum for the Nonfarm Payrolls?On Thursday, gold continued its strong upward trend, hitting a intraday high near $3,403, fully achieving the expected target. Although the European Central Bank's interest rate hike pushed the US Dollar Index higher, triggering a sharp pullback in gold prices during US trading hours, this correction is more regarded as a profit - taking behavior by bulls rather than a signal of trend reversal. Currently, the key support below remains at the $3,340 level. If the price stabilizes above this level, the overall bullish structure remains solid. Thursday's significant pullback is more like a cleaning action by major capital to address excessive short - term positions. The moving average system at the daily chart level still shows a bullish arrangement, with no obvious signs of turning bearish. Given that the Non - Farm Payrolls data will be released on Friday, it is expected that the market will maintain a volatile consolidation trend before that. On Friday, we need to focus on the guidance of the Non - Farm Payrolls data, and the real - time market strategy will be dynamically adjusted according to the data results.
Humans need to breathe, and perfect trading is like breathing—maintaining flexibility without needing to trade every market swing. The secret to profitable trading lies in implementing simple rules: repeating simple tasks consistently and enforcing them strictly over the long term.
Trading Strategy:
buy@3340-3350
TP:3370-3380

SILVER: The Market Is Looking Up! Long!
My dear friends,
Today we will analyse SILVER together☺️
The in-trend continuation seems likely as the current long-term trend appears to be strong, and price is holding above a key level of 35.467 So a bullish continuation seems plausible, targeting the next high. We should enter on confirmation, and place a stop-loss beyond the recent swing level.
❤️Sending you lots of Love and Hugs❤️

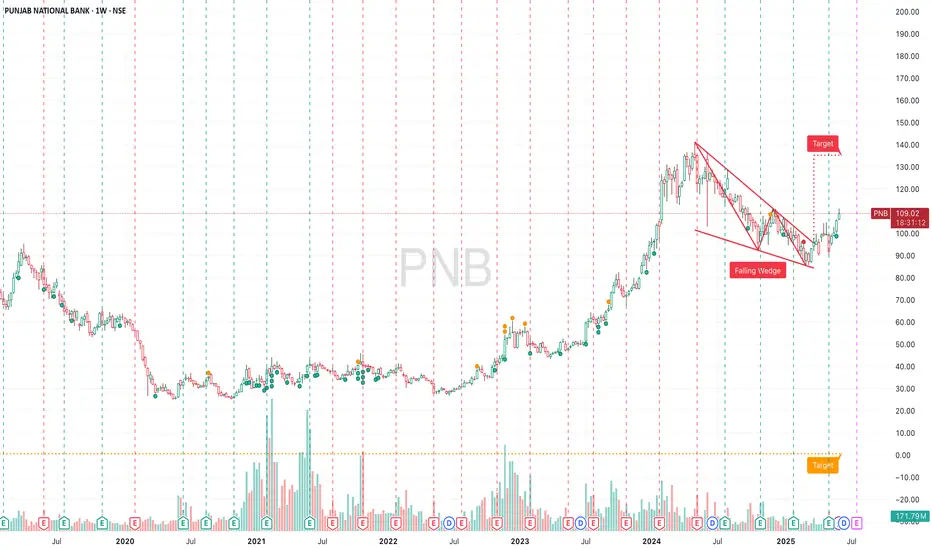
PNBSEBI-Disclosure for Stock Analysis
For Informational Purposes Only: The analysis provided above is for educational and informational purposes only and is based on the technical interpretation of the supplied stock chart. It should not be construed as financial advice, investment advice, or a recommendation to buy, sell, or hold any security.
Not a Financial Advisor: I am an AI assistant and not a registered or qualified financial advisor, investment advisor, or stockbroker. The information presented is generated without considering your individual financial situation, risk tolerance, or investment objectives.
Risk of Loss: Trading and investing in financial markets, including equities, carry a significant risk of loss. The value of stocks can fluctuate, and you may lose part or all of your investment. Past performance is not indicative of future results.
Consult a Professional: Before making any investment decisions, you should conduct your own thorough research and/or consult with a qualified financial professional to assess your personal circumstances and the suitability of any investment.
Information Accuracy: While this analysis is based on the data visible in the chart, it does not account for all possible market variables, including fundamental factors (like company earnings, debt, management) or macroeconomic events (like interest rate changes, government policies) that can impact the stock's price.
CHECK BTCUSD SIGNAL READ CAPTAINbtcusd) buy zone
(trade satup)
entry point (104.600) to (104.500) 📊
first target (105000)📊
2nd target (105.550) 📊
last target (106.000) 📊
stop loss (104.950)❌

Bullsih on gold after retracement.Price already have a clear break on XAUUSH on H4, so we expect a proper retracement to the nearest demand before considering entering longs.


Bitcoin trades sideways as Trump blames Powell again!
U.S. President Donald Trump has repeatedly criticized Federal Reserve Chairman Jerome Powell for not cutting interest rates over the past few months.
Last month, the Federal Reserve kept the target range for the federal funds rate between 4.25% and 4.5%, citing "inflation still somewhat elevated," as explained in its official statement. And now, with the central bank's June 17-18 meeting approaching, President Donald Trump has made his point without mincing words.
"ADP data is out!!! It's 'too late' Powell has to cut rates now," the president posted on Truth Social. "He can't believe it!!! Europe has already cut nine times!"
Indeed, in a press release released Wednesday morning by Roseland, New Jersey-based staffing firm ADP, the private sector created just 37,000 jobs in May, the slowest pace of hiring in more than two years. Bitcoin was largely flat following the news, fluctuating around the $105,000 threshold throughout the morning. But stocks were slightly higher, with the S&P 500, Nasdaq and Dow Jones up 0.23%, 0.35% and 0.10%, respectively, according to CNBC.
Bitcoin fell slightly by 0.70% over the past 24 hours, trading at $105,234.99 at the time of reporting. The cryptocurrency has lost 2.08% over the past week, with price action today mostly limited to between $104,232.70 and $106,457.19. The entire cryptocurrency market also fell by about the same percentage — 0.72%, according to Coinmarketcap.
Trading volume fell by 6.15% to $44.48 billion as momentum across sectors cooled. Bitcoin’s market cap fell by 0.82% to $2.09 trillion, with its dominance falling by 0.16% to 64.06. BTC futures open interest also fell 2.02% to $70.58 billion, indicating an exit from leveraged bets amid weak price action.
Liquidation activity was significantly lower than usual, with just $62,970 of positions liquidated in the past 24 hours, according to data from Coinglass. However, longs accounted for $56,780 of that total, again putting bulls on the wrong side of the latest market move. Short positions were liquidated for a smaller amount, at just $6,190.


KSE100 UPDATE ON 1D AND FUTURE TARGETSKSE100 gave much awaited Breakout above its ATH yesterday.
It has been trading in a range since Dec 2024.
This Trading Range gradually shaped up into Wyckoff Re-accumulation Phase.
After performing requisite Wyckoff Events like PS, AR, ST UT, SPRG, SOS, it broke out the range with supportive Volume Gradients and Price Action.
We had predicted three immediate target levels for the index, out of which two were achieved yesterday. The third one around 1,23,280 is shown on today's chart as TP1 on 1D.
Other targets calculated from various Measured Moves have also been marked on the chart.
TP1 -- 1,23,280
TP2 -- 1,32,360
TP3 -- 1,36,000
TP4 -- 1,38,670
Immediate Support -- 1,20,200
Secondary Support -- 1,15,100


Market next move 🔍 Disruptive Counter-Analysis
1. False Breakout Risk
The current breakout could be a bull trap. Price may break above the resistance level temporarily before reversing sharply.
Volume Analysis: The volume isn't significantly higher at the breakout candle, which may suggest a lack of strong momentum or institutional participation.
2. Resistance Zone Ahead
The 1.14500 to 1.15000 range is historically a supply zone, where sellers may aggressively enter the market.
This makes any upside move vulnerable to a reversal near that zone.
3. Macroeconomic Risk
A red-circled economic event icon appears on the chart (likely an ECB or Fed-related release). This adds uncertainty—news can invalidate technical patterns.
If the event is bearish for the euro (e.g., weak data or dovish ECB comments), the pair could reverse sharply.
4. Overbought Short-Term
A series of green candles without significant pullback suggests short-term overbought conditions.
RSI or other momentum indicators (not shown here) may confirm this. A correction to the previous base is possible.

PolkaDot (DOT) Structure Analysis (1D)BITGET:DOTUSDT is showing signs of strength after a deviation below the long-standing $3.70–$4.10 demand zone.
Key Levels
• 🟢 Demand Zone: $3.70–$4.10, respected since October 2023
• 🟡 Broken downtrend resistance, retested as support
• ⚪ Current falling channel (compression) following range high retest
• 🟥 Sell Order Block: $5.10–$5.40
• 🟧 Range Resistance: $5.40
• 🎯 Target on breakout: ~$7.00, potential extension to ~$7.50
Thesis
• The recent breakdown was quickly reclaimed, hinting at a possible spring/fakeout. After retesting the range high, price is now compressing within a descending channel, building energy just above demand.
• A breakout from the channel followed by an S/R flip of the $4.40–$4.60 region could trigger a rally toward the upper range.
Watching for
• Channel breakout with volume
• Clean break above $5.40 to confirm range expansion
Invalidation
• Sustained break below the $3.70–$4.10 demand zone

$ETH / USDT – 4H Time Frame Analysis 3,000 INCOMING?? CRYPTOCAP:ETH / USDT – 4H Time Frame Analysis
Structure: Bullish Flag | Outlook: Neutral-Bullish | Target: $3000?
🔹 Chart Overview
-Pattern: Bullish Flag (continuation structure)
Current Range:
- Supply Zone: $2,680.00 – $2,786.21
- Demand Zone: $2,319.79 – $2,417.61
Price Action:
- Tight consolidation between higher lows and lower highs, forming a symmetrical triangle within a flag structure.
Trend:
- Consolidation, but within a macro uptrend (prior strong rally).
Volume Profile:
- Anchored Volume shows high participation around $2,540–$2,600.
OBV:
- Flattening, signaling indecision and potential energy buildup.
Key Psychological Levels:
$2,860: Minor resistance from past S/R flips.
$3,000: Major round-number psychological resistance.
📐 Technical Confluences
Fibonacci Retracement:
- The 0.618 golden pocket aligns with the support trendline, reinforcing this as a critical zone.
Fair Value Gaps (FVG):
- Above Price: Acts as a magnet in bullish continuation.
- Below Price: Risk zone if price drops; aligns with liquidity and trendline support.
- Liquidity Zone: Aligned with 0.5–0.618 retracement; strong reaction expected.
📈 Bullish Scenari o
Breakout of Pennant Resistance:
- A clean break above $2,786 (supply zone & swing high) with volume.
Close above Upper FVG and Liquidity Zone:
- Confirms bullish intent. Targets psychological level at $2,860, then $3,000.
Volume Confirmation:
- OBV uptick and high breakout volume would validate the move.
Bullish Target Zones:
TP1: $2,860 (psych level + previous resistance)
TP2: $3,000 (major psychological level)
TP3: $3,120–$3,180 (1.618 Fib extension)
📉 Bearish Scenario
Rejection from Current Supply or Liquidity Zone:
- Fails to break above supply; rolls over from the upper pennant line.
Break Below Support Trendline:
- Break below golden pocket and $2,417.61 demand zone.
Invalidation of Bullish Flag:
- A breakdown below $2,319.79 (swing low) invalidates the bullish flag and may signal a trend reversal.
Bearish Target Zones:
TP1: $2,200 (local volume gap + structure support)
TP2: $2,060–$2,120 (previous accumulation zone)
TP3: $1,950 (macro support & last strong demand)
✅ Summary
Structure:
- Price is compressing within a bullish continuation pattern, awaiting breakout confirmation.
Bias: Slightly bullish unless the swing low at $2,319 is broken.
Confirmation Needed:
- Break above or below pennant boundaries with volume.

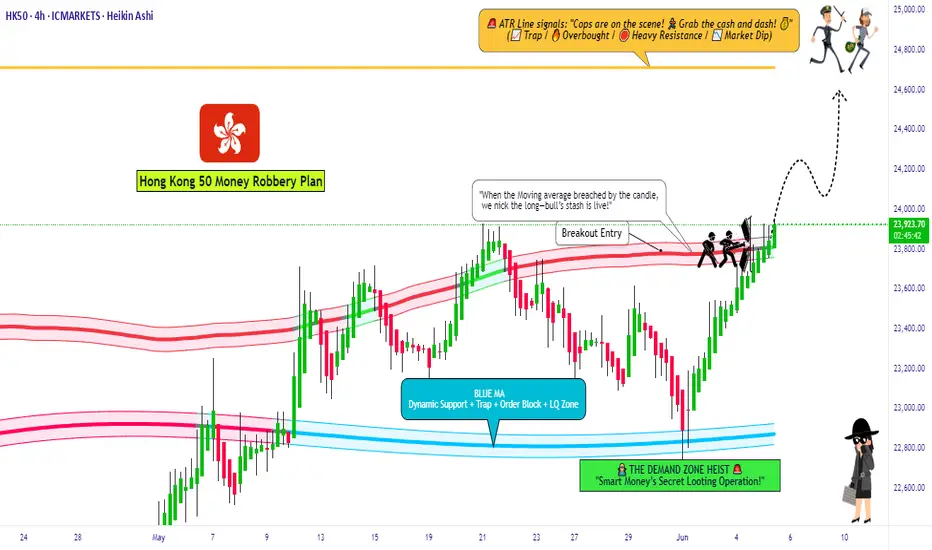
The HK50 Robbery: Can You Grab the Cash Before the Cops Arrive?🚨 HK50 "Hong Kong 50" HEIST ALERT: Bullish Loot & Trap Escape Plan! 🚨
🌟 Hi! Hola! Ola! Bonjour! Hallo! Marhaba! 🌟
Dear Money Makers & Market Robbers, 🤑💰💸✈️
Based on 🔥Thief Trading Style🔥 (technical + fundamental analysis), we’re plotting the ultimate heist on the HK50 "Hong Kong" Index Market Cash market! Our master plan focuses on a long entry—targeting the high-risk ATR Zone (overbought, consolidation, potential reversal). Beware: Bears are lurking, and traps are set! 🏆💸 Book profits fast, stay wealthy, and trade safe! 💪🎉
🔓 ENTRY: The Vault Is Open – Swipe the Bullish Loot!
Buy Limit Orders: Place within 15-30min (recent swing low/high).
Alert Recommended! Don’t miss the heist.
🛑 STOP LOSS: Escape Route
Set near the latest swing low or below 4H MA (~23500.00).
Adjust based on risk, lot size, and multiple orders.
🎯 TARGET: 24700.00 (or Run Before It Hits!)
Scalpers: Only long-side plays! Use trailing SL to lock profits.
Swing Traders: Execute the robbery plan patiently.
📡 MARKET INTEL: Why HK50 "Hong Kong" Index Market is a Bullish Target
Fundamental Drivers: Macro trends, COT data, geopolitics, sentiment.
Intermarket & Index-Specific Factors in play.
👉 For full analysis, check the linkss below! 🔗🔗
⚠️ TRADING ALERTS: News & Position Safety
Avoid new trades during high-impact news.
Trailing SL is a MUST to protect profits.
💥 BOOST THE HEIST! Hit Like & Follow!
Support the plan → More profits → Easier robberies! 💰🚀
Stay tuned for the next heist! 🤑🐱👤🤩
DE40 – Buy the Dip Near Support & EMA ConfluenceTrade Idea
Type: Buy Limit
Entry: 24,171
Target: 24,555
Stop Loss: 24,039
Duration: Intraday
Expires: 06/06/2025 07:00
Technical Overview
Intraday dips continue to attract buyers, reinforcing the strength of the ongoing uptrend.
Price action is consolidating near all-time highs, with former resistance at 24,170 now acting as support.
The 20-period 4H EMA sits at 24,162, reinforcing this level as a dynamic support zone.
With no technical signs of exhaustion, the strategy is to buy into weakness, aiming for a breakout continuation toward 24,555.
Disclosure: I am part of Trade Nation's Influencer program and receive a monthly fee for using their TradingView charts in my analysis.

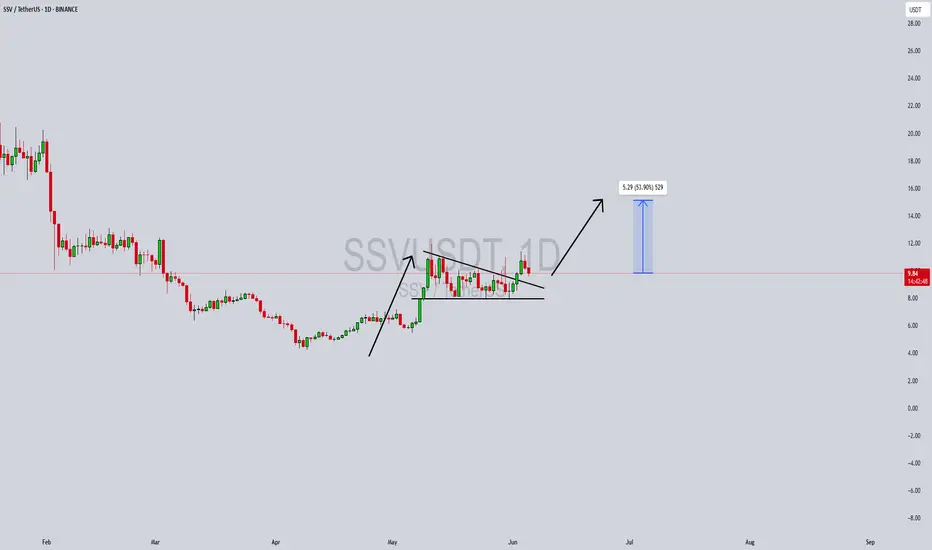
SSVUSDT Forming a Bullish PennantSSVUSDT is currently forming a bullish pennant pattern, which is typically a continuation formation that appears after a strong upward impulse. The pair recently experienced a significant breakout to the upside, followed by a consolidation phase forming a symmetrical triangle or pennant structure. With good volume maintaining support and bulls defending key levels, this setup is signaling that a strong breakout could be imminent.
SSV Network (SSV) plays a vital role in the Ethereum ecosystem by enabling decentralized staking infrastructure. As Ethereum’s staking market continues to grow, projects like SSV are drawing significant interest from investors due to their utility and real-world staking applications. With more ETH validators looking for secure and decentralized staking solutions, SSV is well-positioned for organic growth in the coming months.
The technicals support the bullish bias, with the chart projecting a potential 40% to 50% gain once price breaks out from the current consolidation zone. The bullish momentum building over the last few weeks, combined with strong investor sentiment and healthy volume, adds confidence to this projection. The breakout target aligns with prior resistance zones, making this a high-conviction setup for swing traders.
This pattern, in conjunction with the underlying fundamental strength of the SSV protocol, presents a compelling opportunity for traders watching altcoins with real utility. A successful breakout could attract more retail and institutional attention, especially as staking continues to trend in the broader crypto narrative.
✅ Show your support by hitting the like button and
✅ Leaving a comment below! (What is You opinion about this Coin)
Your feedback and engagement keep me inspired to share more insightful market analysis with you!
BHARAT WIRE ROPES LTD S/RSupport and Resistance Levels:
Support Levels: These are price points (green line/shade) where a downward trend may be halted due to a concentration of buying interest. Imagine them as a safety net where buyers step in, preventing further decline.
Resistance Levels: Conversely, resistance levels (red line/shade) are where upward trends might stall due to increased selling interest. They act like a ceiling where sellers come in to push prices down.
Breakouts:
Bullish Breakout: When the price moves above resistance, it often indicates strong buying interest and the potential for a continued uptrend. Traders may view this as a signal to buy or hold.
Bearish Breakout: When the price falls below support, it can signal strong selling interest and the potential for a continued downtrend. Traders might see this as a cue to sell or avoid buying.
MA Ribbon (EMA 20, EMA 50, EMA 100, EMA 200) :
Above EMA: If the stock price is above the EMA, it suggests a potential uptrend or bullish momentum.
Below EMA: If the stock price is below the EMA, it indicates a potential downtrend or bearish momentum.
Trendline: A trendline is a straight line drawn on a chart to represent the general direction of a data point set.
Uptrend Line: Drawn by connecting the lows in an upward trend. Indicates that the price is moving higher over time. Acts as a support level, where prices tend to bounce upward.
Downtrend Line: Drawn by connecting the highs in a downward trend. Indicates that the price is moving lower over time. It acts as a resistance level, where prices tend to drop.
Disclaimer:
I am not a SEBI registered. The information provided here is for learning purposes only and should not be interpreted as financial advice. Consider the broader market context and consult with a qualified financial advisor before making investment decisions.

USDCHF Will Go Higher! Long!
Here is our detailed technical review for USDCHF.
Time Frame: 9h
Current Trend: Bullish
Sentiment: Oversold (based on 7-period RSI)
Forecast: Bullish
The market is approaching a significant support area 0.819.
The underlined horizontal cluster clearly indicates a highly probable bullish movement with target 0.831 level.
P.S
Overbought describes a period of time where there has been a significant and consistent upward move in price over a period of time without much pullback.
Disclosure: I am part of Trade Nation's Influencer program and receive a monthly fee for using their TradingView charts in my analysis.
Like and subscribe and comment my ideas if you enjoy them!

