GOLD DAILY CHART MID/LONG TERM UPDATEHey Everyone,
Please see the daily chart update we have been trading and tracking for a while now, to give you all an overall view of the range and how we have been hitting targets after targets.
Previously we stated that we have a candle body close above 2686 opening 2760 and we now also had ema5 lock to further confirm this gap, which was hit perfectly completing this target and allowing plenty of time after the confirmation to get in for the action.
We then had a candle body close above 2760 with a gap above at 2797, which was hit last week completing this target.
2797 has left no further candle body close and therefore we may see some rejection here. We will now look for a body close above this level to confirm a continuation or we will see lower Goldturns tested for support to establish long term range. We have now also updated the retracement and swing range on this chart.
We will use our smaller timeframe analysis on the 1H and 4H chart to buy dips from the weighted Goldturns for 30 to 40 pips clean. Ranging markets are perfectly suited for this type of trading, instead of trying to hold longer positions and getting chopped up in the swings up and down in the range.
We will keep the above in mind when taking buys from dips. Our updated levels and weighted levels will allow us to track the movement down and then catch bounces up using our smaller timeframe ideas.
Our long term bias is Bullish and therefore we look forward to drops like this, which allows us to continue to use our smaller timeframes to buy dips using our levels and setups.
Buying dips allows us to safely manage any swings rather then chasing the bull from the top.
Thank you all for your likes, comments and follows, we really appreciate it!
Mr Gold
GoldViewFX
Commodities

GOLD MONTHLY CHART LONG TERM/RANGE ROUTE MAPHey Everyone,
Please see update on our monthly chart idea for our long term/range analysis.
Previous month in December we stated that the month started with a detachment to ema5 below for a correction, which was highlighted with a small mini circle on the chart for visual purpose.
- This detachment to ema5 was completed perfectly.
We also stated last month in December that the area above 2589 is a strong level of support with ema5 providing dynamic support now for a bounce.
- This also played out perfectly with ema5 providing dynamic support and above our 2589 support level for the push up, perfectly hitting our axis target 2702.
We then stated that we had two days for month end and will need a body close above 2702 for confirmation for a further continuation or a body close below 2589 to confirm the channel top test below. We also stated that if price closes this month in this range without the body closes, then we are likely to see play between this range for another month with not much detachment on the next monthly candle to ema5, which means the likely dynamic support should be provided by ema5 from the beginning of the month.
- This played out perfectly in January as the the ema5 provided the dynamic support right from the start, which followed with a nice push up. We now also have a candle body close above 2702 leaving a gap to 2825 Axis our long term target that we have been tracking over the months.
We will continue to use all support structures, across all our multi time frame chart ideas to buy dips also keeping in mind our long term gaps above. Short term we may look bearish but looking at the monthly chart allows us to see the bigger picture and the overall long term Bullish trend.
As always, we will keep you all updated with regular updates throughout the week and how we manage the active ideas and setups. Thank you all for your likes, comments and follows, we really appreciate it!
Mr Gold
GoldViewFX

BRIEFING Week #5 : Still Patient...Here's your weekly update ! Brought to you each weekend with years of track-record history..
Don't forget to hit the like/follow button if you feel like this post deserves it ;)
That's the best way to support me and help pushing this content to other users.
Kindly,
Phil

USOIL BEST PLACE TO SELL FROM|SHORT
Hello, Friends!
Previous week’s green candle means that for us the USOIL pair is in the uptrend. And the current movement leg was also up but the resistance line will be hit soon and upper BB band proximity will signal an overbought condition so we will go for a counter-trend short trade with the target being at 71.64.
✅LIKE AND COMMENT MY IDEAS✅

USOIL What Next? BUY!
My dear subscribers,
This is my opinion on the USOIL next move:
The instrument tests an important psychological level 73.75
Bias -Bullish
Technical Indicators: Supper Trend gives a precise Bullish signal, while Pivot Point HL predicts price changes and potential reversals in the market.
Target - 76.36
My Stop Loss - 72.34
About Used Indicators:
On the subsequent day, trading above the pivot point is thought to indicate ongoing bullish sentiment, while trading below the pivot point indicates bearish sentiment.
———————————
WISH YOU ALL LUCK

GOLD (XAUUSD): Support & Resistance Analysis For Next Week
Here is my latest structure analysis for Gold for next week.
Vertical Structures
Vertical Support 1: Rising Trend Line
Vertical Resistance 1: Rising Trend Line
Horizontal Structures
Resistance 1: 2816 - 2820 area
Support 1: 2786 - 2790 area
Support 2: 2718 - 2732 area
Support 3: 2689 - 2698 area
Support 4: 2655 - 2663 area
Support 5: 2614 - 2635 area
Support 6: 2596 - 2605 area
Support 7: 2583 - 2585 area
Consider these structures for pulback/breakout trading.
❤️Please, support my work with like, thank you!❤️

WTI on high time frame
"Dear traders, concerning WTI, the price has touched $73 and has been technically rejected from this level. Candle formations on higher time frames suggest a potential increase in price. Considering the political and geopolitical factors outlined in this article (www.tradingview.com), if the price can hold above the $73 zone, my view is that the next target could be $76."
If you have any specific questions or need further assistance with your message, please let me know!

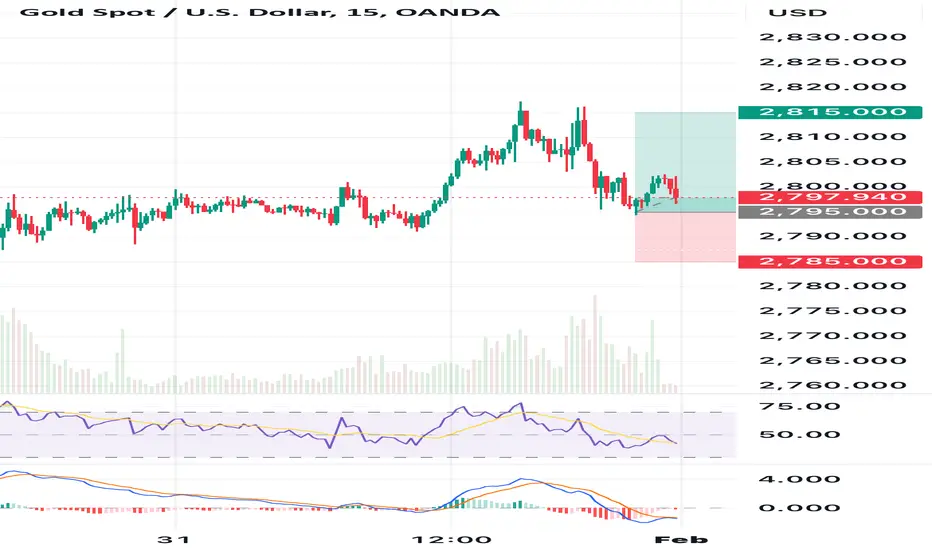
Nonfarm Ahead: The Decisive Moment for USD and Gold Trends!🌍 Market Overview:
As the highly anticipated Nonfarm Payrolls report approaches, both USD and gold markets are poised for significant volatility. This report, alongside other key economic indicators, will set the tone for market sentiment and trading opportunities in the week ahead.
📊 Key Economic Updates for the Week:
Nonfarm Payrolls (Friday):
Expected to show solid job growth, influencing USD strength.
Gold may react inversely to USD performance based on labor market data.
ISM Services PMI (Thursday):
Offers insights into economic activity and inflation trends.
Fed Watch:
Traders will monitor speeches from Federal Reserve officials for clues on future rate decisions.
📈 Technical Analysis for Gold (XAU/USD):
Resistance Zones:
$2,797 - $2,811: Key levels to watch for potential sell opportunities if price action shows exhaustion.
$2,834: Major resistance zone aligning with previous highs.
Support Zones:
$2,762 - $2,748: Short-term support; potential buy zone for a bounce.
$2,734 - $2,720: Deeper support aligned with FVG (Fair Value Gap).
Key Observations:
Gold is currently trading near the upper boundary of a rising channel.
Price action suggests a potential pullback to fill liquidity gaps before continuing its trend.
💡 Strategic Insights:
USD (DXY):
Recent strength in the USD has created upward pressure. A robust Nonfarm report could further boost the DXY.
Gold (XAU/USD):
Any signs of labor market weakness could support gold as investors hedge against economic uncertainties.
⚠️ Cautionary Notes:
Nonfarm Payrolls week is often marked by market volatility and unpredictable movements.
Traders are advised to manage risk carefully, adhere to stop-loss levels, and avoid over-leveraging.
🤔 What's Your Take?
Do you think Nonfarm data will push USD higher or bring more support for gold?
👉 Follow me for timely updates and trade setups to capitalize on this week’s volatility! 🚀

Energy Policy and USDWTIKey Entry Points:
Ideal Entry: $78 (Sell Position)
The $78 level was an optimal sell entry, primarily due to the declaration of emergency in the energy sector made by the new administration. This policy move is expected to increase energy production significantly. The current administration is heavily investing in the energy sector to mitigate price increases in other sectors, combat inflation, and maintain or reduce it. This macroeconomic context highlights why $78 was a strategic sell zone.
Current Entry Opportunity: $74 (Sell Position)
From a technical analysis perspective, $74 is a notable resistance level. While this level carries more risk compared to $78, it presents a viable sell opportunity due to price inefficiency beginning at this point. Observing the daily chart, we notice an efficient bearish trend with a clear price inefficiency that originated at $74. This inefficiency creates a strong resistance zone, making it a reasonable point for continuation to the downside.
Technical Analysis Across Timeframes:
Daily Chart:
The current bearish trend remains intact. The inefficiency at $74 reinforces the case for selling at this level. While not as secure as the $78 zone, it offers a good probability for a continuation to lower levels.
Weekly Chart:
The market is currently in an impulsive phase. However, no significant support or resistance zones are evident within this timeframe. This lack of structural confirmation increases the risk of entering at this level.
Monthly Chart:
The monthly chart shows a clear rejection from a downward resistance. This reinforces the bearish outlook and aligns with the target at $70.80, which represents a strong support level.

Understanding XAU/USD TradingXAU/USD represents the value of one troy ounce of gold in US dollars and is one of the most actively traded assets in the financial markets. It is often used as a hedge against inflation, currency devaluation, and economic uncertainty. Traders and investors closely monitor XAU/USD due to its strong correlation with macroeconomic factors, such as central bank policies, geopolitical risks, and market sentiment.
Key Factors Affecting XAU/USD
1. US Dollar Strength – Since gold is priced in USD, a stronger dollar typically weakens gold prices, while a weaker dollar supports them.
2. Interest Rates & Fed Policy – Lower interest rates make gold more attractive, as it doesn’t yield interest, whereas higher rates make other assets like bonds more appealing.
3. Inflation & Economic Uncertainty – Gold is considered a safe-haven asset, meaning its demand rises during periods of economic instability or high inflation.
4. Central Bank Reserves – Central banks globally hold gold as a reserve asset, and their buying or selling activities influence prices.
XAU/USD Trading Strategies
• Trend Following: Traders use moving averages and technical indicators like MACD and RSI to capitalize on gold’s long-term trends.
• Breakout Trading: Monitoring key resistance and support levels to enter trades when price breaks above or below significant levels.
• News-Based Trading: Economic reports such as Non-Farm Payrolls (NFP), CPI, and Federal Reserve announcements can cause high volatility in gold prices.
Why Trade XAU/USD?
Gold is a 24-hour market, highly liquid, and offers significant opportunities for both short-term traders and long-term investors. It is influenced by global economic events, making it an exciting instrument for traders looking to hedge risks or profit from price movements.

Gold’s Gleam: Navigating the Bullish Terrain Amid Global UncertaAs of February 1, 2025, gold (XAU/USD) is trading around $2,733 per ounce, reflecting a robust uptrend. Technical indicators, such as the price holding above key moving averages and a bullish MACD crossover, suggest continued upward momentum. Fundamentally, gold’s appeal as a safe-haven asset is bolstered by ongoing geopolitical tensions and expectations of stable or lower interest rates from the Federal Reserve. Looking ahead, if gold maintains support above $2,710, it could target resistance levels near $2,765 and $2,790. However, stronger-than-expected U.S. economic data or hawkish Fed policies could pose downside risks.
TARIFFS Will Lead To Inflation!? NOPE!So many talking heads crying TARIFFS will be inflationary,
but it’s mostly uneducated fear-mongering.
Let’s look at the cold, hard USIRYY and CPI data to figure out the truth behind this.
From March 2018 through September 2019, President Trump had eight waves of tariff announcements on C-H-I-N-A, plus some steel and aluminum ones on Mexico and Canada.
In order to combat these inflation worries, Trump did what he said he was going to do…
DRILL BABY DRILL.
For the first time since 1949, the US would be a net exporter of oil.
We can see there was a quick spike in inflation from stockpiling imports before tariffs were fully implemented, but inflation quickly plummeted nearly in half as the US became a net exporter.
Fast-forward to today, and coincidentally inflation is at 2.9% which is right around where it was when Trump imposed the tariffs during his last presidency. Funny how that works out, eh ;)
Trump has declared the US will DRILL BABY DRILL bigger than ever, which should lead us to believe that this time is NOT different and inflation will go down again.

Weekly Market Forecast Feb 2-7thThis is an outlook for the week of Feb 2-7th.
In this video, we will analyze the following FX markets:
ES \ S&P 500
NQ | NASDAQ 100
YM | Dow Jones 30
GC |Gold
SiI | Silver
PL | Platinum
HG | Copper
The indices were not easy to trade last week, as there were plenty of fundamentals at play. However, they are relatively still strong, and I am looking for further gains next week.
NFP week, imo, is best traded Mon-Wed. Thurs will likely see consolidation until the NFP news announcement Friday morning. I will look to fade the news release on Friday for NY Session.
Enjoy!
May profits be upon you.
Leave any questions or comments in the comment section.
I appreciate any feedback from my viewers!
Like and/or subscribe if you want more accurate analysis.
Thank you so much!
Disclaimer:
I do not provide personal investment advice and I am not a qualified licensed investment advisor.
All information found here, including any ideas, opinions, views, predictions, forecasts, commentaries, suggestions, expressed or implied herein, are for informational, entertainment or educational purposes only and should not be construed as personal investment advice. While the information provided is believed to be accurate, it may include errors or inaccuracies.
I will not and cannot be held liable for any actions you take as a result of anything you read here.
Conduct your own due diligence, or consult a licensed financial advisor or broker before making any and all investment decisions. Any investments, trades, speculations, or decisions made on the basis of any information found on this channel, expressed or implied herein, are committed at your own risk, financial or otherwise.

EURUSD H4EUR/USD has formed a downtrend structure. It is likely to drop further, making a lower low. After that, it may consolidate sideways before completing the structure.

The Coffee Code: A Short Opportunity Hidden in Plain SightThere is a difference between seeing the market and truly understanding it. Most traders react. The enlightened anticipate.
This week, the COT strategy has illuminated a setup so clear, yet so overlooked, that only those who understand the deeper language of the markets will act. Coffeewhispers a warning, and few are listening.
The Codes Have Been Revealed:
🔻 Code 1: Commercials' COT Index – The real insiders, the ones who move markets, are at a bearish extreme. The last time we saw this setup? A major reversal followed.
🔻 Code 2: Positioning Extremes – Large specs are at an all-time high in longs. When the herd rushes in, exits become crowded.
🔻 Code 3: Advisor Sentiment – The so-called “experts” are euphoric. When advisors scream bullishness while commercials quietly stack shorts, it’s a sign. A big one.
🔻 Code 4: Valuation – Coffee is severely overvalued relative to Gold, Treasuries, and the Dollar. The weight of reality will soon press down.
🔻 Code 5: ADX Over 60 – A high ADX signals a trend’s climax. The moment it rolls over is the key to this code triggering the move.
🔻 Code 6: Seasonality – Mid-February to March? Historically, a time of decline. The cycle repeats for those who see it.
🔻 Code 7: Cycles Colliding – Multi-timeframe cyclical pressure is now aligned against coffee.
The rarest and most powerful force in motion.
Additional indicators confirm it. Distribution. Divergences. Ultimate Oscillator. Williams ProGo. %R sell zones. Every signal is flashing red.
And yet, most will hesitate. Most will ignore the signs. They will wait until it's too late.
The question is not whether the opportunity exists. It’s whether you can see it.
If you understand what’s written here, you already know what comes next.
If you don’t... then perhaps it’s time we talked.
Disclaimer
The information provided in this content is for educational and informational purposes only and should not be construed as financial advice, investment recommendations, or an offer to buy or sell any securities or financial instruments.
Trading financial markets involves significant risk, including the potential loss of capital. Past performance is not indicative of future results. You are solely responsible for your trading decisions and should conduct your own research or consult with a licensed financial advisor before making any financial decisions.
The creator of this content assumes no liability for any losses or damages resulting from reliance on the information provided. By engaging with this content, you acknowledge and accept these risks.
Acknowledgment
The strategies and concepts taught in this class draw significant inspiration from the works and teachings of Larry Williams, a pioneer in trading and market analysis. His groundbreaking research and methodologies have shaped the foundation of modern trading education.
While this class incorporates Larry Williams’ principles, the content has been adapted and presented to reflect my own understanding and application of these ideas. Full credit is given to Larry Williams for his original contributions to the field of trading.

The Market Matrix - Gold, Crude, DXY & Nasdaq for Feb 1 2025This weeks edition of The Market Matrix.
Disclaimer
The information provided in this content is for educational and informational purposes only and should not be construed as financial advice, investment recommendations, or an offer to buy or sell any securities or financial instruments.
Trading financial markets involves significant risk, including the potential loss of capital. Past performance is not indicative of future results. You are solely responsible for your trading decisions and should conduct your own research or consult with a licensed financial advisor before making any financial decisions.
The creator of this content assumes no liability for any losses or damages resulting from reliance on the information provided. By engaging with this content, you acknowledge and accept these risks.

Dollar - Gold Market CorrelationThe Dollar (DXY) has closed extremely bullish this week. This is another confluence that we can see Gold (XAUUSD) start moving down soon or later.
As you all know the DXY & XAUUSD have negative market correlations, so when one moves up the other move down. The Dollar has been correcting down recently, which has led to Gold pushing up & creating new ATH’s. However, I now expect Dollar bulls to resume, which means we can see Gold get ready for a bear market in the mid term.

Golden Opportunities: Navigating the New Era of InvestmentFolks, we're witnessing something truly remarkable with XAUUSD. Gold's weekly uptrend is not just a blip on the radar; it's a beacon signaling a return to the fundamentals I've been harping on for ages. Recall my earlier insights? I pegged the long-term trend in Gold, and here we are, watching it soar. Trump's chatter about inflation and rates? It's like watching a chess game where each move by the Fed could be influenced by such rhetoric. The market, my friends, seems to be betting on this narrative, pricing in these potential shifts.
Now, let's not forget the basics. Historically, precious metals dance to the tune of real interest rates - those inflation-adjusted numbers. Sure, during times of market panic or geopolitical tension, Gold might get caught in the crossfire as either a collateral darling or a safe haven. But in these calmer waters, it's the real rates that dictate the dance. So, keep your eyes on the prize. Gold isn't just shining; it's setting the stage for what might be a golden era in investment. Watch, learn, and maybe, just maybe, enjoy the ride as we navigate these waters together. Stay vigilant, and may your investments be as golden as your opportunities.
Horban Brothers,
Alex Kostenich

WTI - Weekly forecast, Technical Analysis & Trading IdeasMidterm forecast:
While the price is above the support 64.000, resumption of uptrend is expected.
We make sure when the resistance at 80.100 breaks.
If the support at 64.000 is broken, the short-term forecast -resumption of uptrend- will be invalid.
Technical analysis:
A trough is formed in daily chart at 66.510 on 11/18/2024, so more gains to resistance(s) 75.446, 77.920 and maximum to Major Resistance (80.100) is expected.
Take Profits:
75.446
77.920
80.100
83.961
87.000
93.882
100.802
109.192
126.350
__________________________________________________________________
❤️ If you find this helpful and want more FREE forecasts in TradingView,
. . . . . Please show your support back,
. . . . . . . . Hit the 👍 BOOST button,
. . . . . . . . . . . Drop some feedback below in the comment!
🙏 Your Support is appreciated!
Let us know how you see this opportunity and forecast.
Have a successful week,
ForecastCity Support Team

GOLD it is!!Starting from today! MastaCrypta would analyse gold and oil as well! pretty obvious for new comers how my lines work!

SILVER: Short Trading Opportunity
SILVER
- Classic bearish setup
- Our team expects bearish continuation
SUGGESTED TRADE:
Swing Trade
Short SILVER
Entry Point - 31.324
Stop Loss - 31.671
Take Profit - 30.750
Our Risk - 1%
Start protection of your profits from lower levels
❤️ Please, support our work with like & comment! ❤️

Will Oil jump against Trump's requests?On a technical perspective, Oil could reverse from the current price and start to climb again targeting buyside, as we have seen a divergence between Brent and WTI. However, it looks like Brent is weaker and might not be able to validate higher prices.
Next week's OPEC meeting could clarify the direction, as I do not believe they will succumb to President Trump's requests of lowering Oil prices massively, and we could be looking for a volatile month.

USOIL: Weak Market & Bearish Forecast
The analysis of the USOIL chart clearly shows us that the pair is finally about to tank due to the rising pressure from the sellers.
❤️ Please, support our work with like & comment! ❤️
