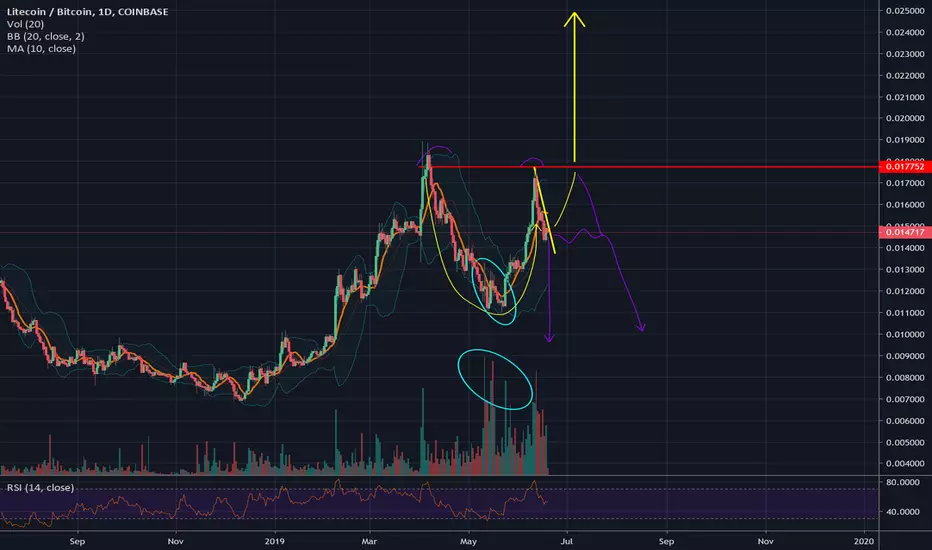
Litecoin/Bitcoin: Cup and Handle Or Double TopCurrently, Litecoin/Bitcoin looks like it could either be a cup and handle or a double top, in this idea, I will represent both possibilities.
The Cup and Handle:
In yellow, the cup and handle can be seen with the resistance at 17752 satoshis, it has a price objective of approximately 24908 satoshis derived by measuring the height of the cup. The to the handle resistance and the handle is noted by the yellow diagonal line. Although this looks very similar to a cup and handle pattern, this has strong reason not to be: first , the volume is highest at the bottom of the cup, where in a standard cup and handle, the volume is suppose to decrease as price decreases this is circled in light blue. Since volume is such an important factor to determining patterns, in most situations I would then assume the pattern is not valid, however, Litecoin has been one of the strongest cryptos so its possible for it to retest the neckline.
The Double top:
The bearish situations are represented by the purple lines, and it can follow the appropriate direction by retesting the resistance of the cup and handle by failing to cross it or it can drop from this point on. The volume better fits this, because there was a large rejection on the right side (the second attempt to drive through the high). However, it is also important to note that this is near historical resistance.
Given that there is bullish news, it is possible that Litecoin will see the rally of the cup and handle, as for the moment, I am neutral on both outcomes. In addition, it is possible that this is a harmonic pattern, however, harmonic patterns are something that I need more time to develop.
Continuationpatterns
Is ETH preparing for another big move?It looks like ETH is building a symmetrical triangle before (hopefully) moving on to higher ground. We're seeing higher lows and lower highs, all on decreasing volume. The height of the flag pole is approximately $45 so if there is a breakout on higher volume we can expect the price to climb $45 from its breakout point.
There was another symmetrical triangle back in Sept-Oct 2018. Since that triangle didn't breakdown until it got all the way to vertex we can treat that level as pretty strong resistance. ETH will probably see some turbulence in the $200 to $210 range


ONTBTC - potential for upside.Blue triangle indicates the current range.
Green box is buy.
Red box is sell.
Blue line indicates major resistance.
ONTBTC signalling a buy at this level.
Target 1: 3600
Target 2 (moon): 4350


USDJPY 4H TRADESPair is in a possible range with price at the bottom
Price may return to the ma's (Long) or breakout of the bottom support (Sell)
Macd has crossed above the Red signal line Bullish bias
Long Trade
Buy stop at 112.85
Buy Take Profit at 113.20
Close trade if Macd crosses below Red signal line
Find appropriate SL
Short Trade
Entry breakout of bottom support on a 15m break-hook-go pattern
Sell Take Profit will be the 800 sma
SL above range bottom breakout candle
*Watch for Bearish failure move
If price moves back into range above bottom support
Aggressive Buy with candle close back into range
Also use Long trade signals


US OIL 1 Day & 4 HR - Head & Shoulder Bottom Secondary BreakoutAbout a month ago we took a look at US Oil & identified a classic reversal pattern called a head & shoulders bottom. We predicted a breakout from this level, however, there was a previous level of structure slightly above the neckline that I thought would be tested first. After nearly a month of consolidation, we've finally violated that level which allows me to predict a continuation higher.
Two extension levels that I have on my radar are the $59.50's level which hosts both a 50% Fibonacci retracement & a 127.2 extension. And the $64 even handle where we have confluence between the 61.8 retracement & the 161.8 extensions.
Your Trading Coach - Akil


BTCUSD: Best Fit Ascending Triangle Suggests ContinuationA best fit ascending triangle and volume suggests that we will see some continuation; beware, trading this pattern carries a high risk of fakeouts wait for volume to confirm and set tight stops. (Entertainment Only)
On a personal note, I have updated my current entry/exits and no trade zones.

Dollar crawling up to face monthly resistanceMonthly chart of Dollar index suggesting further upside. DXY bounced off 0.5 Fib with precision, broke 0.382 and now closed above 0.236 with a strong weekly candle. Retest of 102-103.5 is imminent in my view.
* Consider US stock market topping behavior as of late, strong dollar would push stocks and commodities under more pressure.
Although this is temporary knowing that falling US Stock market would force FED to cut interest rates sharply.. Inflation kicks in and dollar tanks to Great recession lows.

GBPJPY - Long - Daily Chart - MACD Continuation TradeEntering on a bullish MACD cross while ABOVE zero-line , signaling bullish continuation.
Note that I use MACD ONLY for continuation and do not attempt to find reversals using the MACD as I do not find it to be very accurate in FX
Trade is on the daily timeframe and has a 1 ATR stoploss (148 pips), 1ATR target 1 where I take 50% of my position off and move stop to breakeven, then I use a trailing stop following the other 50% of my position setting my stop at the low of each subsequent daily candle that continues higher. These trades can take many days to play out and I often hold over the weekends, do not take this trade if you struggle to control your risk or are uncomfortable holding for weeks at a time.
I expect this setup to go against me over the next few days as this was already a strong move up and may need to cool off for a day or 2, I expect to hit profit targets sometime next week but don't trade based on time.
It is also important to note that I normally allocate up to 1.5% account risk on continuation trades however I do not risk over 1% when I trade GBP (due to the fundamentals around Brexit). A similar trade to this could also be expressed by shorting EURGBP although that pair has not made a signal on the indicators yet and is most dramatically news driven.
The historical probability of MACD continuations on the top 20 fx pairs (with my 1ATR parameters) is around 68%, please perform your own backtesting of this strategy as you can achieve higher or lower probability results using different stop losses and profit targets.
Best of luck traders.

BTCUSD: Longest Time Above Upper KC Band Since Nov. (Reversal?)As we can see from the Keltner channels, we are getting the strongest strong sell signal, a GTFO signal if you will, in almost three months. As I have said before, unless this is a true breakout bringing us above the $4,000 mark, I believe a strong reversal is incoming and we are entering into a no-trade zone, IMO, soon either way. (Successful trade marked) (Entertainment Only!!!)

BTCUSD: Bull flag has hit its target; downside to come?It seems that my initial prediction (brown line) seems to be the most accurate; this rise mimics the last move in size and percentage gained with the main difference being that it happened a bit faster. The more important thing to look at is whether or not that there will be a continuation of this move thus breakingout (which volume supports); by doing so, a bullish breakout would be beating the odds of the continuation pattern. (Entertainment Only)

Forex Correlating PairsUSDCHF mirros USD Dollar Index
Chart shows weak dollar
Macd overbought
Bearish engulfing candle pattern
GBPUSD
Forex power indicator shows
Strong GBP Weak USD
NY session starts in 15 min
Possible bullish continuation move for GBPUSD

US 2YTNOTE TRADE SETUPAfter making a new bullish impulse have of the last month and a half we have settled down and formed a corrective wave. This corrective wave has formed a falling wedge pattern and we broke out. Look for a rise in Bond prices.
If you guys enjoy the analysis leave a follow! :) - Much Love

ETH short term downtrend continuationIn coorelation to BTC, LTC, XRP and XLM, there is a significant downtrend. As shown on the chart, the two continuation candles show selling pressure. The two candles also bounced at support/resistance lines, which made them important.
In addition, there is a descending triangle looking to break downwards. Targets are indicated by the yellow arrows.


GBPJPY D1- Continue Rectangle or Bullish Dragon Pattern?GBPJPY D1- Continue Rectangle or Bullish Dragon Pattern?
Currency Pair: GBP.JPY
Time Frame: Daily
Predicted Direction: Neutral
- Price bounced several times within PCZ
Entry:
I will open Sell if the price will make breakdown of @138.74 (SL = @141.41, TP = @130.59)
I will open Buy if the price will make breakout of @141.41 (SL = @138.74, TP = @148.73)
GBP.JPY updates will be available in the comments section below.
The brief trade analysis presented above is my predicted direction and requires multiple different indicators and confluence factors prior to validating a trade opportunity.

[ETHUSD] Descending Triangle Short Potential $75 TargetETH is back at it again. The small relief rallies we have seen off of the massive drop, all the way down to the low $80s, have started to become confirmation points for forming an upper bound of yet another descending triangle pattern. As you can tell in the chart, every rally has been stuffed off of the 100 ema (orange line), and while the bulls have mustered significant volume they cannot manage to hold any ground they have gained. The large hourly green candle with the spike of 84 to the 104 wick was a strong attempt from the bulls to regain control over the market. Unfortunately this candle wasn't met with additional buying volume and we can see the resulting negative price consolidation that followed. The bulls really needed to rally around that spike if they wanted the chance to continue driving the price up.
Unfortunately it looks like the bulls are just running out of steam to continue pushing a bullish trend. The 100 ema is a huge point of resistance. As we can see here the 100 ema is starting to coincide with the formation of the upperbound of a potential descending triangle.
A descending triangle pattern is a clear continuation pattern which, if confirmed, would suggest that ETH has further to fall before we can look for a solid bottom to start a long-term rally.
I am hoping to see another pump up to test the 100 ema resistance, this is where my target entry is for short positions. Entries on resistance have been very lucrative in the past as the bulls just cannot seem to gather enough strength to break these resistance points.
Suggest entries from 91+ up until 96, looking at movements above 95 as potential signals for bullish momentum and a denial of this pattern.
If this pattern is confirmed and ETH breaks the lower bound then we could expect ETH to test its annual low of $81 and below. A break below 81 would mean we have chewed up support (from May 2017 timeline) and could see ETH cruise on down to 75 or lower.
**This is educational advice, your investment decisions are up to your own discretion and risk tolerance. Do your own research and trade safe.**
Happy trading mates!

USOIL Possible Bear Continuation Targets USOIL is being well supplied after pulling back to the grand 45 degree line coming down from the top. If 5000-5050 area fails, the bear case becomes more relevant. Assuming pre mortem conditions, the inventory report turning this around and supply being dried up by incoming new demand, it is reasonable to look for entry opportunities on the lower timeframes. It's better to get out after being proven wrong shortly after entry than hold the bag for who knows how long.

GBPNZD DAY BEST LUCKY STAR DOJI STRATEGYTrading Doji candlestick as a stand-alone trigger signal is a bad idea. Price usually whipsaws around doji.
Note #1: In technical analysis, the Doji candle is a neutral pattern if it’s used as a stand-alone candlestick.
However, if the Doji candle it’s used in conjunction with the preceding price, we can establish a bullish or bearish bias.
A whipsaw pattern involves price moving chaotically above and below a certain key support and resistance level. Whipsaw patterns are also referred to as false breakouts. We have developed our Japanese Doji trading strategy around this price feature.
Step #1: For short trades we need a steady move downward, below the 14 –day MA
Even though most traders used this Japanese candlestick pattern as a reversal pattern, we have found out through some testing that the Doji candle performs best as a continuation pattern. So the first step we need to undertake is to determine the trend direction.
When we see the price moving steady downwards below the 14-day MA we have enough reasons to believe a downtrend is in progress.
Step #2: Look for a Doji Candlestick to develop near the 14-day MA and inside the previous candle price range.
Next, there are two more conditions that need to be satisfied for a valid trade setup. The first thing to consider is the location of the candlestick setup. We need the Doji candle to develop near the 14-period MA.
Secondly, we need the Doji candle to be contained inside the price range of the previous pattern. Basically, this will lead to the formation of another pattern called an inside bar.
So, we have a pattern within a pattern.
Step #3: Whipsaw pattern: Look for a false breakout above the previous two-bar pattern. Go short once we recover and break below the Doji candle opening price
Now, we’re going to bring to light how we use the whipsaw pattern to our advantage.
The Doji candles are very well-known candlestick patterns for producing a lot of false breakouts. We also know that a break of a level against the prevailing trend has fewer chances to success.
So, by putting all these pieces of the puzzle together we were able to develop one of the best Doji strategies, which eliminate the scenario where your stop loss is prematurely triggered.
After the false breakout, we wait for the price to recover and we only sell once we get price breakouts the bearish Doji candle opening price.
Note #2: We want everything to happen within the first candle after the Doji bar. So the false breakout and our entry should be immediately on the next bar following the Doji candlestick.
Let’s now determine an appropriate place to hide our protective stop loss and a proper way to exit our trade.
Step #4: Place protective SL above the current daily candle high. Take profit once we break below the inside bar pattern or a support level.
We aren’t going to stay in this trade for a very long period of time. That’s the reason why we exit our profitable trade once we break below the inside bar pattern or nearest sup/res. When it comes to placing our protective stop loss, we can hide it above the high of the candle that triggered our entry.
Long trade is just opposite setups.

UPDATE: [ETHUSD] Descending Triangle $100 TargetAhoy mateys,
Yesterday I published a chart looking at ETH dropping to $100 from a descending triangle pattern that I saw forming. I must admit my focus was on too narrow of a timeline, a triangle did form and did (slightly) breakout but my 30 minute interval chart did not do the best job at putting a more accurate timeline.
Regardless, my suggested entries of $133-134 ETH appear to be valid and I am sticking to my cannons there. On that idea I posted updates pulling out to further and further timeframes as trading progressed.
This update is a little more in depth look at the longer term, building off of my original chart and the updates I had made to it. I have updated my fib retracement points to better reflect current trend activity for the timeframe I am looking at. I am seeing very strong potential for ETH to bounce off of the lower bound of this pattern one last time, retest $133 for a final time, before confirming yet another continuation of this down trend we have been in.
We can also see that a bearish MACD cross may be approaching. In addition to that, a bearish crossover on the Stoch RSI indicator signals that we may be dropping out of this overbought territory, this does not come as a surprise to me as it seems very clear that buyers are still fleeing the market. ETH needs some serious bullish activity to prevent another breakout in my opinion, and this pattern isn't indicating anything bullish to me right now. Otherwise we are just going to continue falling as major support has been continuously broken and we are already in the middle of a large breakout of a larger descending triangle that was formed on the continuation of the downtrend from the peak ~$1500 ETH price, aka we are in shark infested water mates.
I signaled the larger scale breakout two weeks ago as you can see on this idea I published at ETH $215:
If this trend continues I believe a $133-134 entry again is ideal if you can grab it. Anything above 131 is arguably a good trade as well. ETH may eventually turn around, but I am much more comfortable trading along with the trend than trying to call a reversal. Some argue ETH may go to 0, I am not as sure about that, but if we hit my $100 target then we may see much more pain to follow for ETH and crypto in general.
Trade at your own risk, do your own research, blah, blah, blah.
Happy trading!
