Eliotwave


USDCAD W1 1MUSDCAD near very strong suport made buy trand line from 2011 year. At the same time we have the and of correction Wave 2 of the Wave II. At the same time, we have small volume on thith level, it means, that big player is waiting for the next move up, whith position which was gathered during previous wave.
Chaykovskyy. Forex Education & Mentoring
www.facebook.com


Gold up We just finished the primary w.4 with triangle correction, as we all know that triangle usually the move before the last move so now is the time for the last move w.5, we can see that gold just broke the triangle in which confirm the start of w.5 of primary degree. We can see that w.1 of the lesser degree is finish and we are now in the correction w.2 of a lesser degree. The ideal retracement would be around 61.8% of w.1 in which we are very close to that already. We also might also see w.2 retrace back to around 78.6% but the count is still valid as Long as w.2 is not exceeding the beginning of w.1. This is the perfect trade with really good ratio with tight stop loss and high profit!.

DXY: Swing-Setup! Follow the TREND!#ChanceBuyHey tradomaniacs,
welcome to another free signal!
Important: Wait for the retracement down to entry and buy!
-----------------------------
Type: Swingtrade
Buy-Limit: 97.70
Stop-Loss: 97.55
Target 1: 98.00
Target 2: 98.17
Point of risk-reduction: 97.90
-----------------------------
LEAVE A LIKE AND A COMMENT - I appreciate every support! =)
Peace and good trades
Irasor
Wanna see more? Don`t forget to follow me.
Any questions? PM me. :-)

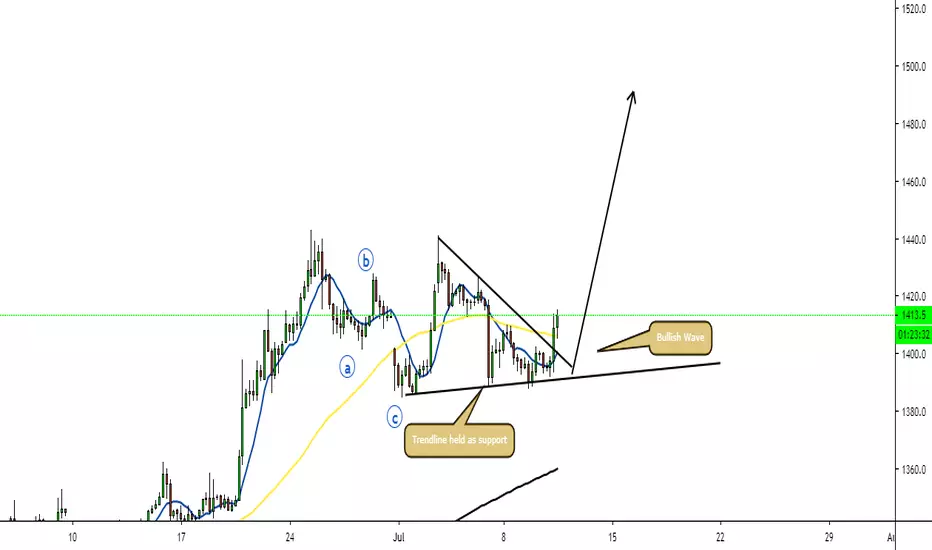
Gold Big Buy Set Up Wave AnalysisI am looking for Gold to push higher to 1500.00 price point for target 1 and eventually retest the highs around 1900.00 I believe the corrective structure is coming to an end and a big Bullish wave is in front of us.
UPDATE: Btc dump before the real bull market starts!UPDATE: Big dump incoming for Btc before the real bull market starts!

Big dump incoming for Btc before the real bull market starts!Big dump incoming for Btc before the real bull market starts!

USDCAD Long Term BUYHi.. We will keep an eye on it and watch lower time frame for price action to trigger our buys and close our sells.

USDCHF (Ascending Triangle) '1D'as you can see the entire pattern had finished its route, and now its in the retesting area after that we have a 3 Support Zones we can also name them 3 TakeProfit Zones.


Back to 2017! It doesn't mean that this must be true. But I think it's the most likely scenario.
I'm not an expert on the theory of elliott waves . But this all makes sense ... look at the NVT indicator. We will be able to buy at very low prices.
I see the current situation so that the price is rising from the last strength, it is exhausted. The price has grown too fast. We need a great historical correction.

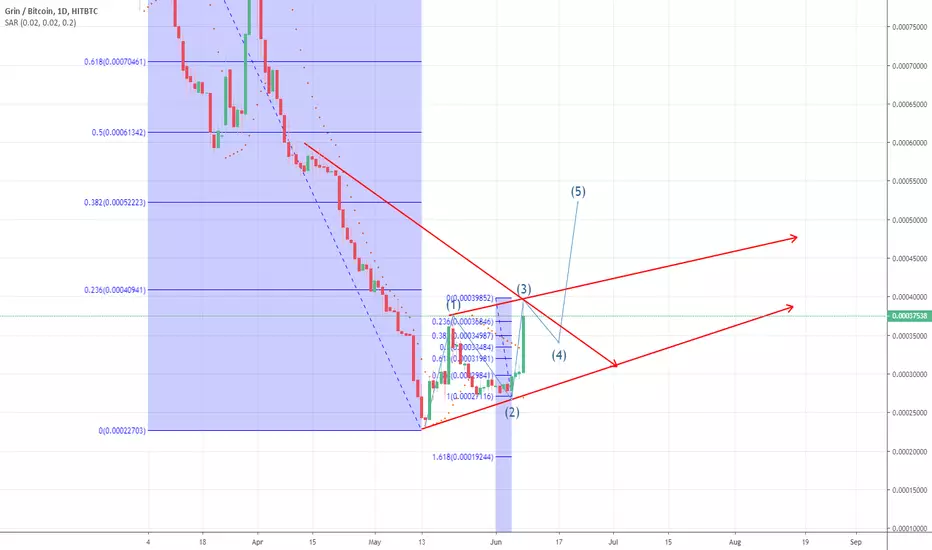
ETH Wave analysis All waves meet basic rules of Elliot analysis. As price chart display there is double stretching of third wave of the biggest order (green). In this green third wave there is yellow third wave which is also stretch. So on balance at the moment we are in fifth wave of stretch yellow wave.


Daily FB forecast timing analysis by Supply-Demand strengthStock investing strategies
View a Chart with Supply-Demand(S&D) strength forecast: www.pretiming.com
Investing position about Supply-Demand(S&D) strength: In Rising section of high profit & low risk
S&D strength Trend Analysis: About to begin an adjustment trend as a upward trend gradually gives way to a slowdown in rises and falling fluctuations
Today's S&D strength Flow: Supply-Demand strength has changed from a strong buying flow to a suddenly strengthening selling flow.
D+1 Candlestick Color forecast: RED Candlestick
%D+1 Range forecast: 0.3% (HIGH) ~ -1.3% (LOW), -0.5% (CLOSE)
%AVG in case of rising: 2.3% (HIGH) ~ -0.2% (LOW), 1.8% (CLOSE)
%AVG in case of falling: 0.8% (HIGH) ~ -1.4% (LOW), -0.6% (CLOSE)
Stock Price Forecast Timing Criteria: Stock price forecast timing is analyzed based on pretiming algorithm of Supply-Demand(S&D) strength.


XAUUSD LONG trade ideaFOREXCOM:XAUUSD
I'm using FIB Retracment, and FIB extensions in this analysis. This is just the potential path i believe it is gonna take.
I'm Using Eliot wave to determine how far it is gonna go. Once more, it could continue or stop short. Gonna keep an eye on this.
I'm setting my call levels at 1325 so ill know if it gets close to that point.
If you agree with this please like and follow
Thank you

Russle 2000 ShortAlthough I strongly discourage the action of shorting in my personal strategy this doesn't keep me from speculating on the possible price fluctuation of the index. Viewing recent recessionary signals such as the inverted yield curve, raising tensions in the US-China relation as well as US-Mexican relations I've come to the conclusion that there might be something sketchy going on in the markets. Also noting the decision of Neil Woodford to close withdrawals from his fund I've come to the conclusion that there is rising anxiety for investors on the future of stock prices. If this sentiment continues we could see perhaps lower lows than those seen during the December period. I personally believe the recent market rally was driven merely by the good news caused by the increased sales of the holidays and other factors as well, but now entering to one of the usually most negatives stages of the year the fragility of the market could again be exposed.
Additionally, from a technical point of view, we can observe a MACD cross over on the weekly chart. This indicates that the short-term average of price fluctuation is moving lower than the longer 26-period average, therefore, indicating a possible future change in the longer-term average and therefore moving the price lower. Also were positioned in a support level which may be tested and stand strong but with further downward pressure it could easily push through in the near future leading to a strong move to the downside.
Although I don't recommend a strategy based on buy and sell signals I feel the there is a high amount of bearish signals being triggered, not only in the chart but in the news as well as in economic data such as the Yield curve inversion. The low level of unemployment also signals me we're if not at then near full employment which could lead to higher wages and therefore layoffs (this is mear speculation and not based on any fundamental truth).
This analysis remains exactly the same on multiple other indexes such as the SPX, DJIA, and ME (although I belive the ME to be a way more riskier investment given the political situation of Mexico)
My recommendations would be:
1) Play it safe, don't short
2) Have your money on a safe haven such as gold or keep your money liquid
3) Buy once the market has had a significant drop such as the December lows and lower
4) Brace for impact

USD/RUB Strengthen of Russian RUB At the moment, the key factor determining the dynamics of the Russian currency is the inflow and outflow of money in Russian bonds. The current rubble appreciation is associated with a new influx of non-residents in GOV Bonds. Wave analysis of Eliot showed that at the moment we are drawing A to ABC (B is of a higher order), which means that the rubble will gradually strengthen. The correlation between RGBI and RUB / USD is more than 90%, making up a dependency model and substituting the potential values of the RUB / USD index, it received that the rubble could reach 61-62 rubbles per dollar. The fact that the wave in wave A 5 turned out to be stretched is indicated by the analysis of relations. According to Eliot, in the case of a stretched fifth wave, the motion ratio is (1 + 3) / 5 = either 1/1, or 0.618, or 1.618, in this case the ratio is a drop (1 + 3) wave = -4.6%, and a drop in 5 wave -7.6%, so 7.6 / 4.6 = 1.602, 4.6 / 7.6 = 0.605, which is close to the golden ratio.
