We Now Have Conditions for Limit Down Days in SPXMassive intraday pop today but it did not manage to advance much past the last high.
The size of the move today means if we had a big one day rejection of it that would now be a limit down day.
Which this specific thing does not have to happen (could down trend over a few days) break the low in this setp would give a strong case for limit down days to come.
It's not a term I use loosely.
In an optimistic outlook today we have a bullish wave 3 and the foothills of a new uptrend (or at least bull trap).
But if today rejects and turns out was a big bull trap - then we'd be about to head into the crash section of the move.
If you think it's been crashy so far - know that the second half is not slower than the first.
Harmonic Patterns

Bitcoin update 10.04.2025 - BTC - 98k in May🔥 The Markets Are on Fire — and We Know Who Lit the Match.
The last few weeks have been pure chaos.
Markets are crashing, confidence is shaking, and crypto is confused.
And let’s not pretend we don’t know who’s behind it.
Donald Trump.
Even a Korean guy selling panda souvenirs on the street told me:
“This Trump is ruining everything.”
And he’s not wrong.
Billions wiped. Positions wrecked.
But here’s the thing — this isn’t random. This is tactical drama.
Trump sees himself as a master negotiator, and here’s how he plays the game:
🎭 The Trump Cycle (Get Ready for the Loop)
Pressure — tariffs, chaos, media hysteria. We’ve seen it.
Relaxation — 90-day delays, fake calm.
Talks — and boom, “positive developments.”
Good News —
• “Bitcoin added to U.S. reserves.” in MAY?
• “Americans to receive new stimulus.”
• “China’s our friend again!”
Charm & Flirt Mode — improving global relations, smiling at cameras.
More good news — stock markets fly, crypto rips and everyone screams, “New bull run!”
And then?
💥 Back to pressure.
📆 September 2025 is the punchline.
That's when this cycle hits the weaker economies like a freight train:
✅ Broken supply chains
✅ Collapsing currencies
✅ Defaults
✅ And where there’s chaos — there’s war. Expect escalation in fragile regions like the Middle East.
✅ Crude oil falling to 40$
Markets will top on pure euphoria.
The reversal begins when everyone’s drunk on hopium and “good news”.
💼 My Plan? Ruthlessly Simple:
🔹 May I will participate in the first Offline/Online International Crypto Trading Cup 2025 by WhiteBIT
🔹Jun-August -Euphoria in the market
🔹 September - Take profits
🔹 Either short — or sip something cold on a quiet beach. But we will see
We’ve officially entered the Turbulence Zone.
The following 10 years will be insane — for those who adapt, evolve, ride the trends, and harness AI and tech.
If not?
You get left behind.
It’s not the strongest who survive — it’s the fastest to adapt.
Best regards, EXCAVO
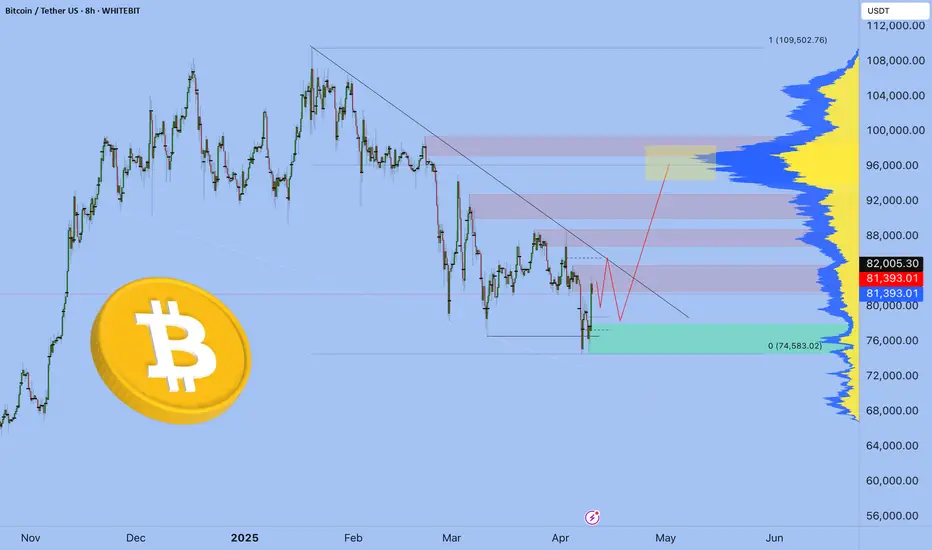
BTCUSDBitcoin (BTC/USD) shows a sell zone level around 82,175, which has recently been tested. The price reached this level and formed a significant resistance at 88,483, suggesting that Bitcoin could be facing downward pressure if it fails to break above this resistance.
The blue arrows indicate a potential scenario where the price could rise towards the sell zone and then reverse. The chart suggests that the price may experience a pullback as it moves lower toward the target area near 74,000.
the sell zone, where selling pressure is likely to be strong. This could be an ideal region to enter short positions, especially if Bitcoin rises to this area and shows signs of rejection. Traders may also look to add layers (additional short positions) as the price approaches this zone.
Overall, the chart anticipates a bearish correction after Bitcoin hits the sell zone, with a target move toward 74,000. Watching for rejection at the sell zone is key to entering a short position with confidence.

#USDJPY:1351+ Bullish Move One Not To Miss| Three TPs| JPY has been bullish since the dollar strengthened, potentially leading to a trade war that would make the Japanese yen more valuable to global investors. However, we may see a strong correction on all XXXJPY pairs, potentially returning stronger with a major bullish correction. We’re not sure if the price will hit all three take profit zones, but we’re interested in how far it goes.
Use accurate risk management. This analysis is purely for educational purposes only. Use your own knowledge and analysis before taking any entries.
Team Setupsfx_

GOLD I H1 CLS Within Monday CLS, KL - FVG , Model 1 , Target OBHey, Market Warriors, here is another outlook on this instrument
If you’ve been following me, you already know every setup you see is built around a CLS range, a Key Level, Liquidity and a specific execution model.
If you haven't followed me yet, start now.
My trading system is completely mechanical — designed to remove emotions, opinions, and impulsive decisions. No messy diagonal lines. No random drawings. Just clarity, structure, and execution.
🧩 What is CLS?
CLS is real smart money — the combined power of major investment banks and central banks moving over 6.5 trillion dollars a day. Understanding their operations is key to markets.
✅ Understanding the behaviour of CLS allows you to position yourself with the giants during the market manipulations — leading to buying lows and selling highs - cleaner entries, clearer exits, and consistent profits.
🛡️ Models 1 and 2:
From my posts, you can learn two core execution models.
They are the backbone of how I trade and how my students are trained.
📍 Model 1
is right after the manipulation of the CLS candle when CIOD occurs, and we are targeting 50% of the CLS range. H4 CLS ranges supported by HTF go straight to the opposing range.
📍 Model 2
occurs in the specific market sequence when CLS smart money needs to re-accumulate more positions, and we are looking to find a key level around 61.8 fib retracement and target the opposing side of the range.
👍 Hit like if you find this analysis helpful, and don't hesitate to comment with your opinions, charts or any questions.
⚔️ Listen Carefully:
Analysis is not trading. Right now, this platform is full of gurus" trying to sell you dreams based on analysis with arrows while they don't even have the skill to trade themselves.
If you’re ever thinking about buying a Trading Course or Signals from anyone. Always demand a verified track record. It takes less than five minutes to connect 3rd third-party verification tool and link to the widget to his signature.
"Adapt what is useful, reject what is useless, and add what is specifically your own."
— David Perk aka Dave FX Hunter ⚔️

EUR/USD Nears Key Resistance – Will the Uptrend Continue?📊 EUR/USD Daily Technical Outlook – April 10, 2025
EUR/USD is currently trading around 1.0964, following a strong upward move from 1.0800 to 1.1000. This rally has been driven by strong momentum and a clear break of structural resistance levels. However, the pair is now approaching a critical resistance zone between 1.1150 and 1.1200, which could lead to a potential pullback or reversal.
📈 Current Market Structure:
The pair has seen a solid rise from 1.0800, breaking through multiple resistance levels along the way. However, as it approaches the strong resistance area between 1.1150 and 1.1200, there may be some profit-taking or correction. The key question is whether the bulls can push through this resistance to continue the uptrend.
🔹 Key Resistance Levels:
1.1150 – 1.1200: This is the critical resistance zone. If price fails to break above this, we could see a pullback or consolidation.
1.1215: A further key resistance. If price reaches this level and struggles to move higher, it may signal a potential reversal.
🔸 Key Support Levels:
1.0960: Immediate support level. A pullback toward this area could offer another opportunity for buying if the bulls continue to dominate.
1.0800: Major support. A failure to hold this level could lead to further downside and shift the market sentiment to bearish.
📐 Price Action Patterns:
As the price approaches the strong resistance zone, we might see profit-taking or corrective moves. It's crucial to monitor how price reacts at these levels to determine the next potential move. A break above 1.1200 could signal continued bullish momentum, while failure could lead to a retracement.
🧭 Potential Scenarios:
✅ Bullish Scenario:
If EUR/USD manages to break through the 1.1150 – 1.1200 resistance zone, it could continue its uptrend toward higher levels. A close above 1.1200 would strengthen the bullish outlook.
❌ Bearish Scenario:
If price fails to break through resistance and pulls back below 1.0960, a deeper correction toward 1.0800 could be on the cards. A break below 1.0800 would suggest a more bearish outlook.
📌 Conclusion:
EUR/USD is at a critical resistance point. Watching how the pair reacts near 1.1150 – 1.1200 will be key in determining if the bullish trend can continue or if a correction is likely. These levels will act as the defining points for the next move.
💬 What’s your outlook for EUR/USD? Will the pair break above 1.1200, or is a bearish reversal imminent? Share your thoughts below 👇

#EURUSD: Buyers are exhausted, time for sellers! EURUSD reached a record high, but we see strong bullish exhaustion. We expect a price drop to fill the liquidity gap. Please use accurate risk management.
Good luck and like, comment for more.

10.04.25 Morning ForecastPairs on Watch -
FX:EURGBP
FX:NZDCAD
FX:AUDJPY
A short overview of the instruments I am looking at for today, multi-timeframe analysis down to what I will be looking at for an entry. Enjoy!

BTC/USD...4H chart pattren...To my analyze Bitcoin with a descending channel pattern, we'll consider the following key aspects based on your provided details:
1. Descending Channel Overview:
A descending channel is a technical pattern where the price is moving within parallel downward-sloping trendlines. In this case, the sell side implies that Bitcoin's price is expected to keep moving downward, adhering to the top line (resistance) and bouncing between the resistance and the lower support line.
2. Key Levels:
High Support (85,000): This suggests that Bitcoin has a significant support zone around the $85,000 price level. If Bitcoin reaches this level, there is likely to be buying pressure or a price bounce.
Sell Target (74,000): Your target suggests that you expect Bitcoin to drop to the $74,000 level, which would likely represent the lower boundary of the descending channel or a previous support zone.
3. Price Action Within the Channel:
If Bitcoin's price is currently within the descending channel and testing the upper resistance, traders might look for short opportunities (sells) at or near the resistance level.
The 85,000 support level could be tested again. If Bitcoin bounces off that level, the downtrend may continue, pushing the price toward the 74,000 target.
If Bitcoin breaks the 85,000 support, a deeper decline could be in the cards, and the sell target of 74,000 may need to be adjusted.
4. Potential Indicators to Watch:
Volume: Pay attention to volume, especially if Bitcoin approaches the 85,000 support level. A low-volume bounce may indicate a short-term relief rally before the next leg down.
RSI: The Relative Strength Index (RSI) can provide insights into whether Bitcoin is oversold or overbought, helping to confirm or challenge the trend within the descending channel.
MACD: A bearish crossover on the MACD can confirm downward momentum, reinforcing the sell setup toward your target of 74,000.
5. Risk Management:
As this setup involves selling in a descending channel, ensure you set stop-loss orders just above the resistance or the 85,000 level to protect against a reversal.
Adjust your stop-loss based on the price action in relation to the channel’s boundaries.
Conclusion:
Sell if Bitcoin reaches or tests the upper resistance in the descending channel (around 85,000).
Target 74,000 as the downside support.
Watch for volume, RSI, and MACD indicators to confirm the continuation of the downtrend or a potential reversal.
Would you like a more detailed chart or analysis using historical data to refine this strategy further?

BITCOIN Are we back in business?Bitcoin (BTCUSD) made a miraculous comeback yesterday as it rebounded with force almost +12% from its session Low, following the 90-day tariff pause news. This rebounded has been performed on both the 1W MA50 (blue trend-line), which has been the key long-term Support of this Bull Cycle, but also on the previous High line, which is the trend-line coming from the previous Higher High of the Bull Cycle that has now turned Support.
As you see, during every Bull Cycle correction, this previous High line held both times before and it is doing so this time also. This justifies the incredible symmetry of this Bull Cycle but it doesn't only stop on the uptrend structure but goes back to the downtrend structure of the Bear Cycle. As you see, the extension of those previous High lines intersect the Lower Highs of the Bear Cycle. Symmetry at its very best.
At the same time, back to the current Bull Cycle, we see that the Vortex Indicator (VI) has already diverged, which has been consistent to both previous bottoms.
As far as what the target of this potential rebound/ rally can be, both previous main rallies hit at least the 1.618 Fibonacci extension. That sits now at $175000.
So do you think this Double Support rebound combo is putting BTC back in Bull Cycle business for a rally to $175k? Feel free to let us know in the comments section below!
-------------------------------------------------------------------------------
** Please LIKE 👍, FOLLOW ✅, SHARE 🙌 and COMMENT ✍ if you enjoy this idea! Also share your ideas and charts in the comments section below! This is best way to keep it relevant, support us, keep the content here free and allow the idea to reach as many people as possible. **
-------------------------------------------------------------------------------
💸💸💸💸💸💸
👇 👇 👇 👇 👇 👇

CRO - Building Block!Hello TradingView Family / Fellow Traders. This is Richard, also known as theSignalyst.
Let’s keep it simple!
📈 Short-Term Bullish:
CRO is currently hovering around a key weekly support level. As long as the $0.07 support holds, we can look for short-term long opportunities.
With bullish momentum picking up, the next target/resistance is around $0.11 (marked in blue).
🚀 Long-Term Bullish:
For the bulls to fully take control and aim for the next major resistance at $0.163 (marked in red), a confirmed breakout above the $0.115 level is needed.
📚 Always follow your trading plan regarding entry, risk management, and trade management.
Good luck!
All Strategies Are Good; If Managed Properly!
~Rich

Bear Pattern Often Would Spike One More Time The swings of the week so far have created a giant pending butterfly- which may be the most important setup we've seen in SPX for a long long time - certainly the most important during this drop.
A butterfly here in its book context is a bearish pattern, but if you follow my work you'll know I always say harmonics are binary decision levels. If they work, the accurately forecast the reversal zone and then often the implied swing to follow- when they fail, they tend to indicate strong moves in the other direction.
Off a setup like this, a failure of the butterfly would be failure of the downtrend.
A successful butterfly would be a failure of the bigger overall uptrend.
It's a high stakes moment.
But bears should be aware we could be 98% right here and still face a brutal stop run.
Protecting profits from higher entries now. Ideally want to size up into a spike.

Bitcoin at $83K – Is This the Calm Before the Next Surge or a TrBTC/USD Daily Technical Outlook – April 9, 2025
Bitcoin is currently consolidating just below the psychological $85,000 level after a historic bull run that pushed price to fresh all-time highs. The market is cooling off — not crashing — with price action forming a high-tight flag, often a continuation signal after a vertical move.
However, with momentum slowing and volatility compressing, traders must prepare for a major breakout or breakdown in the coming days.
📈 Trend Structure:
BTC/USD remains in a strong bullish trend. Since the breakout above $69,000 (previous ATH from 2021), the rally has been aggressive and directional — barely giving bears a chance to breathe.
Price has formed a series of higher highs and higher lows, respecting a steep ascending trendline since early February. But now, the pair is coiling near the highs, forming a tight range between $80,000 and $83,500.
🔹 Key Resistance Zones:
$83,500 – $85,000: Immediate resistance; this area has capped price multiple times in recent sessions. A daily close above this zone could trigger the next leg higher.
$88,000: Near-term bullish target based on measured move from recent consolidation.
$90,000 – $92,000: A psychological milestone — and a possible magnet for price if bulls break out cleanly.
🔸 Key Support Zones:
$80,000: Round number support — the floor of the current consolidation.
$76,500: Previous breakout zone and minor demand area.
$72,000 – $74,000: Major support and ideal re-test level if BTC corrects — where many sidelined bulls are likely waiting to buy in.
📐 Technical Pattern:
Bitcoin is forming a high-tight flag — a bullish continuation pattern typically found after strong vertical rallies. The range is tightening, volume is dropping, and volatility is compressing — classic signs that a volatility expansion is coming soon.
A breakout above $83,500–85,000 would confirm the flag and likely ignite a sharp move to FWB:88K or higher. On the flip side, a breakdown below $80K could send price to retest $76.5K or even $74K — which would still be healthy within the broader trend.
🧭 Scenarios to Watch:
✅ Bullish Scenario:
A breakout and daily close above $85,000 would confirm the continuation pattern, targeting $88,000 first, then $90,000+. Volume and candle structure will be key to confirming the move.
❌ Bearish Scenario:
If price fails to break out and instead drops below $80,000, a correction could unfold toward $76,500 or even $74,000 — presenting a potential re-entry opportunity for long-term bulls.
📌 Conclusion:
Bitcoin is trading near all-time highs in a classic consolidation phase. Price action favors the bulls, but the breakout hasn’t confirmed — yet. Whether BTC breaks above $85K or drops below $80K will likely define the next major swing.
As always, let the candles tell the story — and don’t chase, wait for confirmation.
💬 Are we about to see Bitcoin above $90K? Or is this distribution in disguise? Drop your thoughts 👇

EURUSDHello Traders! 👋
What are your thoughts on EUR/USD?
EUR/USD has broken above the resistance zone and is currently trading above the breakout level.
A pullback to the broken level is expected before the next bullish move.
Once the pullback is complete, we anticipate a continuation of the uptrend toward the specified target. Holding above the broken resistance would reinforce the bullish outlook.
Will EUR/USD maintain momentum after the pullback? Share your views below!
Don’t forget to like and share your thoughts in the comments! ❤️

APPLE Best buy opportunity of the last 6 years.Back in August 02 2024 (see chart below), we introduced this model on Apple Inc. (AAPL) that had high probabilities of success at predicting Cycle peaks:
We may have not hit $280 but $260 is close enough especially if you are a long-term investor that values buying low and selling high.
Now that the price has corrected by -35% and just hit the 1M MA50 (blue trend-line) for the first time in almost 10 years (since July 2016), it is time to revisit this macro-model once again.
As you can see, -35% corrections have been present on every Cycle since the January 2009 bottom of the Housing Crisis. The pattern that the stock follows is very specific and it starts with a prolonged correction, the Bear Cycle essentially, which is a lengthy correction phase, such as the 2008 Housing Crisis, the 2015/16 China slowdown and the 2022 Inflation Crisis.
Then a very structured uptrend phase starts in the form of a Channel Up that leads the market to its first peak, followed by a shorter, quicker correction phase that tests the 1M MA50 and rebounds. The rebound is the final bull phase of the Cycle, usually strong and sharp and leads to the eventual Cycle Top and then starts then new Bear Cycle (prolonged correction).
Right now the current 4-month correction is technically, based on this model, the new shorter correction. Being more than -35% in size, the last one larger than this was the previous short correction of the last Trade War in October 2018 - January 2019 (-38%).
The similarities don't stop here but extend to the 1M RSI as well, which just entered its 25-year mega Buy Zone that has been holding since December 2000 and the Dotcom Crash! In fact the last time Apple's 1M RSI was this low was in June 2013, which was the bottom of the 1st short correction on our chart.
This remarkable symmetry just shows how similar the current phase is with its previous ones and if the symmetry continues to hold, we should be expecting a strong recovery to start. Even if the price makes a slightly deeper low as -38% (like the January 2019 bottom), we may still expect the minimum rise that it had all those years shown on the chart, +145%, which translates to a potential $390 Target long-term.
It is in times like this, that patient long-term investors filter out the news noise, make their unbiased moves and maximize their profit.
-------------------------------------------------------------------------------
** Please LIKE 👍, FOLLOW ✅, SHARE 🙌 and COMMENT ✍ if you enjoy this idea! Also share your ideas and charts in the comments section below! This is best way to keep it relevant, support us, keep the content here free and allow the idea to reach as many people as possible. **
-------------------------------------------------------------------------------
💸💸💸💸💸💸
👇 👇 👇 👇 👇 👇

#AUDCAD: Following a sell off, we might see price filling FVG. AUDCAD plummeted due to the NFP data, causing a record low price. However, it left a significant void area. The price has changed its behaviour, showing an increasing bullish presence. We only have one target where the price is likely to drop again heavily.
Good luck and trade safely. Like and comment for more!
Team Setupsfx_

XAUUSD: Investors are more interested in Gold than ever! Gold reversed successfully after touching our entry point, moving to over 1400 pips. We previously advised closing the idea, but now we see a strong bullish market likely to create another record high. The ongoing tariff war between China and the US will likely create more fear in the global market.
Like, comment, and support us.
Team Setupsfx_

US500, XAUUSD & XTIUSD Daily Trade SetupsIn this update, we review the recent price action in the US500, XAUUSD & XTIUSD and identify the next high probability trading opportunity and price objectives to target. To review today's video analysis, click here.

Gold Faces Key Resistance – Will the Uptrend Continue?📊 XAU/USD Daily Technical Outlook – April 10, 2025
Gold has recently seen a strong rally, reaching an all-time high of $3167 per ounce. However, it encountered significant resistance at the upper boundary of its ascending channel, leading to a sharp pullback after the release of strong U.S. employment data, which boosted the dollar and exerted selling pressure on gold.
Currently, gold is trading around $3050, with key support levels at $2956, $2860, and $2790, which could act as potential bounce points if the decline continues.
📈 Current Market Structure:
After reaching the all-time high, the price has corrected lower. As it approaches the support levels mentioned above, the market may see fresh buying opportunities if these levels hold strong.
🔹 Key Resistance Levels:
$3100: Immediate resistance. A break above this level could signal a resumption of the uptrend.
$3167: All-time high. A breakout above this level would open the door for further gains.
🔸 Key Support Levels:
$2956: First support. The price may bounce at this level if it holds.
$2860: Major support. A failure to hold above this level could lead to further declines.
$2790: Strong support. A drop below this level would signal a shift in the market's direction.
📐 Price Action Patterns:
As the price approaches key support levels, there could be reversal patterns forming, indicating a potential price bounce. It’s crucial to monitor the price action at these levels to spot potential entry opportunities.
🧭 Potential Scenarios:
✅ Bullish Scenario:
If gold manages to hold above $2956 and bounce, the uptrend may resume toward the resistance levels mentioned above.
❌ Bearish Scenario:
If gold fails to maintain the key support levels, the correction could continue, with further declines toward lower support levels.
📌 Conclusion:
Gold is currently testing crucial support levels. Monitoring how price behaves at these levels will be key to determining the next direction. Traders should keep an eye on any economic developments that may affect market sentiment.
💬 What’s your outlook for Gold? Will it continue its uptrend or experience further corrections? Share your thoughts below.

80K pullback is done, but it is not for selling anymoreMorning folks,
So, the upside bounce to 80K resistance that we were watching is done now. It has happened even twice. D. Trump so efficiently tarrifying markets, and them provides them the relief that BTC mostly is just a hostage of this so called "news stream". Actually as well as all other markets.
Once 90 day tariffs postpone has been provided, stocks jumped and liquidity returns, supporting all other things around. It might be temporal? Sure. But nobody knows what in the old Donny's head.
By looking at current action, it seems that 80K support is more reasonable to use for long entry with 85.5 target at least. Definitely it would be better to not sell by far...

Will the explosive gold rally continue?Today's international gold is still experiencing large fluctuations under the influence of tariffs. From the sharp rise on Wednesday, we can see that the risk aversion sentiment for gold has heated up again. The current highest is 3130, which is the first target point for the rise. If it continues to rise, it can reach 3150. Therefore, there is still a lot of room above. Everyone should pay attention to trading in line with the trend as much as possible.
From a technical perspective, a towering positive line on the daily line directly changed the extremely weak adjustment state in the previous period. Now the positive line breaks through the middle track of the Bollinger Bands, pulling up the moving average and increasing the volume. Then, gold has entered an extremely strong state of bullish trend. Under this state, it will continue to rise to the previous high of 3150. Therefore, the main direction today is definitely bullish.
The Bollinger Bands in the current 4-hour cycle have just opened, and the unilateral trend has just emerged from the first wave of strength. It is not a big problem for the next wave to rise to the high point of the daily cycle. Therefore, as long as the 4-hour cycle falls back to the support of the unilateral moving average, it is an opportunity to go long. The lower support is around 3070, and the rise of the hourly cycle is around 3060.
Investment strategy: Gold more than 3100, stop loss 3090, target 3150

SPY PRICE ACTION 10TH APRIL2025Spy further price action is here. I have discussed all the potential buying levels and do not go long at current price as we are into a supply zone.
Feel free to leave a comment
NOTE:WAIT AS WE ARE INTO A SUPPLY

Bitcoin H4 | Approaching an overlap supportBitcoin (BTC/USD) is falling towards an overlap support and could potentially bounce off this level to climb higher.
Buy entry is at 80,285.10 which is an overlap support that aligns with the 38.2% Fibonacci retracement.
Stop loss is at 74,000.00 which is a level that lies underneath a multi-swing-low support.
Take profit is at 88,532.50 which is a multi-swing-high resistance.
High Risk Investment Warning
Trading Forex/CFDs on margin carries a high level of risk and may not be suitable for all investors. Leverage can work against you.
Stratos Markets Limited (tradu.com):
CFDs are complex instruments and come with a high risk of losing money rapidly due to leverage. 63% of retail investor accounts lose money when trading CFDs with this provider. You should consider whether you understand how CFDs work and whether you can afford to take the high risk of losing your money.
Stratos Europe Ltd (tradu.com):
CFDs are complex instruments and come with a high risk of losing money rapidly due to leverage. 63% of retail investor accounts lose money when trading CFDs with this provider. You should consider whether you understand how CFDs work and whether you can afford to take the high risk of losing your money.
Stratos Global LLC (tradu.com):
Losses can exceed deposits.
Please be advised that the information presented on TradingView is provided to Tradu (‘Company’, ‘we’) by a third-party provider (‘TFA Global Pte Ltd’). Please be reminded that you are solely responsible for the trading decisions on your account. There is a very high degree of risk involved in trading. Any information and/or content is intended entirely for research, educational and informational purposes only and does not constitute investment or consultation advice or investment strategy. The information is not tailored to the investment needs of any specific person and therefore does not involve a consideration of any of the investment objectives, financial situation or needs of any viewer that may receive it. Kindly also note that past performance is not a reliable indicator of future results. Actual results may differ materially from those anticipated in forward-looking or past performance statements. We assume no liability as to the accuracy or completeness of any of the information and/or content provided herein and the Company cannot be held responsible for any omission, mistake nor for any loss or damage including without limitation to any loss of profit which may arise from reliance on any information supplied by TFA Global Pte Ltd.
The speaker(s) is neither an employee, agent nor representative of Tradu and is therefore acting independently. The opinions given are their own, constitute general market commentary, and do not constitute the opinion or advice of Tradu or any form of personal or investment advice. Tradu neither endorses nor guarantees offerings of third-party speakers, nor is Tradu responsible for the content, veracity or opinions of third-party speakers, presenters or participants.

GBP/USD Faces Crucial Resistance – Will the Uptrend Continue?📊 GBP/USD Daily Technical Outlook – April 10, 2025
GBP/USD is currently trading around 1.2696, facing significant resistance near the 1.2800 level. After a recent decline from the 1.3434 peak, the pair has been consolidating, forming a range between 1.2740 and 1.2860. The market's reaction to these levels will be crucial in determining the next directional move.
📈 Current Market Structure:
The recent price action indicates a neutral to bearish trend for GBP/USD. The pair has formed lower highs and higher lows, creating a symmetrical triangle pattern, suggesting indecision in the market. A breakout from this pattern, either above 1.2860 or below 1.2740, will likely set the tone for the next significant move.
🔹 Key Resistance Levels:
1.2800: Immediate resistance. A break above this level could signal a potential bullish move.
1.2860: Upper boundary of the current range. A decisive break above this level would confirm the continuation of the uptrend.
1.2933: Significant resistance zone. If the price manages to break above this level, it could lead to further gains.
🔸 Key Support Levels:
1.2740: Lower boundary of the current range. A break below this level could indicate a bearish reversal.
1.2720: Short-term support. Failure to hold above this level might lead to a deeper correction.
1.2580: Major support zone. A drop below this level would confirm a bearish trend.
📐 Price Action Patterns:
The formation of a symmetrical triangle suggests that the market is awaiting a catalyst for the next move. Traders should watch for a breakout from this pattern, as it will likely lead to increased volatility and a clear directional bias.
🧭 Potential Scenarios:
✅ Bullish Scenario:
A breakout above 1.2860, especially with strong volume, could lead to a rally toward 1.2933 and potentially higher levels.
❌ Bearish Scenario:
A break below 1.2740 could trigger a decline toward 1.2720, with further downside potential if the support at 1.2580 is breached.
📌 Conclusion:
GBP/USD is currently consolidating within a defined range, with key levels at 1.2740 and 1.2860. The next significant move will depend on a breakout from this range, providing clarity on the market's direction. Traders should monitor these levels closely and prepare for increased volatility as the pair approaches these boundaries.
💬 What’s your outlook for GBP/USD? Will the pair break above 1.2860, or is a bearish reversal imminent? Share your thoughts below 👇
