US 100Nasdaq index analysis in 4 hours time frame
After losing the 4-hour support, the Nasdaq is now trying to break to the bottom to complete the second leg of its decline and fall to the bottom of the 4-hour channel.
Index

GBPCAD Long For Scalpers and Day TradersGuys pls keep this pairs in to your watchlist dont jump in to the trade immediately since
market is very volatile and you will hit the stop loss and one more reason this pairr didn't
take the proper pullback pls be cautious.
Thats the reason I have not given your entry andd stoploss once I get some more data I wil update the same.
Guys Please like and follows to my ideas in order to give free premium calls
Thank You

DOLLAR_INDX,DXY H4 4 March 2024DOLLAR_INDX, H4
The Dollar Index faced a decline last Friday as the market's risk sentiment underwent a shift.
Discouraging ISM manufacturing PMI readings weighed on the dollar, prompting investors to sell the currency and turn their attention to riskier assets. Throughout the upcoming week, several members of the Federal Reserve are scheduled to deliver speeches. These addresses are anticipated to provide insights into the Fed's potential monetary moves, influencing the trajectory of the dollar's strength.
The Dollar Index has declined but has found support at near 103.85, suggesting the bullish trend remains intact. Suggesting a neutral signal for the dollar index.
Resistance level: 104.50, 104.95
Support level: 103.70, 102.90


DXY Will Go UP! Buy!
Hello,Traders!
DXY is about to retest
The rising support line
From where I would be
Expecting a bullish rebound
And a local move up
Buy!
Like, comment and subscribe to help us grow!
Check out other forecasts below too!

Price overextension: misconceptions and common mistakesPrice overextension remains a widely misunderstood concept in trading, causing both novice and seasoned traders to make errors in their decision-making. This misinterpretation often leads to placing trades in the wrong direction or, equally detrimental, overlooking profitable opportunities.
In essence, price overextension signifies that the market has undergone a rapid and excessive movement in one direction. Such movements are often perceived as unsustainable. Numerous indicators, such as Stochastic, RSI, Bollinger Bands and many other, attempt to identify such "abnormal" price movements so traders could capitalize on them. Despite variations in statistical methods and calculations, their common goal is to detect instances where price went or down too much and is likely to reverse.
In this discussion, I will use Relative-Strength-Index (RSI), a popular indicator, to convey my perspective on price overextension. While some traders argue for customization, the elusive question of "how" often remains unanswered. From my experience, there are no universally perfect settings that consistently yield optimal results.
I’ll draw my examples from the recent SPY bar chart (February 2024).
The first misconception
The first misconception is that if price is overextended it is time to immediately start looking for a trade in the opposite direction. The most important phrase here is “start looking”. Many beginners misinterpret this as an invitation to commence trading, leading to the premature initiation of short positions during perceived market "overextension" and vice versa.
So, the first and foremost important advice is to never try guessing top/bottom based on one indicator or gut feeling. Simple as it seems I remember many times breaking this rule myself because the temptation was too strong. It rarely ended up well.
On the graph, I've highlighted three recent instances where the RSI exceeded 70 (indicating overbought conditions). What stands out is that, following each occurrence, the price surged significantly before consolidation set in, inflicting losses upon short traders.
Even experienced traders, who look for confluence of signals, may fall into this trap. In the first two examples, bearish candlestick patterns failed to prevent subsequent price increases. Most likely, those candles were “created” by weak hands traders, who tried to short market, while it was actually controlled by strong buyers.
These instances could have been avoided by considering the daily graph, revealing a robust bullish context – price was in an uptrend, one-time-framing up on weekly. There were couple of moments when bears gained short term control (Tuesdays 13th and 20th) but they never could take the previous week low; bulls always confirmed their control.
The second advice is to avoid trading against higher level context. While sometimes those trades might work the result is usually mediocre and most of the times you’ll simply lose. If you really wish to trade against context you need to construct a solid dossier of evidence, supporting your trade.
The second misconception
What is the second misconception? It is that when price overextended it is not time to go with the market. In this scenario, traders refrain from initiating long trades after RSI indicates overbought conditions, potentially causing them to miss profitable opportunities. It might not hurt your account but who likes missing good opportunities?
Surprisingly, seizing these trades correctly is not much harder than any other trade. It simply requires prudence and discipline and getting rid-off cognitive biases. For example, in the second example on the graph a trader could win up to 1% if he played off gap-up open after seeing that the new price has found acceptance.
Conclusion
It is possible to build a profitable strategy that relies on “price overextension” concept. However, it demands more than a cursory examination of a single indicator and adherence to textbook candle patterns. Personally, I reached a point where I entirely abandoned the use of RSI and similar tools because, instead of providing clarity, they seemed to cloud my thinking.
Opting for a more effective approach involves keenly observing actual market behavior, which often defies conventional expectations. Study of high-level contexts, understanding key levels, and discerning confluence in price action signals on lower timeframes consistently prove invaluable. This method helps steer clear of common pitfalls and contributes to enhancing overall trading results.

✅DXY POTENTIAL LONG🚀
✅DXY is trading along the rising support
And as the index will soon retest it
I am expecting the price to go up
To retest the supply levels above around 104.046
LONG🚀
✅Like and subscribe to never miss a new idea!✅

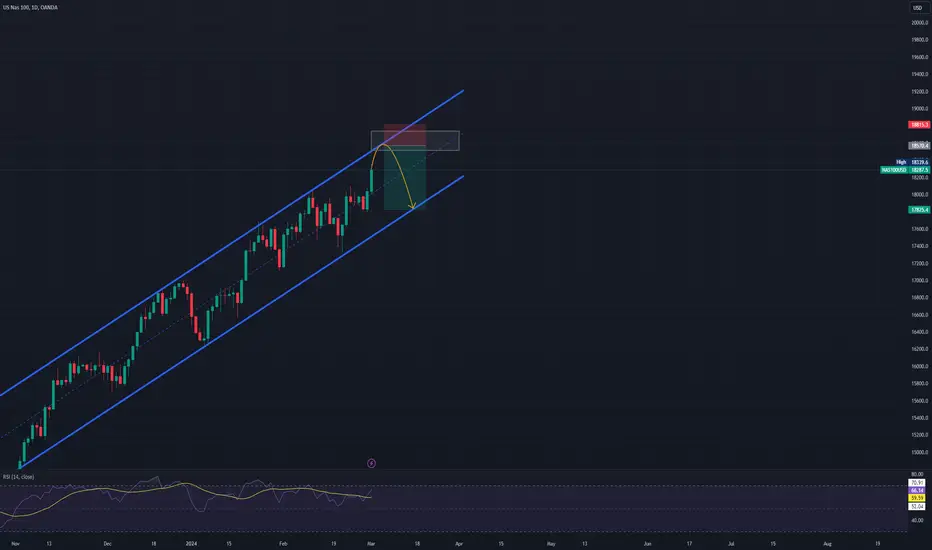
Strong Bullish Trend Continues for US NAS 100The US NAS 100 has shown strong upside potential in a channel-like pattern on the daily chart. We expect it to smoothly rise towards the top of the channel and after reaching the channel roof, experience a slight downtrend towards the bottom of the channel. 📈📉
VIX Risky Long From Rising Support! Buy!
Hello,Traders!
VIX fell down sharply
And is down by almost 20%
From the recent major high
So the index is clearly oversold
Therefore, we will be expecting
A local bullish correction
From the rising support below
Buy!
Like, comment and subscribe to help us grow!
Check out other forecasts below too!

DAX: Next week could be the top. Downside more than -6% possibleDAX is approaching the 16 month HH Zone while being vastly overbought on the 1D timeframe (RSI = 76.873, MACD = 201.900, ADX = 41.880). The 1D CCI shows that we may be entering a period of volatility similar to what followed after the May 19th 2023 High, which initially resulted into a -6.42% correction. Based on that, our bearish target is near the S1 level (TP = 16,850).
## If you like our free content follow our profile to get more daily ideas. ##
## Comments and likes are greatly appreciated. ##

NASDAQ: Channel Up peaked. Correction needed.Nasdaq is forming a new HH at the top of the 1 year Channel Up with the 1W timeframe overbought technically (RSI = 70.596, MACD = 766.660, ADX = 46.154) and the RSI in particular under LH and inside the red Resistance Zone. This is a bearish signal, validation would come upon a 1D MA50 bearish crossing. Our target is the 1D MA100 (TP = 16,850).
## If you like our free content follow our profile to get more daily ideas. ##
## Comments and likes are greatly appreciated. ##

EICHER Motors is around Long term support Eicher Motors is around the medium term support !!
Stock has never broken support working from 2020
Log Chart support is working beautifully and has support around 3500-3600
On a Linear Chart stock has made 2 support and recently short term support working
Linear chart support is around 3480-3520 !!
Stock is Goof until support is intact !!
Thanks !!
Disclaimer : We are not SEBI registered analyst. Do your own research before taking any investment decision.

dxy bullish structure 🐂🚀ℹ️ In the previous week, I anticipated a greater retracement in the dollar index, but it retraced less and is now poised for another upward move. The targets for this upward movement could be 104.976 and 105.360 . 🐂🆙

DXY Head and Shoulder Pattern 4HDXY Head and Shoulder Pattern 4H
Possible formation of a head and shoulders pattern on the 4H timeframe.
Pattern is a reversal pattern, could possibly break the 4H trendline to continue the daily timeframe downtrend. Would be looking for shorts from the 50% to 61.8% Fib levels.
Further confluence is the RSI showing now entering overbought levels on the 4H timeframe.
If price breaks past the previous lower high on the 4H timeframe, trade will become invalid.
Like and comment if you agree.

Mr. Double Top is that you?Following a contracting triangle breakout today, NIFTY zoomed up with a fair amount of pull backs which denote more than just a regular retracement. Over a larger time frame, one can observe NIFTY ultimately forming lower highs since it made the last all time high. Today, near the closing bell NIFTY made a double top and slipped down from what one would consider a healthy retracement. These sharp pull backs show the power of bears to cause a dip and trap for buyers hoping a fresh bull run.
However, patterns can break so keeping in mind the risks you should not stick to any particular pattern assuming the holy grail to market formations. On the right axis is Fibonacci retracements we can observe if a sharp fall occurs if the double top pattern holds true.


Beating the S&P500 (SPX) Buy&Hold strategy by 16 timesS&P500 (SPX) strategy using Stochastic RSI Min-Max, normalized Volatility and Trailing Stop signals, beats the Buy&Hold strategy by 16 times
Embarking on the quest to time the market accurately, the 'Holy Grail' of strategies, led me to create a script to approach this goal. Unlike other strategies that I tested, this one not only surpasses the long-term S&P500 Buy&Hold approach but does so by a remarkable 16.38 times!
Initially, I employed an A.I. program based on an LSTM Neural Network using TensorFlow. Despite achieving a 55% next-day prediction accuracy for short/long positions, I sought improvement using a heuristic pine-scripting approach, incorporating stochastic RSI oscillators, moving averages, and volatility signals.
With default parameters, this strategy, freely available as "XPloRR S&P500 Stock Market Crash Detection Strategy v2" delivered a staggering 2,663,001% profit since February 1871. In the same period, the Buy&Hold strategy "only" generated 162,599% profit. Picture this: a $1,000 investment in 1871 would now be worth $26,630,014 by February 2024. Check it out for yourself loading this strategy.
The script operates as a Stochastic RSI Min-Max script, automatically generating buy and sell alerts on the S&P500 SPX. What sets it apart? The strategy detects "corrections," minimizes losses using Trailing Stop and Moving Average parameters, and strategically re-enters the market after detecting bottoms using tuned Stochastic RSI signals and normalized Volatility thresholds.
Tailor its parameters to your preference, use it for strategic exits and entries, or stick to the Buy&Hold strategy and start new buy trades at regular intervals using buy signals only. In the pursuit of minimizing losses, the script has learned the effectiveness of a 9% trailing stop on trades. As you can clearly see on the upper graph (revolving around 100), the average overall green surfaces (profits) of all trades are much bigger than the average red surfaces (losses). This follows Warren Buffets first rule of trading to "Never lose money" and thus minimizing losses.
Update: Advanced S&P500 Stochastic RSI Min-Max Buy/Sell Alert Generator
I have also created an Alerter script based on the same engine as this script, which auto-generates buy and sell alert signals (via e-mail, in-app push-notifications, pop-ups etc.).
The script is currently fine-tuned for the S&P500 SPX tracker, but parameters can be fine-tuned upon request for other trackers or stocks.
If you are interested in this alerter-version script or fine-tuning other trackers, please drop me a message or mail xplorr at live dot com.
How to use this Strategy?
Select the SPX (S&P500) graph and set the value to "Day" values (top) and set "Auto Fit Data To Screen" (bottom-right).
Select in the Indicators the "XPloRR S&P500 Stock Market Crash Detection Strategy v2" script and set "Auto Fit Data To Screen" (bottom-right)
Look in the strategy tester overview to optimize the values "Percent Profitable" and "Net Profit" (using the strategy settings icon, you can increase/decrease the parameters).
How to interpret the graphical information?
In the SPX graph, you will see the Buy(Blue) and Sell(Purple) labels created by the strategy.
The green/red graph below shows the accumulated profit/loss in % of to the initial buy value of the trade (it revolves around 100%, 110 means 10% profit, 95 means 5% loss)
The small purple blocks indicate out-of-trade periods
The green graph below the zero line is the stochastic RSI buy signal. You can set a threshold (green horizontal line). The vertical green lines show minima below that threshold and indicate possible buy signals.
The blue graph above the zero line is the normalized volatility signal. You can set a threshold (blue horizontal line) affecting buy signals.
The red graph above the zero line is the slower stochastic RSI sell signal. You can set a threshold (red horizontal line). The red areas indicate values above that threshold.
However real exits are triggered if close values are crossing below the trailing stop value or optionally when the fast moving average crosses under the slow one. The red areas above the threshold are rather indicative to show that the SPX is expensive and not ideal to enter. Please note that in bullish periods the red line and areas can stay at a permanent high value, so it is not ideal to use as a strict sell signal. However, when it drops below zero and the green vertical lines appear, these are strong buy signals together with a high volatility.
These Parameters can be changed
Buy Stochastic Lookback
Buy Stochastic Smoother
Buy Threshold
Buy Only After Fall
Minimum % Fall
Sell Stochastic Lookback
Sell Stochastic Smoother
Sell Threshold
Sell Only With Profit
Minimum % Profit
Use Sell MA
Fast MA Sell
Slow MA Sell
MA Sell Threshold
Use Buy Volatility
Volatility Smoother
Volatility Threshold
Use Trailing Stop
Use ATR (iso of a fixed percentage for the trailing stop)
ATR Lookback
Trailing Stop Factor(or fixed percentage if "use ATR" is false)
Trailing Stop Smoother
Important : optimizing and using these parameters is no guarantee for future winning trades!

DXY - Bearish => Bullish 📈📉Hello TradingView Family / Fellow Traders. This is Richard, also known as theSignalyst.
📉 As per my last analysis, attached on the chart, DXY rejected the upper bound of the red channel and traded lower.
Currently, DXY is hovering around the lower red trendline acting as a non-horizontal support.
📈 For the bulls to take over, and start the next impulse that would lead to 105.2, a break above the last major high in blue is required.
📉 Meanwhile , DXY would be bearish and can still break the red trendline downward, in this case a continuation till the 103.0 support would be expected.
📚 Always follow your trading plan regarding entry, risk management, and trade management.
Good luck!
All Strategies Are Good; If Managed Properly!
~Rich

S&P500: 1W MACD about to make a Bearish Cross. Huge sell signal.The S&P500 is on the second straight bearish 1W candle and if the week closes this way, it will be the first series of red 1W candles since the October 23rd 2023 bottom. The 1D timeframe has already turned neutral (RSI = 51.449, MACD = 32.820, ADX = 32.340) after a prolonged period inside the overbought territory, so we can claim that a medium term correction has started. A 1W MACD Bearish Cross will confirm it, as it has been the single most major long term sell signal in the past 1.5 years.
The last 1W MACD Bearish Cross was formed after the August 14th 2023 1W candle and the then declined by -8.58% initially to reach the 1W MA50 and then completed a -10.90% decline to form a HL at the bottom of the Channel Up. -8.00% and -9.00% corrections have been common on MACD Bearish Crosses. In any case, this indicates that the S&P500 can drop to 4,650 (-8.00%) in order for the market to see if the 1W MA50 can hold as a long term Support after an incredible 4 month rally.
See how our prior idea has worked out:
## If you like our free content follow our profile to get more daily ideas. ##
## Comments and likes are greatly appreciated. ##

DXY Will Go UP! Buy!
Hello,Traders!
DXY is trading along the
Rising support line
And the index will soon
Retest is so after the
Retest we will be expecting
A further move up
Buy!
Like, comment and subscribe to help us grow!
Check out other forecasts below too!

Nasdaq 4 hour = mini crashI predict Nasdaq will go to Fino 64% , strongly advice put SELLSTOP in last low 17544 ( break it mean down trend will start)
save in mind.long term = Nasdaq weekly chart target is 21000 so be carefull from sell(use 50% low size)
only for Nasdaq and gold =keep monitor AC indicator on daily chart
can Nasdaq go upper? yes if last high 1873 break ,up trend can continue, so 100% put sl on last high
wish you big,stable profit

DAX: Market Top is being formed. DAX hit the HH trendline on a bullish 1D technical outlook (RSI = 59.185, MACD = 53.000, ADX = 25.248) but a Bearish Divergence RSI. The 1D CCI is repeating the May 19th-July 31st 2023 successive peak pattern on the HH that eventually corrected first to the 0.382 Fibonacci level and the 1D MA200 and then under the 0.618 Fibonacci level. Consequently, a crossing under the 1D MA50 will be the ideal sell signal to target the S1 level (TP = 16,350).
## If you like our free content follow our profile to get more daily ideas. ##
## Comments and likes are greatly appreciated. ##

DXY - Over-Bought Zone ❗️Hello TradingView Family / Fellow Traders. This is Richard, also known as theSignalyst.
📈 DXY has been overall bullish , trading within the rising wedge pattern in red.
At present, DXY is approaching the upper red trendline acting as a non-horizontal resistance.
Moreover, it is retesting a strong resistance zone marked in green.
🏹 Thus, the highlighted red circle is a strong area to look for sell setups as it is the intersection of the green resistance and upper red trendline.
📚 As per my trading style:
As #DXY is around the red circle zone, I will be looking for bearish reversal setups (like a top bottom pattern, trendline break , and so on...)
📚 Always follow your trading plan regarding entry, risk management, and trade management.
Good luck!
All Strategies Are Good; If Managed Properly!
~Rich

DXY / 4H / TECHNICAL ANALYSIS TVC:DXY I have set my goal on the chart.
Like and comment if you find value in our analysis.
Feel free to post your ideas and questions at the comments section.
Good luck
