USDJPY - Already Over-Sold!Hello TradingView Family / Fellow Traders. This is Richard, also known as theSignalyst.
📈USDJPY has been overall bearish trading within the falling wedge pattern marked in blue and it is currently hovering around the lower bound of it.
Moreover, the orange zone is a strong weekly support.
🏹 Thus, the highlighted blue circle is a strong area to look for buy setups as it is the intersection of support and lower blue trendline acting as a non-horizontal support.
📚 As per my trading style:
As #USDJPY approaches the blue circle zone, I will be looking for bullish reversal setups (like a double bottom pattern, trendline break , and so on...)
📚 Always follow your trading plan regarding entry, risk management, and trade management.
Good luck!
All Strategies Are Good; If Managed Properly!
~Rich
Disclosure: I am part of Trade Nation's Influencer program and receive a monthly fee for using their TradingView charts in my analysis.
Long!!!!

HelenP. I Euro may decline to support zone and then start growHi folks today I'm prepared for you Euro analytics. After a prolonged sideways movement and an extended period of uncertainty, price has finally shifted gears. The pair, which had been trading inside a broad consolidation range, has recently demonstrated a clear bullish structure with strong upward momentum. The initial push started from the 1.0350 - 1.0400 support zone, where the price reacted several times, forming a solid base. From that point, bulls gradually gained control, leading to a breakout above both the upper consolidation boundary and the trend line. Following the breakout, the price surged through the next major support area around 1.0850 points, confirming the continuation of the bullish cycle. After this impulse, the Euro paused briefly around 1.1250 - 1.1300, establishing a new support zone before making another push higher. This new structure has now become a key area of interest, as price is currently testing it again from above. Now EUR is trading near 1.1330 points, within a tight consolidation that formed after touching the 1.1500 resistance. I expect that URUSD will undergo a temporary correction toward the support zone, followed by a continuation of the upward movement. My target remains at 1.1500, where the price may meet resistance once again. If you like my analytics you may support me with your like/comment ❤️

Euro may rebound from support line of wegde and continue growHello traders, I want share with you my opinion about Euro. For a while, price was consolidating in a flat range, bouncing between support near 1.0735 and resistance close to 1.0950 points. The price showed multiple rejections from the buyer zone, indicating strong interest from bulls around that area. Eventually, this led to a breakout to the upside, accompanied by a sharp impulse movement. After the breakout, the pair formed a steady upward wedge pattern, where both support and resistance lines were respected. This pattern helped channel the bullish pressure, allowing the price to gradually push higher while also offering clear correction zones. One of those zones, the support area, is particularly important. Price bounced off this area again recently, signaling that buyers are still in control. The market is currently recovering from a local correction and showing early signs of continued growth, as visible from the bounce off the wedge's support line and the area around the current support level. Given this structure, the breakout from range, the formation of the wedge, and the consistent support reaction, I expect the Euro may to continue its movement upward. So, that's why I set my TP at 1.1550 points. Please share this idea with your friends and click Boost 🚀

Bitcoin can make small correction and then continue to growHello traders, I want share with you my opinion about Bitcoin. Earlier, the price of price was consolidating for quite some time inside a broad upward wedge. The market found consistent support near the buyer zone, forming a solid foundation for future growth. After several rebounds, the bulls pushed BTC higher, and the pair exited the support area with a clean breakout. The movement above the current 86000 support level was accompanied by a strong bullish impulse, confirming the breakout from the wedge and validating the upward momentum. The price respected the structure of the wedge well, reacting to both the resistance and support lines along the way. After the breakout, Bitcoin reached a new high near 94000, where it turned around slightly, indicating the beginning of a local correction. Now BTC is hovering just above the broken wedge, and I believe a short-term decline, likely before continuing further upward. Given the wedge's structure, the bounce from the buyer zone, and the breakout with confirmation, I remain bullish on Bitcoin. My TP1 remains at 97000 points, which corresponds to the next key resistance above the current price range. Please share this idea with your friends and click Boost 🚀

USOIL Potential UpsidesHey Traders, in today's trading session we are monitoring USOIL for a buying opportunity around 60.80 zone, USOIL is trading in an uptrend and currently is in a correction phase in which it is approaching the trend at 60.80 support and resistance area.
Trade safe, Joe.

GBPAUD Will Explode! BUY!
My dear friends,
Please, find my technical outlook for GBPAUD below:
The instrument tests an important psychological level 2.0776
Bias - Bullish
Technical Indicators: Supper Trend gives a precise Bullish signal, while Pivot Point HL predicts price changes and potential reversals in the market.
Target - 2.0844
About Used Indicators:
Super-trend indicator is more useful in trending markets where there are clear uptrends and downtrends in price.
Disclosure: I am part of Trade Nation's Influencer program and receive a monthly fee for using their TradingView charts in my analysis.
———————————
WISH YOU ALL LUCK

EURO - Price can correct to support area and then bounce upHi guys, this is my overview for EURUSD, feel free to check it and write your feedback in comments👊
After consolidating in a broad range for several weeks, Euro made a strong breakout and entered an ascending channel.
The price respected this pattern twice, forming clear support and resistance touches, and confirming trend direction.
Most recently, the Euro surged and reached the upper boundary of the new rising channel, but quickly pulled back.
Currently, it’s testing the $1.1380 support area, which also aligns with the channel base, creating a confluence zone.
Given this context, I anticipate a bounce from this support and continuation of bullish structure toward $1.1670
This level represents the channel top and may act as the next key resistance zone.
If this post is useful to you, you can support me with like/boost and advice in comments❤️

US100 - Corrective Pullback into FVG + Golden Pocket setup?This 1H Nasdaq chart paints a classic structure of retracement within a bullish leg, offering potential for continuation after a clean corrective move into inefficiency. It's all about balance restoration before the next impulse.
---
1. Resistance Reaction & Local Distribution
Price faced strong rejection at a clearly defined Resistance Zone , marking a point of supply where sellers stepped in with aggression.
- The sharp rejection indicates profit-taking from earlier longs or a short-term distribution zone.
- Structure is transitioning from impulsive to corrective, suggesting a pullback is unfolding rather than a trend reversal (at least for now).
---
2. Short-Term Demand Zone Holding Price (Gray Box)
Before reaching deeper liquidity, price is hovering above a local demand block —a previously unmitigated consolidation that supported the last push up.
- This gray zone may provide temporary support, but lacks depth of imbalance.
- It's a weak floor, and smart money typically seeks deeper fills for proper re-accumulation.
---
3. Fair Value Gap Below (Primary Draw on Liquidity)
The key area of interest lies just below, where a clean Fair Value Gap (FVG) is formed. This imbalance represents a void in price action where buy-side inefficiency remains.
- Aligned with the 0.618–0.65 Fibonacci retracement range (confluence entry).
- Price is likely to seek this inefficiency for proper rebalancing.
- It’s not just a “fill the gap” play—it’s a liquidity grab where smart money is most likely waiting.
This zone is ideal for reaccumulation before resuming the move higher.
---
4. Internal Structure Suggests Bullish Intent After Fill
Price is forecasted to:
- Step 1: Break beneath the short-term demand to draw in liquidity
- Step 2: Tag the FVG zone, tapping into fresh demand
- Step 3: Shift structure via higher low formation and breakout
This is the behavior of an engineered retracement—not panic selling.
---
5. Macro Bias Still Bullish – Controlled Pullback
While the short-term price action looks bearish, the context remains supportive of upward continuation:
- No signs of aggressive selling below structure
- Current flow is corrective, not distributive
- FVG zone is strategically placed in alignment with optimal trade entry levels (OTE)
If this zone holds, expect a return to bullish expansion targeting inefficiencies left behind on the push down.
---
Conclusion:
This setup is textbook:
- Efficient rejection at resistance
- Controlled retracement into FVG with Fibonacci confluence
- Potential structural shift post-rebalance
Watch for bullish intent to return once the imbalance is filled. Until then, this is not a breakdown—it's a setup.

GOLD SENDS CLEAR BULLISH SIGNALS|LONG
GOLD SIGNAL
Trade Direction: long
Entry Level: 3,299.27
Target Level: 3,358.08
Stop Loss: 3,259.94
RISK PROFILE
Risk level: medium
Suggested risk: 1%
Timeframe: 1h
Disclosure: I am part of Trade Nation's Influencer program and receive a monthly fee for using their TradingView charts in my analysis.
✅LIKE AND COMMENT MY IDEAS✅

USD/CHF BULLISH BIAS RIGHT NOW| LONG
Hello, Friends!
The BB lower band is nearby so USD/CHF is in the oversold territory. Thus, despite the downtrend on the 1W timeframe I think that we will see a bullish reaction from the support line below and a move up towards the target at around 0.814.
Disclosure: I am part of Trade Nation's Influencer program and receive a monthly fee for using their TradingView charts in my analysis.
✅LIKE AND COMMENT MY IDEAS✅

RUSSEL / IWM IDEAovernight bounce off 15m demand im sized im very lightly due to it being an over night trade (I have a high loosing percentage trading Asia Session.) Simple play if volatility can kick in towards London/NY session. No PT if this starts working, I will just let it run until 5m structure is broken.

ATOMUSDT Potential UpsidesHey Traders, in today's trading session we are monitoring ATOMUSDT fora buying opportunity around 4.30 zone, ATOM is trading in an uptrend and currently is in a correction phase in which it is approaching the trend at 4.30 support and resistance area.
Trade safe, Joe.

Recovery or Rejection for $LRCX?🚨 Recovery or Rejection for NASDAQ:LRCX ?
Lam Research is up 10%+ on strong earnings & guidance—but it’s testing a key S/R zone!
🔹 Bullish above $76.70—watch for momentum 🚀
🔹 Bearish if rejected—potential pullback 📉
Big move incoming—what’s your read? 👀

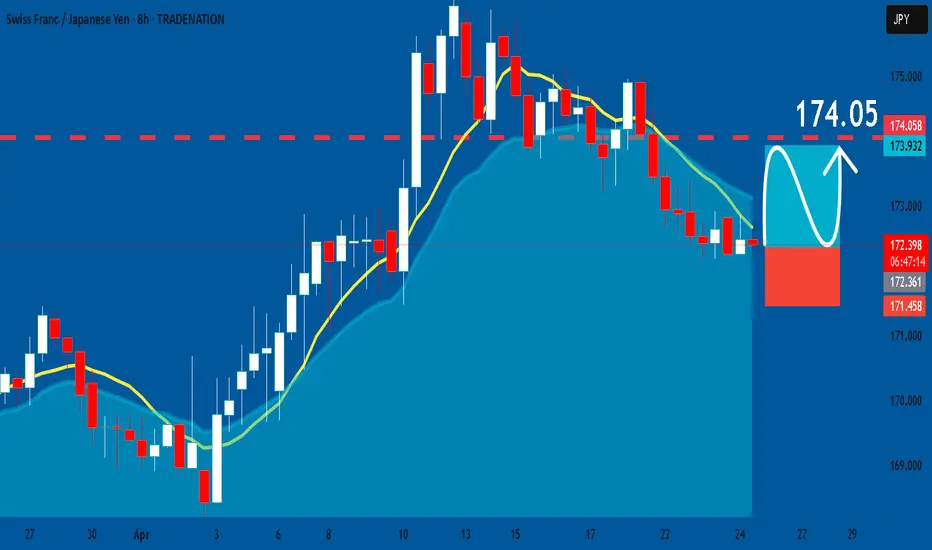
CHFJPY: Long Trade with Entry/SL/TP
CHFJPY
- Classic bullish pattern
- Our team expects retracement
SUGGESTED TRADE:
Swing Trade
Buy CHFJPY
Entry - 172.36
Stop - 171.45
Take - 174.05
Our Risk - 1%
Start protection of your profits from lower levels
Disclosure: I am part of Trade Nation's Influencer program and receive a monthly fee for using their TradingView charts in my analysis.
❤️ Please, support our work with like & comment! ❤️
EURUSD: Will Start Growing! Here is Why:
The recent price action on the EURUSD pair was keeping me on the fence, however, my bias is slowly but surely changing into the bullish one and I think we will see the price go up.
Disclosure: I am part of Trade Nation's Influencer program and receive a monthly fee for using their TradingView charts in my analysis.
❤️ Please, support our work with like & comment! ❤️

ETHUSD Will Go Up From Support! Long!
Take a look at our analysis for ETHUSD.
Time Frame: 8h
Current Trend: Bullish
Sentiment: Oversold (based on 7-period RSI)
Forecast: Bullish
The market is testing a major horizontal structure 1,754.52.
Taking into consideration the structure & trend analysis, I believe that the market will reach 1,966.56 level soon.
P.S
Overbought describes a period of time where there has been a significant and consistent upward move in price over a period of time without much pullback.
Disclosure: I am part of Trade Nation's Influencer program and receive a monthly fee for using their TradingView charts in my analysis.
Like and subscribe and comment my ideas if you enjoy them!

Coinbase Bullish/Bearish?Coinbase moves in line with cryptocurrencies and their trading volume. As we anticipate a potential upward trend, the volume is increasing, which is a positive sign for Coinbase. Currently, like many other cryptocurrencies, we are at a resistance level and are waiting for a breakout. If the breakout is successful, short-term targets between $220 and $250 are realistic. Should we break through the $250 level, further price targets in the range of $500 to $600 could be expected.

DXY Is Bullish! Buy!
Please, check our technical outlook for DXY.
Time Frame: 15m
Current Trend: Bullish
Sentiment: Oversold (based on 7-period RSI)
Forecast: Bullish
The price is testing a key support 99.109.
Current market trend & oversold RSI makes me think that buyers will push the price. I will anticipate a bullish movement at least to 99.404 level.
P.S
Overbought describes a period of time where there has been a significant and consistent upward move in price over a period of time without much pullback.
Disclosure: I am part of Trade Nation's Influencer program and receive a monthly fee for using their TradingView charts in my analysis.
Like and subscribe and comment my ideas if you enjoy them!

USD/CAD BUYERS WILL DOMINATE THE MARKET|LONG
Hello, Friends!
We are now examining the USD/CAD pair and we can see that the pair is going down locally while also being in a downtrend on the 1W TF. But there is also a powerful signal from the BB lower band being nearby indicating that the pair is oversold so we can go long from the support line below and a target at 1.387 level.
Disclosure: I am part of Trade Nation's Influencer program and receive a monthly fee for using their TradingView charts in my analysis.
✅LIKE AND COMMENT MY IDEAS✅

Adobe: Trend started in Feb 2016, revisiting the trend Possible break down to $282 or if the trend hold, shoots to the upside. Possible earnings catalyst or tariff relief.

Daily BTC OverviewThe daily chart in its simplest form can be broken down into this range. Since President Trumps inauguration, BTC has declined from a range high of $108,000 back to the lows of $74,500 closing the FVG caused by the US election rally. After a double bottom Bitcoin mean reverted back to the range midpoint which to me is the most important area on the entire chart because it decides if the bull run can continue or if it dies.
I like to keep a close eye on the 200 EMA on multiple timeframes but the 1D is important to gauge the momentum of the move. As the US election results came in a massive push away from this moving average causes the level to steepen in its climb showing strength. Since BTC spent quite some time in the top half of the range the 1D 200 EMA flattens out signaling a loss of momentum, once this level does become flat it no longer provides support. For a bullish cycle to be just that ideally the corrective moves do not spend too much time below this level before expanding above and beyond it once again starting the next leg of the move. A persistent move down below causes a rollover and the cycle looks to be over with a bear market beginning.
Bullish scenario - The correction is over and BTC consistently posts HH's & HLs bringing the 1D 200 EMA up with price and continues the previous bullish trend. I would want to see the retest of the midpoint be successful and then move to reclaim the next local high before targeting range high. The bull market correction looks to be over and bullish continuation resumes.
Bearish scenario - This move is nothing more than a LH, BTC wicks the supply above midpoint, swing fails back under and continues to make LH's & LL's back down to range low where the 1D 200EMA will have now rolled over providing more of a resistance level. The bear market looks to have begun.
I am not here to make a call on where BTC is going next as I do not have that answer, but I do have to plan for each eventuality and that is what I have done here from a TA pint of view. Now it is entirely possible that Geo-political news or an exchange hack etc throws TA out of the window and I have to rethink the plan but in a strictly chart structure perspective this is how I see it.
The indicator "TRADING ENVIRONMENT+V1.0" used in the Idea post is now publicly available for use, give it a try and leave your thoughts and suggestions on the post, thank you.

doge buy midterm "🌟 Welcome to Golden Candle! 🌟
We're a team of 📈 passionate traders 📉 who love sharing our 🔍 technical analysis insights 🔎 with the TradingView community. 🌎
Our goal is to provide 💡 valuable perspectives 💡 on market trends and patterns, but 🚫 please note that our analyses are not intended as buy or sell recommendations. 🚫
Instead, they reflect our own 💭 personal attitudes and thoughts. 💭
Follow along and 📚 learn 📚 from our analyses! 📊💡"

AUDUSD Potential UpsidesHey Traders, in today's trading session we are monitoring AUDUSD for a buying opportunity around 0.63600 zone, AUDUSD is trading in an uptrend and currently is in a correction phase in which it is approaching the trend at trend at 0.63600 support and resistance area.
Trade safe, Joe.

Gold: Correction Before Another ATH?Hey Traders, in today's trading session we are monitoring XAUUSD for a buying opportunity around 3220 zone, Gold is trading in an uptrend and currently is in a correction phase in which it is approaching the trend at 3220 support and resistance area.
Trade safe, Joe.
