BTCUSDT: Another pinpoint accuracyHello traders!
In my previous analysis, i was expecting that we will see a drop from 45880 True Reversal point and it dropped from there.
It's the Magic of A1000x Fingertip strategy.
We will see lower lows in the BTC graph. The next true reversal point is 39600 and I am expecting the same pinpoint accuracy from there.
About my True reversal Point
I call these points a True Reversal point because it's not the support or resistance nor Fibonacci Zone. Support and resistance do not work majority of times and Fibonacci levels are the bunch of levels and if you are lucky then any one of them will work. My Levels are only one figure and it's compulsory for Market to respect that level and they are unignorable. These levels are designed to push price with pinpoint accuracy. That's why I call it the TRUE reversal point. Sometimes the market does not reverse with pinpoint accuracy but that's okay if the market moves a little bit up or down before reversing.
Hit the like button for the masterpiece and follow to stay connected.
Lowerlow

Market Structure | Impulse/CorrectionsMarket Structure | Impulse & Corrections 🎡😈
What is Market Structure?
Market structure is a trend-following technique that traders use to read and track how the price moves. Bullish moves, bearish moves, and ranges in between Market structure is also known as price action at times. As a result, we call it market structure since that is how the entire market moves.
How to identify Market Structure?
Wait for a swing high/low to be broken.
(candle-stick body must close above swing high/low)
What is Market Structure telling us?
in a Up-trend scenario, higher-lows will provide
in a Down-trend scenario, high-highs will provide
What is impulse/corrections?
The natural behavior of the Market.
What is correction?
When price is in a ranging or sideways market.
What is a impulse?
The point when price impulsively breaks out of the correction
How to use Impulse/Corrections?
to identify which phase we are in, and what to expect next.
Summary:
Market structure is the guidance to a trade setup, failing to identify market structure will lead to many unnecessary losses and an overall bad analysis.
Every trade consist of few things such as..
The first step to a trade is analysis which requires market structure in order to do so.
Very simple rules to follow.. BUY LOW - SELL HIGH 🎡

Bearishly Breaking Below The Neckline of A Lower High Double TopADA is Bearishly breaking below some serious support right now and looks as if it could make some major Fibonacci retraces.
The RSI and MACD are also both bearishly diverging.
It may reverse at the 50 percent retrace but if you want to take this trade to the extreme you could try to hold short until it reaches the .786-886 fib zones to take profit.

EURUSD on a lower low 🦐EURUSD is moving inside a descending channel .
The market after the break below the weekly structure moved below and attempt to break the support area at 1.19.
According to Plancton's strategy if the price will satisfy the conditions we will set a nice short order.
–––––
Follow the Shrimp 🦐
Keep in mind.
• 🟣 Purple structure -> Monthly structure.
• 🔴 Red structure -> Weekly structure.
• 🔵 Blue structure -> Daily structure.
• 🟡 Yellow structure -> 4h structure.
• ⚫️ Black structure -> >4h structure.
Here is the Plancton0618 technical analysis , please comment below if you have any question.
The ENTRY in the market will be taken only if the condition of the Plancton0618 strategy will trigger.

BTC - Controlled Descent - 2DA very orderly LH-LL-LH-LL pattern; scouting signs of a reversal pattern.

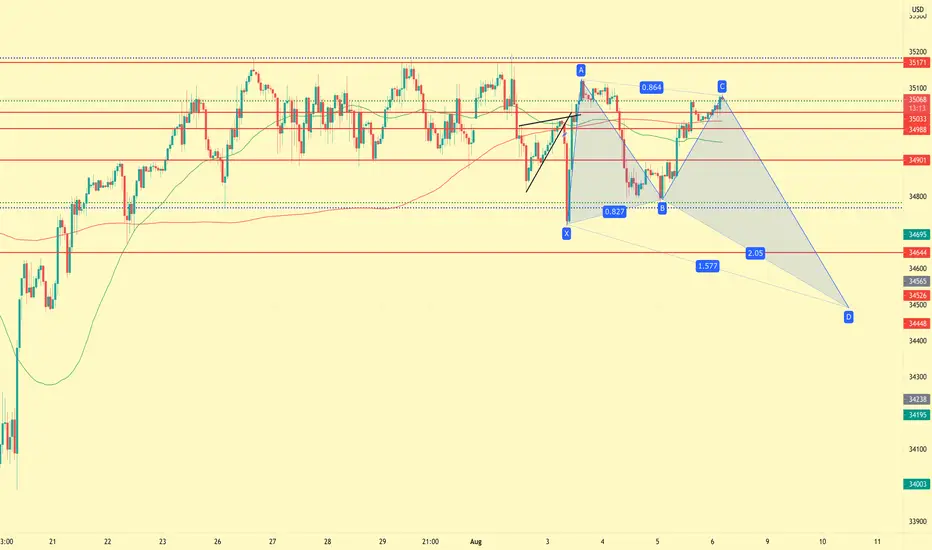
Potential Crab Forming Potential deep crab, sitting on the daily high making lower highs/lows.
We had a big bearish candle break structure earlier this week signaling potential bearish movement/weakness.
Right now price is sitting on the C point and can't go any higher, if it does the crab is invalidated, so I will watch price here carefully especially the candles, if we see a reversal candle/a spike to the high before a reversal I will short here using the previous lows as my targets along with the D point as an end target.
If price wicks past the C point but still closes around the 886 confirmation is still valid!
EURGBP looking for a lower low 🦐EURGBP on the daily chart is moving inside a descending channel.
The price after the retracement move to test of the resistance at the 0.87250 level has now reached the support and according to Plancton's strategy if the market will break below we can set a nice short order.
–––––
Follow the Shrimp 🦐
Keep in mind.
🟣 Purple structure -> Monthly structure.
🔴 Red structure -> Weekly structure.
🔵 Blue structure -> Daily structure.
🟡 Yellow structure -> 4h structure.
⚫️ Black structure -> <4h structure.
Here is the Plancton0618 technical analysis , please comment below if you have any question.
The ENTRY in the market will be taken only if the condition of the Plancton0618 strategy will trigger.

AUDUSD SHORTAfter moving from consecutive higher highs and higher lowers, we have a lower low and a lower high. The lower high flipped just about the 61.8% fib level, and then we see the formation of a Head and Shoulder pattern, While waiting for price to break and retest the neckline, we also expect it to gross below the 52 period SMA for us to enter into the short.

Sell for EURGBPPrice has been moving downward for a few days now, I set a maroon trend line and it broke through it. We are now seeing a confirmation of the move down.
This would bring in about 34 pips for a sell.

SPX: We are crashing! Time to panic?Hello traders and investors! Let’s see how the SPX is doing today!
Yes, we have a systemic crash in the US, but we’ve seen worse. This crash seems to be related to US tech stocks and China only, as European markets are still quite resilient, especially FTSE (UK) and DAX (GER), which are leaving huge shadows under today’s candlesticks.
As we discussed in my recent video, the SPX has no reversal signs , and even now, we lack bearish structure. We must see lower highs/lows in the 1h chart before assuming we’ll correct more.
We have a support at the gap (black line, 4,369), and the index is seeking this point, for now. Remember: A crash is just a pullback, and it doesn't mean we are in a bear trend.
However, I agree that the daily chart looks bearish already.
The market might understand today’s movement as a false breakout from the previous top level, and we are heading to the next support at the 21 ema. If the crash is strong enough, we can retest the support around the 4,289 again.
I find it hard to believe we would retest the purple trendline in the daily chart without a stronger bearish structure in the 1h chart. We can hit there, but we must see a clear reversal in smaller time-frames.
Only time will tell if this is just a crash or the beginning of a bearish reversal. If it is a crash, then fine, it’ll be just an opportunity to buy, like it has been since April 2020. If it is the beginning of a reversal, then we must wait for more patterns to confirm our theory.
If you liked this analysis, remember to follow me to keep in touch with my daily updates, and support this idea if it helped you!
Thank you very much!

AUDUSD: Short IdeaHello, Traders!
I expect a short term continuation of this downtrend. If we take the current movement to the downside into account we can see that it's pretty weak and that a flag consolidation is being formed. On the daily time frame the 200 MA indicator might act as a support. It is better to watch this pair closely as it could soon move up again.
What do you guys think? I'd be happy to know your thoughts about it.

Bank Nifty at trendline supportBank nifty is in downtrend but there is really good support of trendline which can lead to good bullish movement in market tomorrow. But we should not go long until the previous lower high is broken.

BITCOIN - Wyckoff Redistribution UpdateHello everyone, rouzwelt here
Well I have demonstrated Wyckoff Backup Action Events in my last idea as you can see in the screenshot below (full article link at botttom of page), and as of right now we have seen clear rejection from our resistant line at 32300 (PS) , and price action is showing that it's weak and can dump more. and the projection I have shown in the Screenshot is playing out somehow.
I want to note something in the next Screenshot below, and that is as you can see, price action have clearly broke down local trend lines (yellow lines) it could have formed. that's not good but I just wanted to note this so that we can see btc couldn't form a local trend line to find support at. but let's see if the current one can hold or not.
Anyway, Let me say something, whenever price is going up you want to see volume coming in and increase at rallies up and decrease at reactions and vice versa in the opposite direction. Now let's get back to the main chart. I believe that btc is weak right now, we don't see volume coming in at rallies high, actually its the opposite, we see volume at rallies down and decrease at reactions up. And that's what we are seeing right now at the btc 1H chart which I believe is pointing lower levels at this point.
But let me say smoething, that can reverse for a short period of time and we can head high locally to the blue trend line drawn in the main chart, well if we see this happening then I'd like to see the price squeeze around the blue trend line and a break out after that, only in that case I would open a long position for a short-term uprise. But lower levels are the more probable scenario (the red arrow price projection), and if so, we will get the last LPSY in back up action phase of wyckoff method and then I would be opening my swing short position.
Let's end by saying that the blue trend line in the main chart is the most important level for me to break if BTC wants to head high and test 36.5/38/40/42k resistants and potentially showing some strengths after almost 3-4 months.I don't want to sound bearish and actually I hate bear market as much as you do but we need to see some sign of strengths before saying we can see higher levels at least at this stage.

Bearish top down analysis Sessional tendency is bearish in Jun . Now price break previous low
Waiting for price go to supply. Kill zone is important

Bullish and Bearish Trend | ForexbeeBullish Trend
Bullish trend refers to consecutive higher highs
and higher lows in the price of a currency pair in forex during a specific timeframe. it shows that there is strong buying pressure.
Bearish Trend
The formation of consecutive lower lows and lower highs in the price of a currency during a specific timeframe is called a bearish trend. It indicates strong selling pressure.

NZDCHF testing a strong support 🦐NZDCHF on the 4h chart reached the weekly support level.
The price is moving inside a descending channel and is possibly looking for a lower low.
According to Plancton's strategy if the market will break below we will set a nice short order.
–––––
Follow the Shrimp 🦐
Keep in mind.
🟣 Purple structure -> Monthly structure.
🔴 Red structure -> Weekly structure.
🔵 Blue structure -> Daily structure.
🟡 Yellow structure -> 4h structure.
⚫️ Black structure -> >4h structure.
Here is the Plancton0618 technical analysis , please comment below if you have any question.
The ENTRY in the market will be taken only if the condition of the Plancton0618 strategy will trigger.

AMZN to open up physical pharmacy's WBA breaks trendline$WBA was on a nice upward trend. Today after $AMZN announces opening up pharmacy's $WBA breaks its upward trendline and maybe headed to lower support line

SP500 looking for a lower low? 🦐SP500 after the recent low retraced to the upside until the 0.618 Fibonacci level.
According to Plancton's strategy if the conditions will be satisfied we can set a nice short order.
––––
Follow the Shrimp 🦐
Keep in mind.
• 🟣 Purple structure -> Monthly structure.
• 🔴 Red structure -> Weekly structure.
• 🔵 Blue structure -> Daily structure.
• 🟡 Yellow structure -> 4h structure.
• ⚫️ Black structure -> >4h structure.
Here is the Plancton0618 technical analysis , please comment below if you have any question.
The ENTRY in the market will be taken only if the condition of the Plancton0618 strategy will trigger.

JMIA Daily analysisPossible HOLD now. Unusual options activity today. Needs to clear that top trendline and get some volume behind it.

Lower lowsTrending down, hitting resitance and going for a dip. How low can it go 160 or 150? with rising costs in material/inflation eating up the gains!!!

NIO: How much more could it drop? Let's see...Hello traders and investors! Let’s see how NIO is doing today! The stock has been doing very technical movements lately!
• A QUICK MESSAGE: Next Monday, I invite you to join me in our next stream! One hour before the market closes (3 p.m. NY time). Check this link: www.tradingview.com
NIO defeated the Dual-Resistance level we discussed in our last analysis, as expected, and it hit its natural target at $ 42.05, which we have been aiming since the beginning of the month. If you missed my previous analysis, the link is below this post, as usual.
Now, in the 1h chart, NIO did a bearish structure: It lost the 21 ema and it did a lower high/low . On the other hand, it has two important support levels to hold the price, the first one is around the green line at $ 39.34, the second one is around the $ 37.54.
In the daily chart, we see that NIO is at a Dual-Support zone , made not only by the green line, but by the 21 ema as well. If any bullish candlestick appears in a place like this, it is a crystal clear buy sign.
I didn’t put it in the chart, because it would be too much, but if you trace a Fibonacci Retracement in the last bullish leg, the 38.2% retracement is quite close to the green line as well, making it an even stronger support level. In addition, the 61.8% retracement coincides with the red line in the 1h chart, making it a good candidate for a reversal too.
What’s more, NIO is dropping, but the volume is quite low during this bearish movement, indicating that this is still not a real sell-off . Given how we have several powerful support levels, and how the volume is looking right now, I see drops as opportunities to buy.
If you liked this analysis, remember to follow me to keep in touch with my daily studies, and please, support this idea if it helped!

EURCAD for a lower low 🦐EURCAD is moving inside a descending channel.
The market after the test of the trendline is now approaching the support area and according to Plancton's strategy is the market will break below we will set a nice short order.
--––
Follow the Shrimp 🦐
Keep in mind.
🟣 Purple structure -> Monthly structure.
🔴 Red structure -> Weekly structure.
🔵 Blue structure -> Daily structure.
🟡 Yellow structure -> 4h structure.
⚫️ Black structure -> <4h structure.
Here is the Plancton0618 technical analysis , please comment below if you have any question.
The ENTRY in the market will be taken only if the condition of the Plancton0618 strategy will trigger.

SILVER on a lower low move 🦐SILVER after the test of the 25.6 area broke the minor channel and is turning into a bearish scenario.
The market is now testing a daily support and according to Plancton' strategy if the price will break below we can set a nice short order.
–––––
Follow the Shrimp 🦐
Keep in mind.
🟣 Purple structure -> Monthly structure.
🔴 Red structure -> Weekly structure.
🔵 Blue structure -> Daily structure.
🟡 Yellow structure -> 4h structure.
⚫️ Black structure -> <4h structure.
Here is the Plancton0618 technical analysis , please comment below if you have any question.
The ENTRY in the market will be taken only if the condition of the Plancton0618 strategy will trigger.

AUDUSD for a new bearish leg 🦐AUDNZD after the attempt to break the daily support started a minor impulse until the daily resistance at the 0.76740 area.
The market broke the minor ascending channel and according to Plancton's strategy if the price will move below the resistance we will set a nice short order.
–––––
Follow the Shrimp 🦐
Keep in mind.
🟣 Purple structure -> Monthly structure.
🔴 Red structure -> Weekly structure.
🔵 Blue structure -> Daily structure.
🟡 Yellow structure -> 4h structure.
⚫️ Black structure -> <4h structure.
Here is the Plancton0618 technical analysis , please comment below if you have any question.
The ENTRY in the market will be taken only if the condition of the Plancton0618 strategy will trigger
