GOLD on the 4h chart retraced at the 0.618 Fibonacci level of the major bearish impulse. The price took the liquidity over the 1950 resistance zone and tested the lower trendline of the ascending channel. According to Plancton's starretgy IF the price will break below we can consider a nice short order.
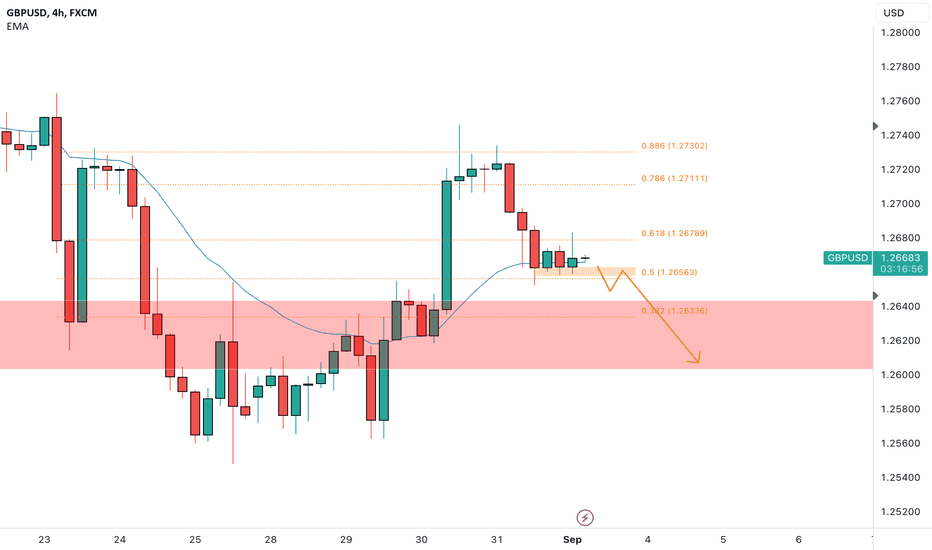
GBPUSD on the 4h chart after the last bearish impulse retraced at the 0.886 Fibonacci level. The price is trading above an important weekly structure and is currently testing the 50% retracement. According to Plancton'strategy IF the price will move below we can look for short order.
EURGBP on the 4h chart after the test of the weekly support created a strong impulse to the upside. The price is moving to the 0.86 area and we will wait for a retracement at a Fibonacci fundamental level. According to Plancton's strategy IF the price will then provide us a sign of inversion we will consider a nice long order.
JOEUSDT is currently forming a falling wedge pattern. This pattern is characterized by a narrowing range of price movement between two converging trendlines and is often considered a bullish reversal pattern. Falling Wedge Formation: A falling wedge is being observed in the price chart, typically preceding a breakout. Falling wedges are generally associated with...
ONEUSDT is currently testing a significant weekly support level. According to Plancton's trading principles, if the following conditions are met, a potential short trade could be considered: Support Bounce: The first condition involves observing a bounce or price reaction from the weekly support level. This bounce indicates that the support level has held and...
DOTUSDT, is currently testing a critical support level at $4.257, which you've indicated as the weekly support level. This level has historical significance and is closely watched by traders. According to the trading principles advocated by Plancton, a potential long trade could be considered if the following conditions are met: Support Confirmation: The first...
ALICEUSDT appears to be trading within an ascending channel. This pattern is characterized by a series of higher highs and higher lows, forming two parallel trendlines. According to Plancton's trading principles, a potential short trade could be considered if the following conditions are met: Loss of Support: The first condition involves a clear and decisive...
RNDRUSDT is currently at an interesting juncture as it tests dynamic resistance. The dynamic resistance you mentioned is a moving resistance level that adapts to market conditions over time. According to Plancton's trading rules, a potential long trade could be considered if the following conditions are met: Breakout from Dynamic Resistance: The first condition...
SUSHIUSDT appears to have formed an "M" pattern, which is often considered a bearish reversal pattern. In this pattern, there are two peaks, forming the letter "M," with a neckline connecting the two troughs. As per Plancton's trading principles, a potential bearish scenario could be as follows: Neckline Test: The price has tested the neckline, which is around...
VETUSDT is currently in a critical phase as it tests the significant weekly key level. This level is of utmost importance, as it has historical significance and often serves as a crucial pivot point for traders and investors. According to the trading principles advocated by Plancton, a well-known figure in the trading community, a potential long trade could be...
MAGICUSDT is currently exhibiting a falling wedge pattern above the key weekly level at $0.4496. This pattern suggests a period of consolidation and potential trend reversal. According to the trading principles associated with Plancton's strategy, a potential long trade could be considered if the following conditions are met: Breakout from Resistance: The first...
GBPCAD on the 4h chart after the last bullish impulse retraced at the 0.786 Fibonacci level. The price tested twice the level and is now moving upward. According to Plancton's strategy IF the market will break above we can consider a nice long order.
GOLD on the 4h chart has tested the 1890 level at the 0.618 Fibonacci area of the major upside impulse. The price after is turning to the upside and is currently moving to a 4h resistance. According to Plancton's strategy IF the market will break above we can set a nice long order.
ALGOUSDT is currently exhibiting a falling wedge pattern. This pattern is characterized by converging trendlines that slope downward. In this context, the falling wedge suggests a period of consolidation and uncertainty in the market. According to Plancton's trading rules, which are followed by many traders in the cryptocurrency market, a potential long trade...
AUDUSD on the 4h chart last week was rejected by the daily resistance at the 0.65000 area. The price has close below the area and during this week we can see a break above. According to Plancton's strategy IF the market will break above we can set a nice long order.
EURUSD on the 4h chart created an impulse to the upside and tested the 1.09400 at the 4h resistance area. The price after an impulse can èrovide a retracement to the 0.382 or the 0.5 Fibonacci level. According to Plancton's strategy IF the price will provide us a sign of inversion on those level we can consider a nice long order.
DENTUSDT is currently forming a pennant pattern above the significant weekly support level at 0.000590. This pattern suggests a period of consolidation and indecision in the market, where the price is coiling within a narrowing range. According to Plancton's trading principles, which are widely respected in the trading community, the price's behavior in this...
USDJPY on the 4h chart after our previous idea reached with a strong move the 146.500 zone. The market after a test of the 0.382 Fibonacci level moved higher and possible new recent high can be expected. According to Plancton's strategy IF the price will break above we can set a nice long order.


