XRP 1HR Tripple BottomTriple Bottoms being one of my favorite plays, I have located one the 1HR $XRP chart. Solid bounces right of the support with ranges marked with Horizontal rays. Gives you a decent idea of where it can go with continued solid volume. This is my first publish, thanks for taking the time to check it out and read. Any recommendation are greatly appreciated. Thank You, happy trading. Go Green Or Go Home.
Rangetrading

ATOM/USDT will break range this time ?Hello tradingview army, I hope everyone is doing good and taking care of themselves 😇
Today lets talk about Atom/usdt , cosmos is currently trading in huge range of 50% from last 3 months , this time it looks like range will be broken..
A good swing trade can be taken above supply zone with target of 50% from breakout 😋

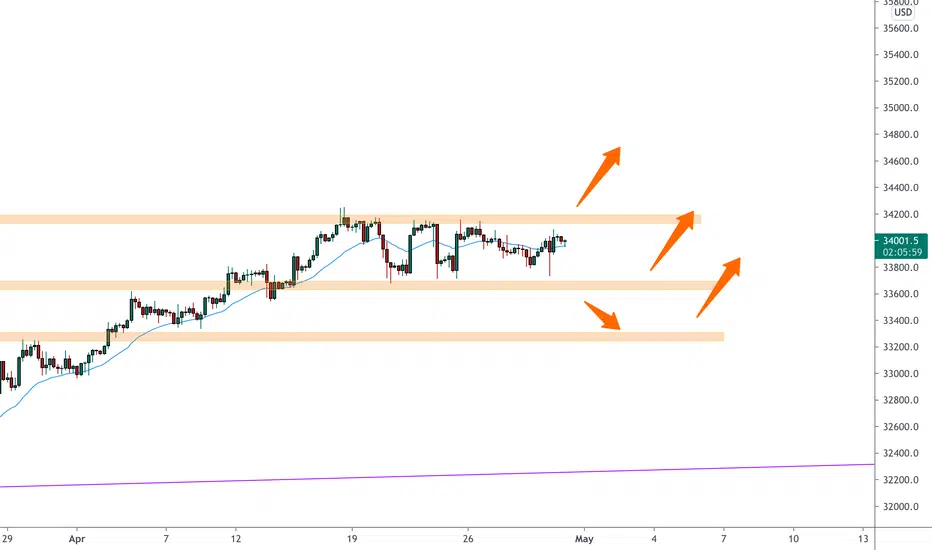
BTCUSD Bybit Perpetual - Breakup and Breakdown LevelsSupport my work with a Like and Follow Me for daily Analysis
Here is a simple Daily chart to Highlight where BTCs next move could take us
Using Fib Pulls and Volume profile to determine the said levels .
Know your invalidation regardless of the trade you take and thanks for stopping By .

EURUSD Still in the Range!!! Trade it with me!Trade the range with me. Just seen a reversal candle at the resistance. Expecting this to go up to the designated area!

EURGBP bounce over a weekly support 🦐EURGBP on the weekly chart is moving in a huge range between 2 monthly structures.
The price after a long descending trend reached the weekly support at the 0.85 area and bounce with a strong impulse.
According to Plancton's strategy if the market will break above the resistance we will set a nice long order.
-––
Follow the Shrimp 🦐
Keep in mind.
🟣 Purple structure -> Monthly structure.
🔴 Red structure -> Weekly structure.
🔵 Blue structure -> Daily structure.
🟡 Yellow structure -> 4h structure.
⚫️ Black structure -> <4h structure.
Here is the Plancton0618 technical analysis please comment below if you have any question.
The ENTRY in the market will be taken only if the condition of the Plancton0618 strategy will trigger.

WBA 1D BEAR FLAGBear Flags are a Range pattern that is a repeatable trading chart patterns.
Ascending Bear Flag chart patterns will have a directional bias (short) depending on the previous incoming trend.
Each chart pattern will have defining trendlines of the support/resistance levels creating the pattern.
What ever time frame you are trading this chart pattern, wait for a candle close outside of the trendline in the direction of the breakout candle. (Our time frame preference is the Daily chart).
Add volume indicator - Volume is the amount of $ that went into a particular candle or in Forex the # of trades that took place.
Add ATR indicator - Volatility is the amount of price movement that occurred. Use the ATR to measure the price movement.
When you see descending Volume bars and descending ATR line (which indicates volatility) this shows
a dis-interest in traders to invest in this pair creating consolidation which creates the chart pattern.
Trade Management after there is a breakout candle close.
1 - Position size (compare volume bar to volume ma line).
a - Breakout candle must be 100% of volume average for a full position size.
b - If 75% of volume average then ½ position size. (To find 75% of Volume
look at the charts volume settings – divide smaller # into larger # = 75%+)
If not 75% then stand aside from the trade.
2 – If candle breaks out of a trendline, 15m before the close of the day prepare your buy/sell order.
Enter two trades. 1st trade will have a SL & TP. It will close automatically when the 1st TP is hit. 2nd
trade only has a SL and will be allowed to run. When 1st TP is hit move the SL to breakeven. Look
at ATR and prepare SL at 1.5 of ATR. Prepare 1st trade TP at 1 of ATR.
3 - SL for both trades will be 1.5 x ATR.
4 - 1st trade TP will be 1 x ATR.
5 - No TP on 2nd trade – letting profit run and adjusting SL to follow price.
6 - When 1st TP hit – move 2nd trade SL to breakeven.
7 - Adjust the 2nd trade SL to follow price.
*8 – After Breakout candle – if price closes back into chart pattern close trade don't wait for SL to be hit.
*9 - When breakout candle is more than 1 ATR from breakout candle open.
a - Enter 1st trade at candle close with ½ position size.
b - Enter 2nd trade with a pending limit order that is 1 ATR of breakout candle open.
c – Price should pullback to that pending limit order for 2nd trade.
d – If Price returns back into chart pattern close trade before SL is hit.

EURCHF 1D BULL FLAGBull Flags are a Range pattern and they are repeatable trading chart patterns.
Descending Bull Flag chart patterns will have a directional bias (Long Bias) depending on the previous incoming trend.
Each chart pattern will have defining trendlines of the support/resistance levels creating the pattern.
What ever time frame you are trading this chart pattern, wait for a candle close outside of the trendline in the direction of the breakout candle. (Our time frame preference is the Daily chart).
Add volume indicator - Volume is the amount of $ that went into a particular candle or in Forex the # of trades that took place.
Add ATR indicator - Volatility is the amount of price movement that occurred. Use the ATR to measure the price movement.
When you see descending Volume bars and descending ATR line (which indicates volatility) this shows
a dis-interest in traders to invest in this pair creating consolidation which creates the chart pattern.
Trade Management after there is a breakout candle close.
1 - Position size (compare volume bar to volume ma line).
a - Breakout candle must be 100% of volume average for a full position size.
b - If 75% of volume average then ½ position size. (To find 75% of Volume
look at the charts volume settings – divide smaller # into larger # = 75%+)
If not 75% then stand aside from the trade.
2 – If candle breaks out of a trendline, 15m before the close of the day prepare your buy/sell order.
Enter two trades. 1st trade will have a SL & TP. It will close automatically when the 1st TP is hit. 2nd
trade only has a SL and will be allowed to run. When 1st TP is hit move the SL to breakeven. Look
at ATR and prepare SL at 1.5 of ATR. Prepare 1st trade TP at 1 of ATR.
3 - SL for both trades will be 1.5 x ATR.
4 - 1st trade TP will be 1 x ATR.
5 - No TP on 2nd trade – letting profit run and adjusting SL to follow price.
6 - When 1st TP hit – move 2nd trade SL to breakeven.
7 - Adjust the 2nd trade SL to follow price.
*8 – After Breakout candle – if price closes back into chart pattern close trade don't wait for SL to be hit.
*9 - When breakout candle is more than 1 ATR from breakout candle open.
a - Enter 1st trade at candle close with ½ position size.
b - Enter 2nd trade with a pending limit order that is 1 ATR of breakout candle open.
c – Price should pullback to that pending limit order for 2nd trade.
d – If Price returns back into chart pattern close trade before SL is hit.

Dow on a range trading 🦐DOW on the 4h chart is moving inside 2 structures, after that last retracement the market tested a previous support.
Being the end of the monthly and the weekly candles we can expect some further retracement.
According to Plancton's strategy when the price will break above and the conditions will be satisfied we can set a nice long order.
–––––
Follow the Shrimp 🦐
Keep in mind.
• 🟣 Purple structure -> Monthly structure.
• 🔴 Red structure -> Weekly structure.
• 🔵 Blue structure -> Daily structure.
• 🟡 Yellow structure -> 4h structure.
• ⚫️ Black structure -> >4h structure.
Here is the Plancton0618 technical analysis , please comment below if you have any question.
The ENTRY in the market will be taken only if the condition of the Plancton0618 strategy will trigger.
Sharp Downtrend is coming on BNBUSDTAs you can see, BNBUSDT is in a major range trend. Uptrends inside the range are losing momentum and their angles getting lower every time.
But downtrends getting stronger and their angles getting higher each time. Beside, RSI shows hidden divergence on the uptrend and volume rises near resistance shows selling pressure. This is the BNB situation. If the blue line breaks, there going to be a sharp downtrend.
I think price forms a double top before downtrend.

GBPJPY's Pennant Needs to be Completed Before a Bearish ReversalThe GBPJPY is currently forming a Pennant pattern, which presupposes diminishing volatility. Such conditions are typically observed whenever the market is ranging, potentially before the price gets ready to develop a new upswing/downswing.
The current upswing could reach the Test Area in green before a major bearish reversal takes place. Bears can look for an opportunity to sell near the Area's upper boundary at 152.00 with the intention to catch the subsequent downswing towards the Target Area.
Keep in mind that the price action is currently probing the 100-day MA, which could prove to be an impregnable resistance even before the GBPJPY manages to reach 152.000. Moreover, the 200-day MA (in purple) is currently converging with the lower boundary of the Test Area, so there are multiple places where a bearish reversal could occur.

EURAUD BEAR FLAGBear Flags are a Ranges pattern and they are repeatable trading chart patterns.
Ascending Bear Flags are chart patterns that will have a directional bias (BearishShort) depending on the previous incoming trend.
Each chart pattern will have defining trendlines of the support/resistance levels creating the pattern.
What ever time frame you are trading this chart pattern, wait for a candle close outside of the trendline in the direction of the breakout candle. (Our time frame preference is the Daily chart).
Add volume indicator - Volume is the amount of $ that went into a particular candle or in Forex the # of trades that took place.
Add ATR indicator - Volatility is the amount of price movement that occurred. Use the ATR to measure the price movement.
When you see descending Volume bars and descending ATR line (which indicates volatility) this shows
a dis-interest in traders to invest in this pair creating consolidation which creates the chart pattern.
Trade Management after there is a breakout candle close.
1 - Position size (compare volume bar to volume ma line).
a - Breakout candle must be 100% of volume average for a full position size.
b - If 75% of volume average then ½ position size. (To find 75% of Volume
look at the charts volume settings – divide smaller # into larger # = 75%+)
If not 75% then stand aside from the trade.
2 – If candle breaks out of a trendline, 15m before the close of the day prepare your buy/sell order.
Enter two trades. 1st trade will have a SL & TP. It will close automatically when the 1st TP is hit. 2nd
trade only has a SL and will be allowed to run. When 1st TP is hit move the SL to breakeven. Look
at ATR and prepare SL at 1.5 of ATR. Prepare 1st trade TP at 1 of ATR.
3 - SL for both trades will be 1.5 x ATR.
4 - 1st trade TP will be 1 x ATR.
5 - No TP on 2nd trade – letting profit run and adjusting SL to follow price.
6 - When 1st TP hit – move 2nd trade SL to breakeven.
7 - Adjust the 2nd trade SL to follow price.
*8 – After Breakout candle – if price closes back into chart pattern close trade don't wait for SL to be hit.
*9 - When breakout candle is more than 1 ATR from breakout candle open.
a - Enter 1st trade at candle close with ½ position size.
b - Enter 2nd trade with a pending limit order that is 1 ATR of breakout candle open.
c – Price should pullback to that pending limit order for 2nd trade.
d – If Price returns back into chart pattern close trade before SL is hit.

Bill.com Range TradingRanges are repeatable trading chart patterns.
Ranges are consolidation chart patterns that can breakout either direction.
Each chart pattern will have defining trendlines of the support/resistance levels creating the pattern.
What ever time frame you are trading this chart pattern, wait for a candle close outside of the trendline in the direction of the breakout candle. (Our time frame preference is the Daily chart).
Add volume indicator - Volume is the amount of $ that went into a particular candle or in Forex the # of trades that took place.
Add ATR indicator - Volatility is the amount of price movement that occurred. Use the ATR to measure the price movement.
When you see descending Volume bars and descending ATR line (which indicates volatility) this shows
a dis-interest in traders to invest in this pair creating consolidation which creates the chart pattern.
Trade Management after there is a breakout candle close.
1 - Position size (compare volume bar to volume ma line).
a - Breakout candle must be 100% of volume average for a full position size.
b - If 75% of volume average then ½ position size. (To find 75% of Volume
look at the charts volume settings – divide smaller # into larger # = 75%+)
If not 75% then stand aside from the trade.
2 – If candle breaks out of a trendline, 15m before the close of the day prepare your buy/sell order.
Enter two trades. 1st trade will have a SL & TP. It will close automatically when the 1st TP is hit. 2nd
trade only has a SL and will be allowed to run. When 1st TP is hit move the SL to breakeven. Look
at ATR and prepare SL at 1.5 of ATR. Prepare 1st trade TP at 1 of ATR.
3 - SL for both trades will be 1.5 x ATR.
4 - 1st trade TP will be 1 x ATR.
5 - No TP on 2nd trade – letting profit run and adjusting SL to follow price.
6 - When 1st TP hit – move 2nd trade SL to breakeven.
7 - Adjust the 2nd trade SL to follow price.
*8 – After Breakout candle – if price closes back into chart pattern close trade don't wait for SL to be hit.
*9 - When breakout candle is more than 1 ATR from breakout candle open.
a - Enter 1st trade at candle close with ½ position size.
b - Enter 2nd trade with a pending limit order that is 1 ATR of breakout candle open.
c – Price should pullback to that pending limit order for 2nd trade.
d – If Price returns back into chart pattern close trade before SL is hit.

SP500 range trading 🦐 SP500 after our last analysis is moving at the market highs.
The price is now moving between 2 structures and according to Plancton's strategy if the market will break below we will set a nice short order.
––––
Follow the Shrimp 🦐
Keep in mind.
• 🟣 Purple structure -> Monthly structure.
• 🔴 Red structure -> Weekly structure.
• 🔵 Blue structure -> Daily structure.
• 🟡 Yellow structure -> 4h structure.
• ⚫️ Black structure -> >4h structure.
Here is the Plancton0618 technical analysis , please comment below if you have any question.
The ENTRY in the market will be taken only if the condition of the Plancton0618 strategy will trigger.

EURNZD may breakout a range tradingif EURNZD breakout the range zone it will go up but if not it will come to bottom of its range zone.


EURJPY Ranging EURJPY has been in a range for a 20 days... is it ready to BREAK OUT?!
Let me know what you look for/do when price is ranging!

Breakdown Play on the EURJPYThe EURJPY is currently trading within the boundaries of a major range (spanning between 130.600 and 129.800). If the price manages to break down below the lower boundary of the range, this would open up the possibility for another breakdown towards 128.400 (previous swing low).
Such a breakdown would be confirmed if the price manages to penetrate below the 100-day MA (in blue) first and then below the 200-day MA (in red). Notice that the latter is currently converging with the lower boundary of the range.

A deeper dive into OXT price action*Beginning trader and technical analyst. I received my trading education from TRi, school of trader development. **This is not trade or financial advice, but posted for entertainment.
I hope this chart isn't too messy. Had a lot to say.
I like this crypto. Yes, VPN, isn't sexy like NFT's, Defi, or the almighty BTC, but it is a fundamentally important growth component to the future of an internet with robust privacy and free of censorship. There are big VC names behind this crypto too, Sequoia and A16z. Why does it seem to be just hanging out? I find sometimes that I have to check my opinions and emotions at the door. I tell myself things like " oh this thing hasn't popped, so I'm going to get in early because I know it just hast to." or even "There are big VC names in it so it must be good." May be you have some of these feelings too? But what does the tech say? Am I being realistic about what this crypto is going to do today, tomorrow, next month or even next year?
I want to be bullish this name. I think it has big upside potential, low market cap, relatively low coin supply, right now. I don't think we are bearish yet, but I don't think we are screaming bull. And when Bitcoin is going nuts like it is, we all know that any moves, up or down, can totally invalidate technical analysis on alt coins.
So here are some of my thoughts on OXT (posted in the chart). I've become a little obsessed with OXT right now, so I will try to keep posting my thoughts. It seems like this coin may be manipulated. Seems to be a lot more potential buyers than sellers on the order book but not the price movement to reflect it. Im not the best at reading DOMS or order books , so if you have an opinion on that or any other aspect of my analysis please share as I would love to hear it.
It is looking a little toppy. Maybe it will put in a double bottom off a bounce at the 50% of the range at approximately .73. Ultimately, the markets going to do any damn thing that it wants to do-I keep this in the back of my mind when trading. Trade it don't date it.
COINBASE:OXTUSD

AUDSGD ready for the range break 🦐AUDSGD is moving between a minor support and a weekly resistance structure.
The price has now broken the descending trendline and according to Plancton's strategy if the market will break above we will set a nice long order.
–––––
Follow the Shrimp 🦐
Keep in mind.
• 🟣 Purple structure -> Monthly structure.
• 🔴 Red structure -> Weekly structure.
• 🔵 Blue structure -> Daily structure.
• 🟡 Yellow structure -> 4h structure.
• ⚫️ Black structure -> >4h structure.
Here is the Plancton0618 technical analysis , please comment below if you have any question.
The ENTRY in the market will be taken only if the condition of the Plancton0618 strategy will trigger.

DODO on a range break soon 🦐After the recent highs DODO started an endless range trading between 2 structures.
According to Plancton's strategy if the price will break above we can set a nice long order.
–––––
Follow the Shrimp 🦐
Keep in mind.
🟣 Purple structure -> Monthly structure.
🔴 Red structure -> Weekly structure.
🔵 Blue structure -> Daily structure.
🟡 Yellow structure -> 4h structure.
⚫️ Black structure -> <4h structure.
Here is the Plancton0618 technical analysis , please comment below if you have any question.
The ENTRY in the market will be taken only if the condition of the Plancton0618 strategy will trigger.
Leave a comment that is helpful or encouraging. Let's master the markets together

AUDJPY 1D RANGE TRADINGRanges are repeatable trading chart patterns.
Ranges are consolidation chart patterns that can breakout either direction.
Each chart pattern will have defining trendlines of the support/resistance levels creating the pattern.
What ever time frame you are trading this chart pattern, wait for a candle close outside of the trendline in the direction of the breakout candle. (Our time frame preference is the Daily chart).
Add volume indicator - Volume is the amount of $ that went into a particular candle or in Forex the # of trades that took place.
Add ATR indicator - Volatility is the amount of price movement that occurred. Use the ATR to measure the price movement.
When you see descending Volume bars and descending ATR line (which indicates volatility) this shows
a dis-interest in traders to invest in this pair creating consolidation which creates the chart pattern.
Trade Management after there is a breakout candle close.
1 - Position size (compare volume bar to volume ma line).
a - Breakout candle must be 100% of volume average for a full position size.
b - If 75% of volume average then ½ position size. (To find 75% of Volume
look at the charts volume settings – divide smaller # into larger # = 75%+)
If not 75% then stand aside from the trade.
2 – If candle breaks out of a trendline, 15m before the close of the day prepare your buy/sell order.
Enter two trades. 1st trade will have a SL & TP. It will close automatically when the 1st TP is hit. 2nd
trade only has a SL and will be allowed to run. When 1st TP is hit move the SL to breakeven. Look
at ATR and prepare SL at 1.5 of ATR. Prepare 1st trade TP at 1 of ATR.
3 - SL for both trades will be 1.5 x ATR.
4 - 1st trade TP will be 1 x ATR.
5 - No TP on 2nd trade – letting profit run and adjusting SL to follow price.
6 - When 1st TP hit – move 2nd trade SL to breakeven.
7 - Adjust the 2nd trade SL to follow price.
*8 – After Breakout candle – if price closes back into chart pattern close trade don't wait for SL to be hit.
*9 - When breakout candle is more than 1 ATR from breakout candle open.
a - Enter 1st trade at candle close with ½ position size.
b - Enter 2nd trade with a pending limit order that is 1 ATR of breakout candle open.
c – Price should pullback to that pending limit order for 2nd trade.
d – If Price returns back into chart pattern close trade before SL is hit.

GOLD 1D RANGE TRADINGRanges are repeatable trading chart patterns.
Ranges are consolidation chart patterns that can breakout either direction.
Each chart pattern will have defining trendlines of the support/resistance levels creating the pattern.
What ever time frame you are trading this chart pattern, wait for a candle close outside of the trendline in the direction of the breakout candle. (Our time frame preference is the Daily chart).
Add volume indicator - Volume is the amount of $ that went into a particular candle or in Forex the # of trades that took place.
Add ATR indicator - Volatility is the amount of price movement that occurred. Use the ATR to measure the price movement.
When you see descending Volume bars and descending ATR line (which indicates volatility) this shows
a dis-interest in traders to invest in this pair creating consolidation which creates the chart pattern.
Trade Management after there is a breakout candle close.
1 - Position size (compare volume bar to volume ma line).
a - Breakout candle must be 100% of volume average for a full position size.
b - If 75% of volume average then ½ position size. (To find 75% of Volume
look at the charts volume settings – divide smaller # into larger # = 75%+)
If not 75% then stand aside from the trade.
2 – If candle breaks out of a trendline, 15m before the close of the day prepare your buy/sell order.
Enter two trades. 1st trade will have a SL & TP. It will close automatically when the 1st TP is hit. 2nd
trade only has a SL and will be allowed to run. When 1st TP is hit move the SL to breakeven. Look
at ATR and prepare SL at 1.5 of ATR. Prepare 1st trade TP at 1 of ATR.
3 - SL for both trades will be 1.5 x ATR.
4 - 1st trade TP will be 1 x ATR.
5 - No TP on 2nd trade – letting profit run and adjusting SL to follow price.
6 - When 1st TP hit – move 2nd trade SL to breakeven.
7 - Adjust the 2nd trade SL to follow price.
*8 – After Breakout candle – if price closes back into chart pattern close trade don't wait for SL to be hit.
*9 - When breakout candle is more than 1 ATR from breakout candle open.
a - Enter 1st trade at candle close with ½ position size.
b - Enter 2nd trade with a pending limit order that is 1 ATR of breakout candle open.
c – Price should pullback to that pending limit order for 2nd trade.
d – If Price returns back into chart pattern close trade before SL is hit.

NEOUSDT ready for the break 🦐NEOUSDT after the recent high is currently moving between 2 minor structures and according to Plancton's strategy if the price will break above we can set a nice long order.
–––––
Follow the Shrimp 🦐
Keep in mind.
🟣 Purple structure -> Monthly structure.
🔴 Red structure -> Weekly structure.
🔵 Blue structure -> Daily structure.
🟡 Yellow structure -> 4h structure.
⚫️ Black structure -> <4h structure.
Here is the Plancton0618 technical analysis , please comment below if you have any question.
The ENTRY in the market will be taken only if the condition of the Plancton0618 strategy will trigger.

LINKBULL high volatillity token1 long setup!Hello friends
good mood and profitable deals!
Strategy:
Channel retest
Rangetrading
Algo play
Waiting for confirmation from BTC in LTF
If you like this action
3x Long Token is tradable on Poloniex, located in USA-Delaware:
you get 10% of my trading fees and I 20% of yours
poloniex.com
If you liked this idea or have your opinion on it, write in the comments, We will be glad.
No trading advice, dyor and trade safe.
