Lingrid | DOGEUSDT Potential LONG on Pullback to SWAP ZoneThe price perfectly fulfilled my last idea . It reached the target. After a strong rally and fake breakout above the resistance near 0.1915, BINANCE:DOGEUSDT is now pulling back and trading inside a sideways range. Price is heading toward the 0.1700–0.1710 support area, which aligns with the upward trend-line. If bulls hold this zone, a rebound toward 0.1850 looks likely. As long as price stays above the trend-line, bullish structure remains valid.
📈 Key Levels
Buy zone: 0.1700 – 0.1710
Buy trigger: bounce from trend-line
Target: 0.1850
Sell trigger: break below 0.1700
💡 Risks
If price breaks below 0.1700, it may open the way toward deeper support.
Sudden spikes in Bitcoin or market-wide sentiment shifts can shake the setup.
Lower timeframe volatility near trend-line could trap early entries.
Traders, if you liked this idea or if you have your own opinion about it, write in the comments. I will be glad 👩💻
Signals

DXY Ready to Pop – Watch That 100 Break!After breaking below the key psychological level at 100 and making a low just under 98, the Dollar Index ( TVC:DXY ) has entered a consolidation phase.
Over the past three weeks, price has developed an inverted head and shoulders pattern, with the neckline perfectly aligning with the horizontal resistance at 100 — a strong zone of confluence from both a technical and psychological standpoint.
Despite the current hesitation under resistance, the structure suggests bullish potential. I believe we are approaching a breakout above 100, and once that happens, an acceleration to the upside is likely to follow.
🎯 Target: 102
🔒 Invalidation: A break below 98 would cancel the bullish bias.
As long as the price stays above the 98 area, I remain bullish and expect the dollar to strengthen.
🚀 The breakout hasn’t happened yet — but the pressure is building.

Gold weakens under pressure from USD and bondsOn the morning of April 30, the world gold price fell to 3,318 USD/ounce, down 20 USD compared to the same time the previous day. The strong increase in USD and high US bond yields at 4.23% made gold lose its appeal in the eyes of investors.
The recovery of US stocks and the decline in oil prices further depressed market sentiment. On the H4 chart, gold has not yet escaped the sideways zone around EMA34 - a sign that buying power is weakening.

NZDCAD Will Go Lower From Resistance! Short!
Here is our detailed technical review for NZDCAD.
Time Frame: 2h
Current Trend: Bearish
Sentiment: Overbought (based on 7-period RSI)
Forecast: Bearish
The market is trading around a solid horizontal structure 0.827.
The above observations make me that the market will inevitably achieve 0.824 level.
P.S
We determine oversold/overbought condition with RSI indicator.
When it drops below 30 - the market is considered to be oversold.
When it bounces above 70 - the market is considered to be overbought.
Disclosure: I am part of Trade Nation's Influencer program and receive a monthly fee for using their TradingView charts in my analysis.
Like and subscribe and comment my ideas if you enjoy them!

NZD_USD REBOUND AHEAD|LONG|
✅NZD_USD is trading in an
Uptrend and the pair is making
A local correction in a way
Which also resembles a bullish
Wedge so after the retest of the
Horizontal support around 0.5917
A local bullish rebound
Is to be expected
LONG🚀
✅Like and subscribe to never miss a new idea!✅
Disclosure: I am part of Trade Nation's Influencer program and receive a monthly fee for using their TradingView charts in my analysis.

GBP-CAD Will Grow! Buy!
Hello,Traders!
GBP-CAD is trading in an
Uptrend and the pair
Made a bullish breakout
And a pullback so affter
The retest of the broken
Falling resistance which
Is now a support we will
Be expecting a further
Bullish move up
Buy!
Comment and subscribe to help us grow!
Check out other forecasts below too!
Disclosure: I am part of Trade Nation's Influencer program and receive a monthly fee for using their TradingView charts in my analysis.

GBP_AUD BULLISH BREAKOUT|LONG|
✅GBP_AUD is going up now
And the pair made a bullish
Breakout of the key horizontal
Level around 2.0940 so as the
Breakout is confirmed we will
Be expecting a further
Bullish continuation
LONG🚀
✅Like and subscribe to never miss a new idea!✅
Disclosure: I am part of Trade Nation's Influencer program and receive a monthly fee for using their TradingView charts in my analysis.

NZD-JPY Potential Long! Buy!
Hello,Traders!
NZD-JPY is going down
Now but the pair will soon
Hit a horizontal support
Level around 84.000 from
Where we will be expecting
A local bullish rebound
And a further move up
Buy!
Comment and subscribe to help us grow!
Check out other forecasts below too!
Disclosure: I am part of Trade Nation's Influencer program and receive a monthly fee for using their TradingView charts in my analysis.

NZD-USD Long From Support! Buy!
Hello,Traders!
NZD-USD is making a local
Bearish correction but will
Soon hit a horizontal support
Around 0.5915 from where
We will be expecting a
Local bullish rebound
Buy!
Comment and subscribe to help us grow!
Check out other forecasts below too!
Disclosure: I am part of Trade Nation's Influencer program and receive a monthly fee for using their TradingView charts in my analysis.

WTI OIL Bearish Cross confirming more selling ahead.WTI Oil (USOIL) has been trading within a Channel Down pattern since the December 06 2024 Low. The last Bearish Leg started on a 1D MA200 (orange trend-line) rejection and was confirmed with a 1D MACD Bearish Cross 3 days after.
At the moment we have had a 1D MA50 (blue trend-line) rejection and today we will complete a new 1D MACD Bearish Cross. As a result, we almost have a new sell confirmation. Once completed, sell and target $53.50 (-19% from the point of the rejection).
-------------------------------------------------------------------------------
** Please LIKE 👍, FOLLOW ✅, SHARE 🙌 and COMMENT ✍ if you enjoy this idea! Also share your ideas and charts in the comments section below! This is best way to keep it relevant, support us, keep the content here free and allow the idea to reach as many people as possible. **
-------------------------------------------------------------------------------
Disclosure: I am part of Trade Nation's Influencer program and receive a monthly fee for using their TradingView charts in my analysis.
💸💸💸💸💸💸
👇 👇 👇 👇 👇 👇

BITCOIN BUY !!!Hello friends✌
As you can see in the picture, we have specified a purchase range for you to buy in stages, of course with capital and risk management.
🙏If you like it, support it with a ✔like✔ and ✔comment✔.
*Trade safely with us*

Trading balanceTrading balance The price of the asset has rebounded from the balance zone. With the prospect of growth into the resistance zone.
S&P500 repeating the 2019 recovery-Can hit 7000.The S&P500 index (SPX) is making a remarkable recovery as it completed yet another strong 1W green candle last week following the rebound on its Higher Lows Zone, near the 1W MA200 (orange trend-line).
This is a mirror price action with the last 1W MA200 rebound of the 2016 - 2019 Bullish Megaphone pattern, which not only recovered its previous All Time High (ATH) but also peaked on the 1.618 Fibonacci extension before the eventual 2020 COVID crash.
As a result, we believe that a 7000 Target is a very plausible one on the long-term.
-------------------------------------------------------------------------------
** Please LIKE 👍, FOLLOW ✅, SHARE 🙌 and COMMENT ✍ if you enjoy this idea! Also share your ideas and charts in the comments section below! This is best way to keep it relevant, support us, keep the content here free and allow the idea to reach as many people as possible. **
-------------------------------------------------------------------------------
Disclosure: I am part of Trade Nation's Influencer program and receive a monthly fee for using their TradingView charts in my analysis.
💸💸💸💸💸💸
👇 👇 👇 👇 👇 👇

DXY: Will Go Up! Long!
My dear friends,
Today we will analyse DXY together☺️
The market is at an inflection zone and price has now reached an area around 98.933 where previous reversals or breakouts have occurred.And a price reaction that we are seeing on multiple timeframes here could signal the next move up so we can enter on confirmation, and target the next key level of 99.097.Stop-loss is recommended beyond the inflection zone.
❤️Sending you lots of Love and Hugs❤️

GOLD: The Market Is Looking Down! Short!
My dear friends,
Today we will analyse GOLD together☺️
The price is near a wide key level
and the pair is approaching a significant decision level of 3,314.09 Therefore, a strong bearish reaction here could determine the next move down.We will watch for a confirmation candle, and then target the next key level of 3,296.10..Recommend Stop-loss is beyond the current level.
❤️Sending you lots of Love and Hugs❤️

SILVER: Strong Bearish Sentiment! Short!
My dear friends,
Today we will analyse SILVER together☺️
The recent price action suggests a shift in mid-term momentum. A break below the current local range around 33.293 will confirm the new direction downwards with the target being the next key level of 33.052.and a reconvened placement of a stop-loss beyond the range.
❤️Sending you lots of Love and Hugs❤️

YFI/USDTIn this analysis, I’m tracking the recent downtrend on the US30 daily chart. Based on the current pattern and technical indicators (like RSI divergence and a bounce off a key support zone), I expect a potential reversal or at least a short-term correction. Entry signal is marked based on my Smart Bot strategy.

EURUSD: Bulls Are Winning! Long!
My dear friends,
Today we will analyse EURUSD together☺️
The in-trend continuation seems likely as the current long-term trend appears to be strong, and price is holding above a key level of 1.13750 So a bullish continuation seems plausible, targeting the next high. We should enter on confirmation, and place a stop-loss beyond the recent swing level.
❤️Sending you lots of Love and Hugs❤️

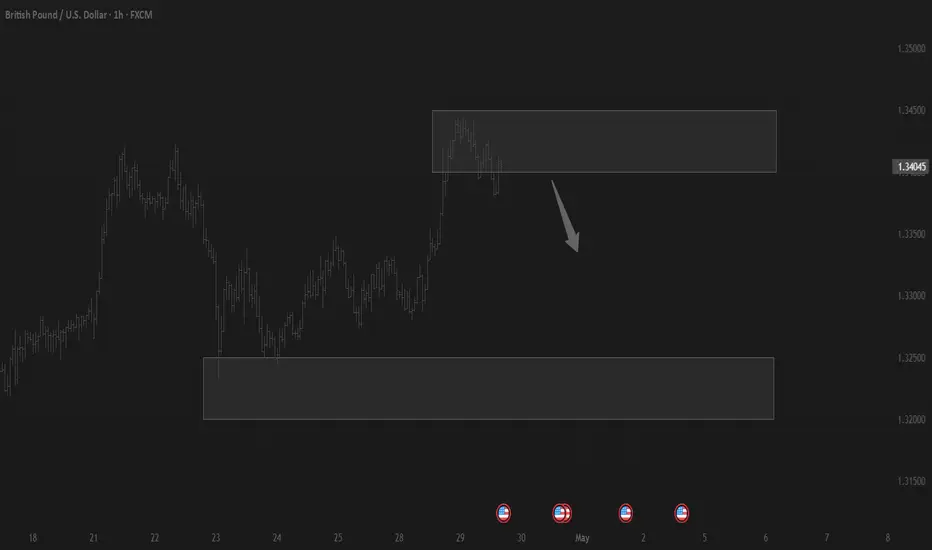
GBPUSD SHORT TRADE?GBPUSD Grab liquidity from buyside and close below range this shows the power of bears in the market and also dxy show strength so go short with sl above high

DXY Will Go Higher! Buy!
Please, check our technical outlook for DXY.
Time Frame: 9h
Current Trend: Bullish
Sentiment: Oversold (based on 7-period RSI)
Forecast: Bullish
The market is approaching a key horizontal level 99.288.
Considering the today's price action, probabilities will be high to see a movement to 100.788.
P.S
We determine oversold/overbought condition with RSI indicator.
When it drops below 30 - the market is considered to be oversold.
When it bounces above 70 - the market is considered to be overbought.
Disclosure: I am part of Trade Nation's Influencer program and receive a monthly fee for using their TradingView charts in my analysis.
Like and subscribe and comment my ideas if you enjoy them!

USOIL Will Go Down! Sell!
Here is our detailed technical review for USOIL.
Time Frame: 8h
Current Trend: Bearish
Sentiment: Overbought (based on 7-period RSI)
Forecast: Bearish
The market is approaching a significant resistance area 61.191.
Due to the fact that we see a positive bearish reaction from the underlined area, I strongly believe that sellers will manage to push the price all the way down to 56.009 level.
P.S
Overbought describes a period of time where there has been a significant and consistent upward move in price over a period of time without much pullback.
Disclosure: I am part of Trade Nation's Influencer program and receive a monthly fee for using their TradingView charts in my analysis.
Like and subscribe and comment my ideas if you enjoy them!

AUDUSD Will Move Lower! Short!
Take a look at our analysis for AUDUSD.
Time Frame: 1D
Current Trend: Bearish
Sentiment: Overbought (based on 7-period RSI)
Forecast: Bearish
The market is on a crucial zone of supply 0.641.
The above-mentioned technicals clearly indicate the dominance of sellers on the market. I recommend shorting the instrument, aiming at 0.629 level.
P.S
Please, note that an oversold/overbought condition can last for a long time, and therefore being oversold/overbought doesn't mean a price rally will come soon, or at all.
Disclosure: I am part of Trade Nation's Influencer program and receive a monthly fee for using their TradingView charts in my analysis.
Like and subscribe and comment my ideas if you enjoy them!

GBPAUD Is Bullish! Long!
Please, check our technical outlook for GBPAUD.
Time Frame: 1D
Current Trend: Bullish
Sentiment: Oversold (based on 7-period RSI)
Forecast: Bullish
The price is testing a key support 2.089.
Current market trend & oversold RSI makes me think that buyers will push the price. I will anticipate a bullish movement at least to 2.151 level.
P.S
The term oversold refers to a condition where an asset has traded lower in price and has the potential for a price bounce.
Overbought refers to market scenarios where the instrument is traded considerably higher than its fair value. Overvaluation is caused by market sentiments when there is positive news.
Disclosure: I am part of Trade Nation's Influencer program and receive a monthly fee for using their TradingView charts in my analysis.
Like and subscribe and comment my ideas if you enjoy them!

BITCOIN Why is this rally surprising you?Bitcoin (BTCUSD) has completed 3 straight green weeks, with an impressive last 1W candle closing and started the new one right where it left. This rise shouldn't be surprising to most as it has fulfilled all the conditions that initiated all major rallies since the November 2022 Bear market bottom.
The first week of April rebounded strongly on the 1W MA50 (blue trend-line), which as mentioned numerous times on our channel, has been this Bull Cycle's main Support and kickstarted the Q4 2023 and Q4 2024 rallies.
At the same time, the 1W RSI broke last week above its MA, which has been the final confirmation of those Bullish Legs. With the 1W Bollinger Bands (BB) still ranged, the top trend-line is expected to rise aggressively as BTC's uptrend accelerates, something that resembles October 2023 and October 2024.
Throughout this Bull Cycle, those rallies have lasted around the same time, the longest being 14 weeks. As a result, the latest the current Bullish Leg tops should be on the week of July 14 2025 and a +92% rise as February - March 2024 should deliver a test of the Higher Highs trend-line around $140000.
Do you think that's the most probable scenario? Feel free to let us know in the comments section below!
-------------------------------------------------------------------------------
** Please LIKE 👍, FOLLOW ✅, SHARE 🙌 and COMMENT ✍ if you enjoy this idea! Also share your ideas and charts in the comments section below! This is best way to keep it relevant, support us, keep the content here free and allow the idea to reach as many people as possible. **
-------------------------------------------------------------------------------
💸💸💸💸💸💸
👇 👇 👇 👇 👇 👇
