GBPUSD Will Fall! Sell!
Please, check our technical outlook for GBPUSD.
Time Frame: 3h
Current Trend: Bearish
Sentiment: Overbought (based on 7-period RSI)
Forecast: Bearish
The price is testing a key resistance 1.330.
Taking into consideration the current market trend & overbought RSI, chances will be high to see a bearish movement to the downside at least to 1.319 level.
P.S
The term oversold refers to a condition where an asset has traded lower in price and has the potential for a price bounce.
Overbought refers to market scenarios where the instrument is traded considerably higher than its fair value. Overvaluation is caused by market sentiments when there is positive news.
Disclosure: I am part of Trade Nation's Influencer program and receive a monthly fee for using their TradingView charts in my analysis.
Like and subscribe and comment my ideas if you enjoy them!
Signals

EURCAD Is Going Down! Short!
Take a look at our analysis for EURCAD.
Time Frame: 5h
Current Trend: Bearish
Sentiment: Overbought (based on 7-period RSI)
Forecast: Bearish
The market is on a crucial zone of supply 1.591.
The above-mentioned technicals clearly indicate the dominance of sellers on the market. I recommend shorting the instrument, aiming at 1.578 level.
P.S
We determine oversold/overbought condition with RSI indicator.
When it drops below 30 - the market is considered to be oversold.
When it bounces above 70 - the market is considered to be overbought.
Disclosure: I am part of Trade Nation's Influencer program and receive a monthly fee for using their TradingView charts in my analysis.
Like and subscribe and comment my ideas if you enjoy them!

Lingrid | NZDUSD Consolidation PHASE Following Bullish RunPYTH:NZDUSD market is consolidating following the recent bullish run. Price action appears to be creating a triangle pattern, typically considered a continuation formation. The market consistently bounces off the support zone around the 0.59500 level, suggesting this area holds significant buying interest. After the triangle pattern completes, price will likely move to higher levels, following the pattern's characteristics as a trend continuation formation. If the market respects the support zone and channel border with a clear rejection, we can expect price to rebound and retest the trendline before potentially moving higher. My goal is resistance zone around 0.59900
Traders, if you liked this idea or if you have your own opinion about it, write in the comments. I will be glad 👩💻


DAX: Bears Are Winning! Short!
My dear friends,
Today we will analyse DAX together☺️
The price is near a wide key level
and the pair is approaching a significant decision level of 21,899.19 Therefore, a strong bearish reaction here could determine the next move down.We will watch for a confirmation candle, and then target the next key level of 21,455.49..Recommend Stop-loss is beyond the current level.
❤️Sending you lots of Love and Hugs❤️

EurJpy- Ready to rise at 166?Since mid-March, EURJPY has been in a consolidation phase. Except for the early April spike down, the pair has respected a pretty clear range between the 161.00 support and the 163.30 resistance.
Now, however, EURJPY looks ready to break to the upside. A sustained price above 163.30 would confirm this breakout and open the door for bullish momentum.
🔍 My strategy:
I’m looking to buy dips, ideally around the 162.50 area.
If the price drops and breaks below 161, that would invalidate the setup.
On the upside, the first major target is the 166.00 resistance zone.
Disclosure: I am part of Trade Nation's Influencer program and receive a monthly fee for using their TradingView charts in my analyses and educational articles.

AUDNZD BULLISH OR BEARISH DETAILED ANALYSISAUDNZD has finally broken out of a well-formed falling wedge pattern on the 12H timeframe, signaling a potential bullish reversal. After a sustained downtrend, price consolidated within the wedge, indicating decreasing bearish momentum. The recent breakout confirms buyer strength and opens the door for a fresh upside swing. The current price sits around 1.072, and based on technical structure and projected pattern targets, we could be heading towards the 1.105 zone.
From a fundamental standpoint, the Australian Dollar is gaining support due to rising commodity demand and hawkish tones from the RBA, hinting at a possibility of sustained higher interest rates. On the other hand, the New Zealand Dollar has been under pressure due to softer-than-expected CPI data and growing speculation that the RBNZ might be done with its tightening cycle. This divergence in central bank stance adds fuel to the AUDNZD bullish narrative. Today’s macro releases show stable Australian employment data and a dip in New Zealand’s retail figures, which further supports the bullish view.
This setup offers a solid risk-to-reward ratio, especially with a clean invalidation below 1.062. If the momentum sustains, price may accelerate quickly toward the 1.105 target. Market participants should also keep an eye on DXY (US Dollar Index) correlations and global risk sentiment, which could amplify volatility across AUD and NZD pairs.
As a professional trader, I’ll be monitoring price action closely near lower timeframes for confirmation entries and managing the trade with dynamic stop-loss adjustments. This breakout is technically clean, fundamentally supported, and strategically aligned with the current macro backdrop – making it a high-probability swing setup worth sharing.

Nasdaq on Thin Ice? Smart Money is Bearish!📊 COT Analysis – NASDAQ E-MINI Futures
Asset Managers → Consistently net long, but without accumulation: showing little conviction on new lows.
Leveraged Money → Confirmed aggressive shorts, a clear sign that smart money doesn't believe in the bounce.
✅ COT Conclusion:
Smart money is not buying the dip → fundamental bias = bearish.
🧠 Technical Breakdown + My Long Trade
📉 Structure:
Strong rejection from the 16,700–17,300 zone, with a long weekly wick = signs of accumulation.
Price formed a double bottom + weekly engulfing candle, right on the demand zone → confirming strong buyer pressure.
🎯 My Long Trade (LIVE SETUP):
Entry: After confirmation of bullish price action on the blue demand zone
Target: Supply zone 20,400–21,000
Exit: Closed just before the drop → perfect trade management, respecting structure and weekly resistance
📈 Post-trade context:
Price then rejected violently from that zone → we’re now back around 18,400, and if 18,000 breaks, the door opens toward 16,700.
🧭 What’s Next?
🔹 If price pulls back to 19,200–19,500, I’ll look for a short setup
🔹 If it breaks below 18,000 → clean path toward 16,700–16,500
✅ Trade Summary
🔥 Long from structural demand zone → exit at weekly supply
🧠 Setup based on price action + RSI and structural confluence
🐻 Now the bias shifts back to bearish: watch the 18k level closely

BITCOIN $140k will come sooner than you think!Bitcoin (BTCUSD) eventually made the strong rebound we've been talking about on the highly important Support cluster of: a) the 1W MA50 (blue trend-line), b) the former All Time High (ATH) trend-line and c) the Higher Lows Zone of the current Bull Cycle.
This Triple Hold Move is expected to produce the strongest rally of the Bull Cycle, the Parabolic Rally. But even if it is similar to the 'weakest' rally of this Cycle, then we should be expecting at least a +92.94% rise from the bottom, which translates to a price marginally above $140000. And that could come as early as this August.
So do you think we'll be seeing a rally at least as strong as last year's? Feel free to let us know in the comments section below!
-------------------------------------------------------------------------------
** Please LIKE 👍, FOLLOW ✅, SHARE 🙌 and COMMENT ✍ if you enjoy this idea! Also share your ideas and charts in the comments section below! This is best way to keep it relevant, support us, keep the content here free and allow the idea to reach as many people as possible. **
-------------------------------------------------------------------------------
💸💸💸💸💸💸
👇 👇 👇 👇 👇 👇

GBP/NZD Breakdown Imminent? Smart Money and Seasonality Say YES!🧠 1. Price Action & Technical Structure
Price was firmly rejected from the monthly supply zone between 2.33 – 2.35, marked by strong bearish candles.
A bounce occurred at the weekly demand between 2.20 – 2.22, where accumulation and a short-term reversal formed (dashed white arrow).
Currently, price is trading near the lower bound of a compression range (2.22 – 2.26), sitting below a key intermediate resistance (dark teal zone).
RSI is in the neutral-to-low zone, with no major divergence, leaving room for further downside.
Technical Bias: Neutral to Bearish unless we get a weekly close above 2.26–2.27.
📊 2. COT Data
GBP
Asset Managers remain net short, though improving since January.
Leveraged Money sharply reducing long exposure since early April → Institutional bullish sentiment weakening.
NZD
Asset Managers have been heavily short for over a year, but shorts are being reduced since February → slight sentiment recovery.
Leveraged Money flat, with no clear long build-up yet.
➡️ Combined COT Outlook: The GBP's advantage over NZD is fading. This supports a sideways to slightly bearish outlook on GBP/NZD.
📅 3. Seasonality
April: Historically bearish for GBP/NZD (–0.2971 avg.), aligning with current downward move.
May: Also typically bearish (–0.2964 avg.) → suggesting potential continued weakness.
➡️ Seasonal Bias: Bearish through mid-to-late May.
🧠 4. Retail Sentiment
Around 70% of retail traders are long GBP/NZD → classic contrarian bearish signal.
Average long entry: 2.1800, current price: 2.2246 → many longs in profit.
Potential for profit taking or breakeven pullback adds to bearish pressure.
📌 Trade Plan Summary
Weekly Bias: → Bearish / Range-bound
📉 Short Zones of Interest:
2.26 – 2.27 → key resistance zone
Stop above 2.2850 (H4/H1 close above invalidates setup)
🎯 Targets:
2.2050 → recent demand re-test
2.1850 / 2.1650 → deeper demand zones visible on chart
🧠 Invalidation Level:
Daily close above 2.2850 → structure turns bullish

USDJPY – Searching for a Bottom After a Brutal DropSince the start of the year, USDJPY has been in an almost free fall, losing nearly 2,000 pips and breaking multiple key supports, including the critical 150 level.
Yesterday, we even saw a spike below 140, a level not touched for quite some time.
🔄 However, after that spike, the pair reversed sharply to the upside, showing strong demand in that area.
Interestingly, this zone was tested at the start of 2024 and again back in September, adding even more technical relevance.
📊 Despite the poor outlook for the USD overall, I now expect a meaningful rebound from here, aiming for a retest of the former 146 support, which has now turned into resistance.
💡 Trading Plan:
I will be looking to buy dips near the current support, targeting a 1:3 Risk/Reward setup toward the 146 resistance area.
Disclosure: I am part of Trade Nation's Influencer program and receive a monthly fee for using their TradingView charts in my analyses and educational articles.

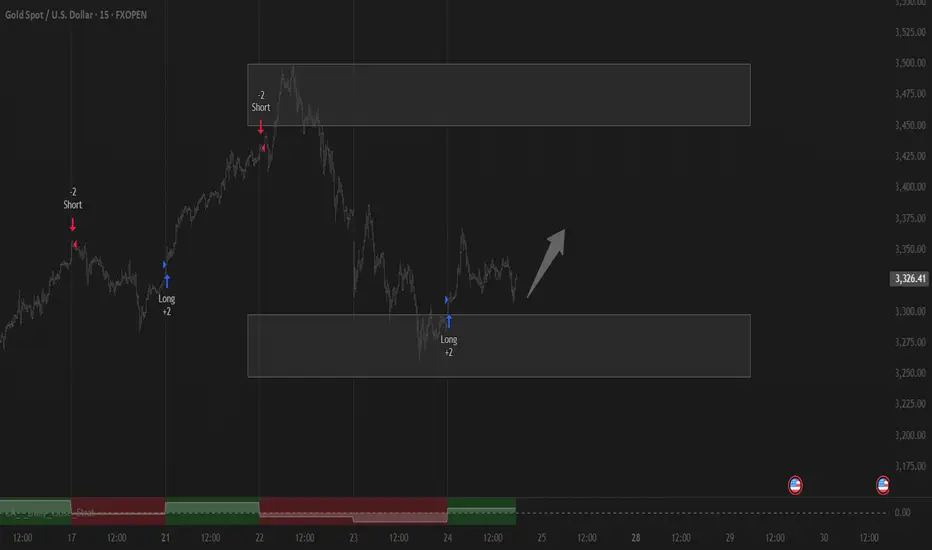
Gold Analysis – New Leg of Correction Incoming?It’s been a “special” week for Gold, with wild swings that kept me mostly on the sidelines – except for Monday’s take profit. Now, however, the market is starting to show more clarity.
❓ Has the Market Topped Out?
After a dip to 3260, the price reversed sharply, gaining over 1,000 pips to reach 3367. Yet, both recent attempts to push higher were rejected.
Now, with the spike from 3360 to 3500 looking like a blow-off top, the stage seems set for a new leg of correction.
🔍 Key Technical Signs:
• Heavy selling pressure near recent highs.
• Price action suggests buyers are exhausted.
• 3370 becomes a key resistance – as long as it holds, bearish setups are favored.
📉 Trading Plan:
My approach is simple:
👉 Sell rallies
🎯 Target: a 1,000+ pip drop if 3370 remains intact.
Disclosure: I am part of Trade Nation's Influencer program and receive a monthly fee for using their TradingView charts in my analyses and educational articles.

EUR/USD: Is the Uptrend Losing Steam?EUR/USD has had an exceptionally strong month, gaining over 7% from bottom to top – one of the best performances in EUR’s history against the dollar.
But now, things are starting to shift.
🧭 Possible Long-Term Trend Change?
Beyond the impressive rally, the bigger story might be the potential shift in the long-term trend. However, after such a sharp move up, a correction is not only likely – it may already be underway.
🔍 Technical Outlook:
- Price pushed above the key 1.15 psychological level but failed to hold momentum.
- A bearish consolidation is forming.
- A classic Head and Shoulders pattern appears to be developing, with a neckline near 1.13.
- A break of that level could open the door for a deeper retracement, with a target around 1.11.
🛠️ Trading Plan:
I’m looking to sell rallies, ideally near 1.1450, to maintain a 1:3 risk-to-reward ratio.
Disclosure: I am part of Trade Nation's Influencer program and receive a monthly fee for using their TradingView charts in my analyses and educational articles.

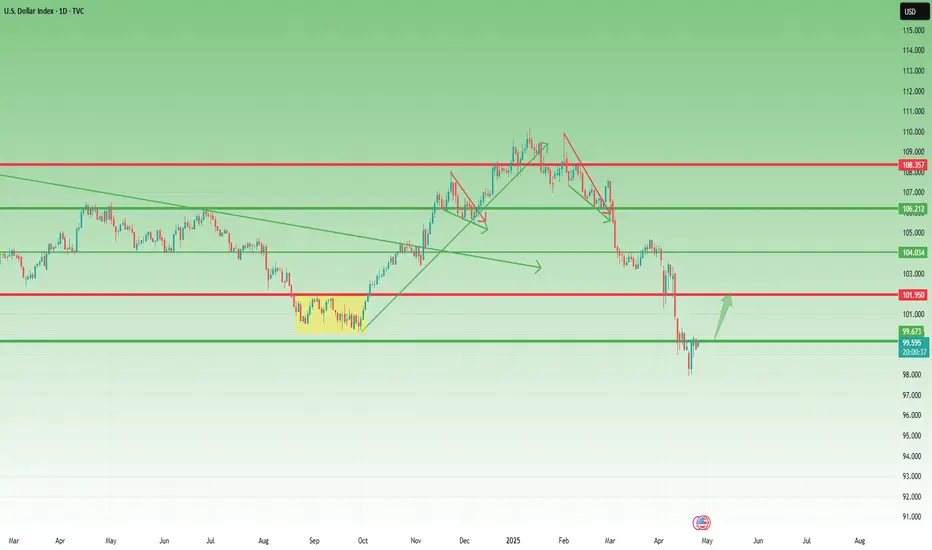
USD Index: A Possible Reversal in Sight?Since early February, right after Trump’s inauguration, the USD Index (DXY) has been under pressure, falling sharply by over 10%.
However, after hitting the 98.00 level, things seem to have stabilized. We're seeing the early signs of a relief rally.
🔍 Technical Perspective:
- This week’s candlestick pattern suggests a bullish reversal.
- The dip on Wednesday was quickly bought, showing buyer interest.
- A minor correction occurred yesterday, but dips are being well supported.
- Currently, the DXY trades around 99.60, just under the psychological level of 100.
🎯 Outlook:
As long as 98 remains intact, the bias shifts towards a potential rebound.
First target: 102 – a logical resistance zone and prior support.
This is not yet a confirmed trend reversal, but the price action is shifting. The key now is how the market reacts around the 100 level. A break above could trigger further bullish momentum.
CRUDE OIL BEARISH WEDGE|SHORT|
✅CRUDE OIL has formed a
Bearish wedge pattern and
Then made a breakout and a
Pullback so we are locally
Bearish biased and we will
Be expecting a further
Bearish move down
SHORT🔥
✅Like and subscribe to never miss a new idea!✅
Disclosure: I am part of Trade Nation's Influencer program and receive a monthly fee for using their TradingView charts in my analysis.

DAX Resistance Ahead! Sell!
Hello,Traders!
DAX is trading in a strong
Uptrend, recovering itself
From the trade-war lows
And the index is locally
Overbought so after the
Retest of the horizontal
Resistance above at 22,500
We will be expecting a local
Bearish correction
Sell!
Comment and subscribe to help us grow!
Check out other forecasts below too!
Disclosure: I am part of Trade Nation's Influencer program and receive a monthly fee for using their TradingView charts in my analysis.

SILVER GROWTH AHEAD|LONG|
✅SILVER is trading in an
Uptrend and the price made
A bullish breakout of the key
Round horizontal level of 33.00$
Then made a pullback and is
Going up now so we are bullish
Biased and we will be expecting
A further bullish move up
LONG🚀
✅Like and subscribe to never miss a new idea!✅
Disclosure: I am part of Trade Nation's Influencer program and receive a monthly fee for using their TradingView charts in my analysis.

CAD-CHF Will Keep Growing! Buy!
Hello,Traders!
CAD-CHF is trading in a
Local uptrend and the pair
Made a bullish breakout
Of the key horizontal level
Of 0.5939 so we are bullish
Biased and now that the
Pair is going up again we
Will be expecting a
Further bullish continuation
Buy!
Comment and subscribe to help us grow!
Check out other forecasts below too!
Disclosure: I am part of Trade Nation's Influencer program and receive a monthly fee for using their TradingView charts in my analysis.

NZD_CAD RESISTANCE AHEAD|SHORT|
✅NZD_CAD is going up to retest
A horizontal resistance of 0.8350
Which makes me locally bearish biased
And I think that we will see a pullback
And a move down from the level
Towards the target below at 0.8275
SHORT🔥
✅Like and subscribe to never miss a new idea!✅
Disclosure: I am part of Trade Nation's Influencer program and receive a monthly fee for using their TradingView charts in my analysis.

NZD-JPY Will Go UP! Buy!
Hello,Traders!
NZD-JPY made a bullish
Breakout of the key horizontal
Level of 85.100 then made a
Local pullback and is going up
Now so we are bullish biased
And we will be expecting a
Further bullish move up
Buy!
Comment and subscribe to help us grow!
Check out other forecasts below too!
Disclosure: I am part of Trade Nation's Influencer program and receive a monthly fee for using their TradingView charts in my analysis.

ETHUSD Will Go Up From Support! Long!
Take a look at our analysis for ETHUSD.
Time Frame: 8h
Current Trend: Bullish
Sentiment: Oversold (based on 7-period RSI)
Forecast: Bullish
The market is testing a major horizontal structure 1,754.52.
Taking into consideration the structure & trend analysis, I believe that the market will reach 1,966.56 level soon.
P.S
Overbought describes a period of time where there has been a significant and consistent upward move in price over a period of time without much pullback.
Disclosure: I am part of Trade Nation's Influencer program and receive a monthly fee for using their TradingView charts in my analysis.
Like and subscribe and comment my ideas if you enjoy them!

AUDUSD Will Go Down! Short!
Here is our detailed technical review for AUDUSD.
Time Frame: 1D
Current Trend: Bearish
Sentiment: Overbought (based on 7-period RSI)
Forecast: Bearish
The market is approaching a significant resistance area 0.638.
Due to the fact that we see a positive bearish reaction from the underlined area, I strongly believe that sellers will manage to push the price all the way down to 0.622 level.
P.S
The term oversold refers to a condition where an asset has traded lower in price and has the potential for a price bounce.
Overbought refers to market scenarios where the instrument is traded considerably higher than its fair value. Overvaluation is caused by market sentiments when there is positive news.
Disclosure: I am part of Trade Nation's Influencer program and receive a monthly fee for using their TradingView charts in my analysis.
Like and subscribe and comment my ideas if you enjoy them!

EURJPY Will Move Lower! Sell!
Take a look at our analysis for EURJPY.
Time Frame: 1D
Current Trend: Bearish
Sentiment: Overbought (based on 7-period RSI)
Forecast: Bearish
The market is on a crucial zone of supply 162.022.
The above-mentioned technicals clearly indicate the dominance of sellers on the market. I recommend shorting the instrument, aiming at 159.493 level.
P.S
We determine oversold/overbought condition with RSI indicator.
When it drops below 30 - the market is considered to be oversold.
When it bounces above 70 - the market is considered to be overbought.
Disclosure: I am part of Trade Nation's Influencer program and receive a monthly fee for using their TradingView charts in my analysis.
Like and subscribe and comment my ideas if you enjoy them!
