Staying above $3,000, risk cools but still supports GOLDOANDA:XAUUSD prices corrected lower and then recovered slightly, maintaining price action above the $3,000 flat level, which is an important support for the short-term bullish outlook, as US President Trump eased his stance on imposing tariffs on trade partners and market risk appetite increased significantly, putting pressure on safe-haven assets such as gold. In addition, gold prices were also dragged down by the US Dollar hitting a more than two-week high.
OANDA:XAUUSD prices have hit a record high 16 times this year, reaching an all-time high of $3,057.21/oz last week.
Trump May Exempt Some Countries from Tariffs, Wall Street Optimistic
Trading sentiment on Wall Street was positive as US President Trump suggested a partial delay in some tariffs originally scheduled to be imposed on April 2.
According to the Wall Street Journal, US President Trump said he may reduce retaliatory tariffs scheduled to be imposed on US trading partners next month and some countries may be exempted.
According to Bloomberg, US President Trump announced on April 2 that he would impose tariffs on specific countries instead of reciprocal tariffs on most countries. These measures target the so-called “Dirty 15” trading partners.
Trump’s tariff policy stance has shown signs of softening, easing investors’ concerns about the risk of a global trade war.
Gold is traditionally seen as a safe investment during times of geopolitical and economic uncertainty, and it typically performs well in low-interest-rate environments.
The Federal Reserve kept interest rates unchanged last week, signaling the possibility of two 25-basis-point cuts this year.
U.S. and Russian officials are holding talks in Saudi Arabia in hopes of making progress on a broad ceasefire in Ukraine. Washington also hopes to negotiate a separate maritime ceasefire in the Black Sea before reaching a broader agreement.
Overall, the market is showing some signs of cooling down, providing the possibility of a correction for gold prices after a long period of consecutive increases. However, in terms of the overall market picture, gold is still fundamentally on the rise, as potential risks still appear frequently and any unexpected impact from geopolitical and trade risks will also cause gold prices to increase strongly.
Technical outlook analysis of OANDA:XAUUSD
On the daily chart, gold corrects lower but remains fixed above the base price of 3,000 USD, which is noted as an important support for the short-term bullish outlook, sent to readers in the previous issue.
In the short term, the upside target is around 3,021 USD, the price point of the 0.50% Fibonacci extension, once this level is broken on gold, it can continue to increase with the target of 3,051 USD in the short term, more than the all-time high then the 0.618% Fibonacci extension.
Overall, as long as gold remains within the price channel, above the EMA21, it still has a bullish technical outlook, the current price declines should only be considered as a short-term correction without changing the main trend.
During the day, the technical uptrend of gold will be focused again as follows.
Support: 3,000 – 2,977 USD
Resistance: 3,021 – 3,051 – 3,057 USD
SELL XAUUSD PRICE 3037 - 3035⚡️
↠↠ Stoploss 3041
→Take Profit 1 3029
↨
→Take Profit 2 3023
BUY XAUUSD PRICE 2978 - 2980⚡️
↠↠ Stoploss 2974
→Take Profit 1 2986
↨
→Take Profit 2 2992
Signals

NATGAS - NEW BREAKDOWNHello Traders !
On Monday 10 March, The NATGAS reached the resistance level (4.730 - 4.986).
Currently, The support level (4.368 - 4.218) is broken !
This key level becomes new resistance.
So, I expect a bearish move📉
______________
TARGET: 3.885🎯

GOOGLE Bottom confirmed. Laying eyes on $220.Alphabet Inc. (GOOG) has been trading within a Channel Up since the July 10 2024 High. Last week, the Bearish Leg touched the pattern's bottom, completing a -23.92% decline from the top, which is almost symmetrical to the previous Bearish Leg (-23.32%).
At the same time the 1D RSI got oversold (<30.00) and recovered on a Bullish Divergence, while the 1D MA50 (blue trend-line) crossed below the 1D MA100 (green trend-line), forming a Bearish Cross. Last time we had this formation was September 06 2024 and 1 day later, the bottom (Higher Low of the Channel Up) was formed.
Among all this, the 1W MA100 (red trend-line) is holding, which is the market's long-term Support since July 12 2023. As a result, we expect the new Bullish Leg to start and as the previous one did, target the 1.236 Fibonacci extension at $220.00.
-------------------------------------------------------------------------------
** Please LIKE 👍, FOLLOW ✅, SHARE 🙌 and COMMENT ✍ if you enjoy this idea! Also share your ideas and charts in the comments section below! This is best way to keep it relevant, support us, keep the content here free and allow the idea to reach as many people as possible. **
-------------------------------------------------------------------------------
💸💸💸💸💸💸
👇 👇 👇 👇 👇 👇

GOLD LONG SIGNAL|
✅GOLD made a retest of the
Horizontal support of 3000$
And we are seeing a bullish
Reaction so we are bullish
Biased and we can enter
A long trade with the TP
Of 3023$ and the SL of 2997$
LONG🚀
✅Like and subscribe to never miss a new idea!✅
Disclosure: I am part of Trade Nation's Influencer program and receive a monthly fee for using their TradingView charts in my analysis.

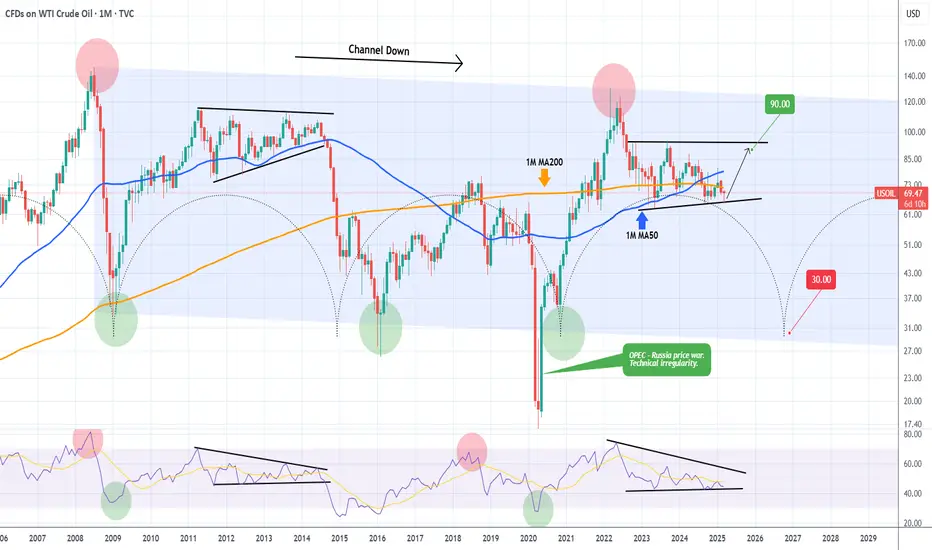
WTI OIL Ultimate long-term guide.WTI Oil (USOIL) has a tendency, like a number of key traditional assets, to follow long-term Cycles. Market psychology more times than not makes investors and the market behave in similar ways (euphoria buying, panic selling) given the same market conditions. Fundamentals and catalysts can often be used as reasons and excuses to confirm the technical trends and long-term Cycles.
Oil is no different and on this 1M time-frame analysis we see why. The dominant multi-year pattern is a Channel Down and it has started on the July 2008 All Time High (ATH). Right now it appears that we are inside a Wedge pattern similar to 2011 - 2014 and more specifically on the final Bullish Leg towards the top.
The 1M RSI sequence among those two fractals is identical so based on all these parameters we believe WTI will test $90.00 by late 2025 - early 2026 and if rejected, start a brutal long-term sell-off towards the bottom of the Channel Down and the 35.00 - 30.00 range by late 2026 as the Time Cycles suggest.
-------------------------------------------------------------------------------
** Please LIKE 👍, FOLLOW ✅, SHARE 🙌 and COMMENT ✍ if you enjoy this idea! Also share your ideas and charts in the comments section below! This is best way to keep it relevant, support us, keep the content here free and allow the idea to reach as many people as possible. **
-------------------------------------------------------------------------------
💸💸💸💸💸💸
👇 👇 👇 👇 👇 👇
Trading balanceThe price is currently in the resistance zone and has prospects of entering the balance zone. If the balance zone is overcome, the price is able to reach the target near the opposite resistance zone.

GBP/JPY - Buy SignalFree Trade Setup:
Long: Limit Order @194.046 SL@193.339 TP@196.743
Follow me for more opportunities

S&P500 This is the buy opportunity of the year for a 7000 TargetThe S&P500 index (SPX) is in the process of posting its 2nd straight green 1W candle, following a streak of 4 red weeks since the February 17 peak. That streaκ was technically the Bearish Leg of the 1.5-year Channel Up and as you can see, it made a direct contact with its bottom (Higher Lows trend-line).
As the same time, the 1W RSI almost touched the 40.00 Support that priced the October 23 2023 Low, which was the previous Higher Low of the Channel Up. The similarities don't stop there as both Bearish Legs had approximately a -10.97% decline, the strongest within that time-frame.
The Bullish Leg that followed that bottom initially peaked on a +28.85% rise, almost touching the 2.236 Fibonacci extension. Assuming the symmetry holds between the Bullish Legs as well, we can be expecting the index to start the new Bullish Leg now and target 7000 by the end of the year, which is marginally below both the 2.236 Fib ext and a potential +28.85% rise.
This may indeed be the best buy opportunity for 2025.
-------------------------------------------------------------------------------
** Please LIKE 👍, FOLLOW ✅, SHARE 🙌 and COMMENT ✍ if you enjoy this idea! Also share your ideas and charts in the comments section below! This is best way to keep it relevant, support us, keep the content here free and allow the idea to reach as many people as possible. **
-------------------------------------------------------------------------------
Disclosure: I am part of Trade Nation's Influencer program and receive a monthly fee for using their TradingView charts in my analysis.
💸💸💸💸💸💸
👇 👇 👇 👇 👇 👇

EURUSD - 2 ScenariosHello Traders !
On Tuesday 11 March, Th EURUSD reached the resistance level (1.09374 - 1.09058).
So, We have 2 Scenarios:
BULLISH SCENARIO:
If the market breaks above the resistance level and closes above that,
We will see a bullish move📈
TARGET: 1.11580🎯
BEARISH SCENARIO:
If the price breaks and closes below the neckline,
We will see a huge bearish move📉
TARGET: 1.06350🎯

BITCOIN historically sees huge rally when Gold peaks. This time?Bitcoin (BTCUSD) is coming, slowly but surely, out of a consolidation following the test and hold of its 1W MA50 and one of the reasons it is about to rally strongly may be flying under the radar for the majority.
That reason has to do with Gold (XAUUSD) and its long-term Cycles. As you can see on this 1W chart, every time Gold peaked in the past 10 years, BTC started the parabolic rally of its Bull Cycle. Equally during Gold's past 2 Cycles, when it revisited that peak and tested that Resistance, it made a Double Top and declined again, which for Bitcoin was translated into a Bear Cycle confirmation.
With the help of the Sine Waves, we can be expecting that Gold Double Top in early April 2026, which means that by that time BTC will already be in its new Bear Cycle. As a result, it is suggested be already out of the market with our profits by the end of 2025.
So based on all that, if Gold makes its Cycle Top now, which is highly likely, Bitcoin will start a parabolic rally. Now, will it be the strongest of its Bull Cycle as the past Cycles suggested? Could be, but even if its not, it should be enough to replicate the late 2024 one and give one final opportunity for profit making.
But what do you think? Is Gold's potential peak here give a very favorable rally to Bitcoin? Feel free to let us know in the comments section below!
-------------------------------------------------------------------------------
** Please LIKE 👍, FOLLOW ✅, SHARE 🙌 and COMMENT ✍ if you enjoy this idea! Also share your ideas and charts in the comments section below! This is best way to keep it relevant, support us, keep the content here free and allow the idea to reach as many people as possible. **
-------------------------------------------------------------------------------
💸💸💸💸💸💸
👇 👇 👇 👇 👇 👇

Lingrid | GBPJPY trend CONTINUATION Following a BreakoutThe price perfectly fulfilled my last idea . It hit the TP level. The overall FX:GBPJPY price action is forming an ABC move, with the C point completing around the 196.000 level. Recently, the price broke and closed above both the downward trendline and the support level at 194.000. Currently, it is testing last week's high, which coincides with the psychological level of 195.000. On the daily timeframe, a big bullish candle has formed, indicating bullish dominance. I believe the price may create a range zone at this level before continuing higher and potentially breaking out of the PWH. My goal is resistance zone at 195.750
Traders, If you liked this educational post🎓, give it a boost 🚀 and drop a comment 📣

US500 Is Bearish! Sell!
Here is our detailed technical review for US500.
Time Frame: 4h
Current Trend: Bearish
Sentiment: Overbought (based on 7-period RSI)
Forecast: Bearish
The market is approaching a significant resistance area 5,754.53.
Due to the fact that we see a positive bearish reaction from the underlined area, I strongly believe that sellers will manage to push the price all the way down to 5,665.70 level.
P.S
Overbought describes a period of time where there has been a significant and consistent upward move in price over a period of time without much pullback.
Disclosure: I am part of Trade Nation's Influencer program and receive a monthly fee for using their TradingView charts in my analysis.
Like and subscribe and comment my ideas if you enjoy them!

USOIL Is Very Bearish! Short!
Take a look at our analysis for USOIL.
Time Frame: 9h
Current Trend: Bearish
Sentiment: Overbought (based on 7-period RSI)
Forecast: Bearish
The market is on a crucial zone of supply 69.379.
The above-mentioned technicals clearly indicate the dominance of sellers on the market. I recommend shorting the instrument, aiming at 67.044 level.
P.S
Please, note that an oversold/overbought condition can last for a long time, and therefore being oversold/overbought doesn't mean a price rally will come soon, or at all.
Disclosure: I am part of Trade Nation's Influencer program and receive a monthly fee for using their TradingView charts in my analysis.
Like and subscribe and comment my ideas if you enjoy them!

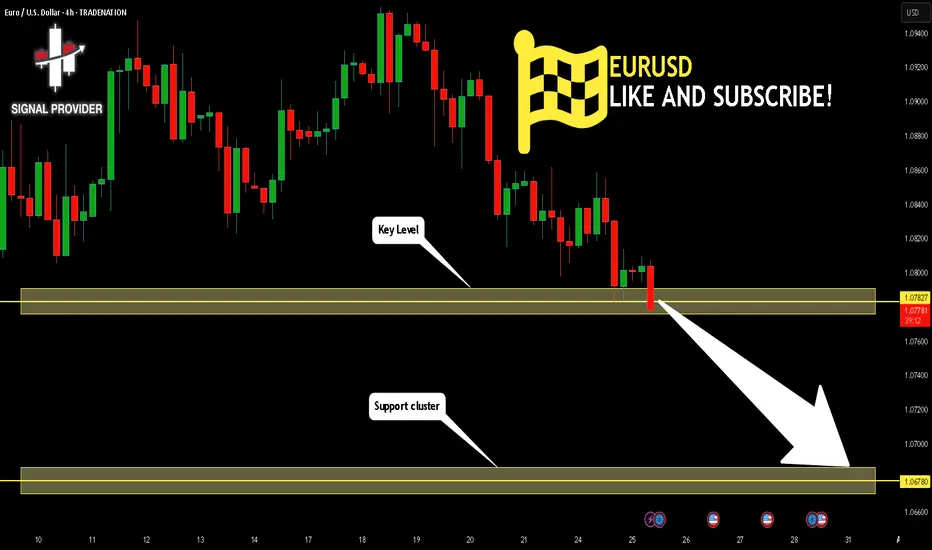
EURUSD Is Going Down! Sell!
Please, check our technical outlook for EURUSD.
Time Frame: 4h
Current Trend: Bearish
Sentiment: Overbought (based on 7-period RSI)
Forecast: Bearish
The price is testing a key resistance 1.078.
Taking into consideration the current market trend & overbought RSI, chances will be high to see a bearish movement to the downside at least to 1.067 level.
P.S
The term oversold refers to a condition where an asset has traded lower in price and has the potential for a price bounce.
Overbought refers to market scenarios where the instrument is traded considerably higher than its fair value. Overvaluation is caused by market sentiments when there is positive news.
Disclosure: I am part of Trade Nation's Influencer program and receive a monthly fee for using their TradingView charts in my analysis.
Like and subscribe and comment my ideas if you enjoy them!
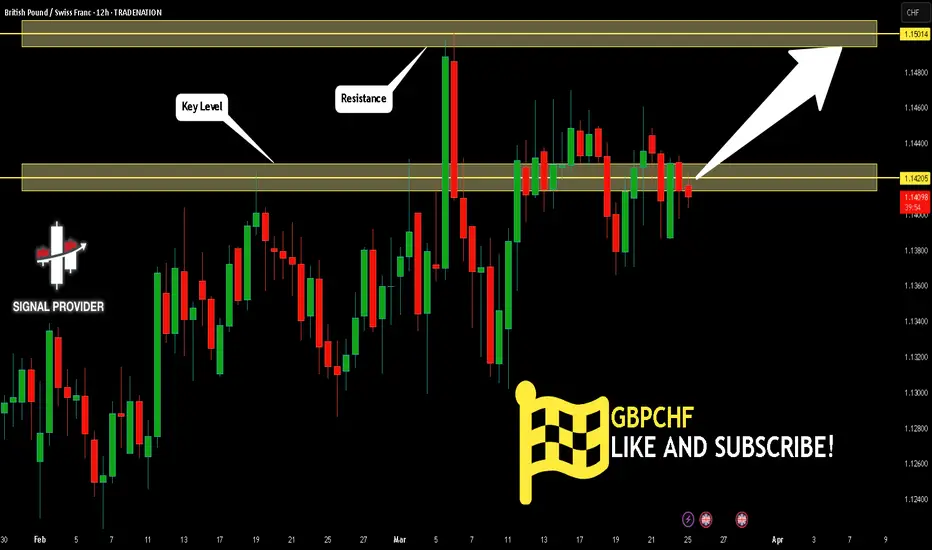
GBPCHF Will Grow! Long!
Here is our detailed technical review for GBPCHF.
Time Frame: 12h
Current Trend: Bullish
Sentiment: Oversold (based on 7-period RSI)
Forecast: Bullish
The market is trading around a solid horizontal structure 1.142.
The above observations make me that the market will inevitably achieve 1.150 level.
P.S
We determine oversold/overbought condition with RSI indicator.
When it drops below 30 - the market is considered to be oversold.
When it bounces above 70 - the market is considered to be overbought.
Disclosure: I am part of Trade Nation's Influencer program and receive a monthly fee for using their TradingView charts in my analysis.
Like and subscribe and comment my ideas if you enjoy them!
Lingrid | TRXUSDT sideways MARKET Movement. Long OpportunityThe price perfectly fulfilled my last idea . It reached the target level. BINANCE:TRXUSDT market recently made a fake break of the previous support level before bouncing back and reaching the upper boundary of the channel. When we zoom out, it's clear that the price has been consolidating for two months. Notably, the market has created a range zone at support level around 0.2200, with the price rebounding from this level multiple times, indicating its importance to the market. I think the price may move upward from this support, retest the trendline, and potentially approach the channel's upper boundary. My goal is resistance zone at 0.2370
Traders, If you liked this educational post🎓, give it a boost 🚀 and drop a comment 📣

GBPJPY Will Go Higher! Buy!
Here is our detailed technical review for GBPJPY.
Time Frame: 2h
Current Trend: Bullish
Sentiment: Oversold (based on 7-period RSI)
Forecast: Bullish
The market is approaching a significant support area 193.677.
The underlined horizontal cluster clearly indicates a highly probable bullish movement with target 194.756 level.
P.S
The term oversold refers to a condition where an asset has traded lower in price and has the potential for a price bounce.
Overbought refers to market scenarios where the instrument is traded considerably higher than its fair value. Overvaluation is caused by market sentiments when there is positive news.
Disclosure: I am part of Trade Nation's Influencer program and receive a monthly fee for using their TradingView charts in my analysis.
Like and subscribe and comment my ideas if you enjoy them!

GBPJPY: Pullback From Resistance 🇬🇧🇯🇵
There is a high chance that GBPJPY will retrace from the underlined
resistance zone.
A formation of a bearish engulfing candle indicates a strong
bearish pressure.
With a high probability, the price will drop to 194.0 level.
❤️Please, support my work with like, thank you!❤️
I am part of Trade Nation's Influencer program and receive a monthly fee for using their TradingView charts in my analysis.

CAD_JPY POTENTIAL LONG|
✅CAD_JPY made a bullish
Breakout of the key horizontal
Level of 104.800 and the breakout
Is confirmed which reinforces our
Bullish bias and makes us expect
A further move up after the
Retest of the new support
LONG🚀
✅Like and subscribe to never miss a new idea!✅
Disclosure: I am part of Trade Nation's Influencer program and receive a monthly fee for using their TradingView charts in my analysis.

Gold Trend for Today : 25th March '25On Tuesday, March 25, 2025, I don’t have real-time market data to confirm the exact trend for gold (XAUUSD) today, but I can analyze the levels you’ve provided—upper resistance at 3035–3060 and a downward trend toward 3000 and 2960—based on available context, recent forecasts, and sentiment.
Current Drivers:
Bearish Pressure: A stronger USD (possibly tied to Trump’s tariff rhetoric, per News18) and reduced safe-haven flows if geopolitical tensions ease could push gold lower today. X sentiment notes a “fluctuating upward trend” turning into a high adjustment, hinting at consolidation or a dip.
Bullish Counter: Industrial demand and central bank buying (World Gold Council: 1,000+ tons in 2024, accelerating in Q4) might limit the downside, keeping 3000 as a floor unless a major catalyst shifts sentiment.
Conclusion
Gold’s trend today, per your levels, suggests a bearish tilt: testing resistance at 3035–3060 and moving toward 3000, potentially 2960 if support fails.

CRUDE OIL Will Go Up After Pullback! Buy!
Hello,Traders!
CRUDE OIL is trading in a
Local uptrend and the price
Made a strong bullish breakout
Of the key horizontal level
Of 68.40$ so after a pullback
And a retest of the new support
We will be expecting a further
Bullish move up
Buy!
Comment and subscribe to help us grow!
Check out other forecasts below too!
Disclosure: I am part of Trade Nation's Influencer program and receive a monthly fee for using their TradingView charts in my analysis.

XAUUSD SELL NEXT MOVE STRATEGY DOWN Potential Bullish Scenario
The analysis assumes a strong downward move, but buyers could defend key support levels, especially near strategy support and double-top strong support.
If the price holds above these levels and forms a reversal pattern (like a double bottom or bullish engulfing candle), we could see a rally back to sell zone and double top resistance.
2. Market Structure Shift
The assumption here is a continuation of the downtrend, but a breakout above the resistance zones could invalidate this bearish bias.
A fake breakdown below support could trap sellers and fuel a short squeeze rally.
3. Fundamentals & News Events
If there’s any fundamental catalyst (e.g., Fed announcement, inflation data, geopolitical tension), the market could reverse direction unexpectedly.
Gold tends to react strongly to macroeconomic events, so technical analysis alone might not be enough to predict the next move

AUDNZD - Bearish Double TOPHello Traders !
The AUDNZD failed to create a new higher high !
The price formed a double TOP pattern.
Currently, The neckline is broken !
So, I predict a bearish move📉
_____________
TARGET: 1.08970🎯

Daily bias for Spot gold #xauusd I have spotted an absolute Low so we should definitely see some bullish pressure on gold for the rest of the day
Take a look at my markup as I have marked previous day high and low and from experience determined that the previous days low is an absolute low so we should definitely see some bullish pressure building up as the day goes on.
