My Full ES/SPX Plan for Tmmr Sept. 6thPlan for Friday: **Supports:** 5512, 5502, 5494 (major), 5482 (major), 5476, 5474 (major), 5462, 5455 (major), 5450, 5445 (major), 5438 (major), 5428, 5423, 5414 (major).
**Levels to Bid:**
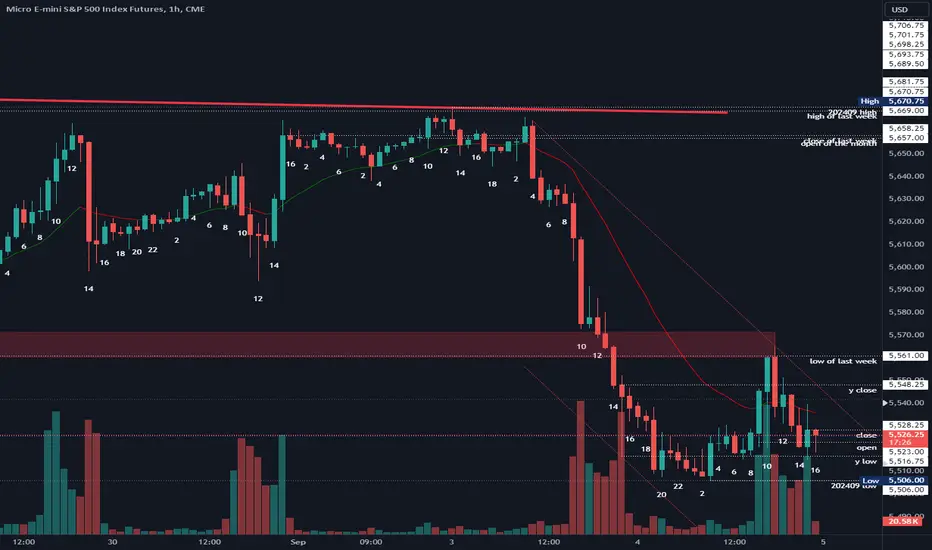
- I am still holding my 10% long runner from the **5493** knife carch idea that played out this afternoon. I have added long exposure around **5513**, risking 25% of today’s profits.
- We are currently in a new chop range between **5493 and 5554**, with **5519** acting as a key middle point. This has been tested 14 times since yesterday, so it’s no longer fresh but still worth watching for failed breakdowns as always.
- **5494** is next major support below, though it’s risky to buy directly after today’s test, especially with the NFP report coming tomorrow morning. Ideally, I'd like to see it flush and recover, perhaps testing **5482** or **5474** before reclaiming for a safer entry.
- Below **5492**, I consider this "knife catch mode," meaning supports will likely fail, so I’d be careful with longs, snd treat with smaller size than normal . However, **5455** and **5438** are key levels to watch for buy reactions if price starts flushing down aggressively.
**Resistances:** 5519 (major), 5524, 5528-30 (major), 5537, 5543, 5554 (major), 5560, 5566, 5574, 5577, 5582-86 (major), 5593, 5598, 5605 (major).
- With NFP tomorrow, we could see a violent rally, and I am not interested in shorting strength in ES. For those looking to short, **5582-86** is a logical spot, where we broke down earlier this week and have yet to backtest.
**Buyers Case Tomorrow:**
- Currently, ES has an active failed breakdown present. The key is for **5492** to hold, allowing buyers to defend this level and potentially reclaim **5519**.
- The path forward for buyers would then be targeting **5528-30**, **5554**, and eventually **5582-86** for a dip and push toward **5630**.
**Sellers Case Tomorrow:**
- Begins with the failure of **5493**. As i mentioned often though, breakdown trades below this a support are tricky, advanced setups, as most breakdowns trap (80% fail), and these are low-win-rate, high-risk/reward trades. So keep that in mind. Properly reading volume is the key to these type of trades.
- Generally, I’d want to see 5493 tested/one more failed breakdown of the zone (ideally down to 5483 that recovers). After this, I’d consider short perhaps 5486. Level to level profit takes, as always, but we likely get down to 5455.
In general, We have gone nowhere for two days. My general lean is that 5493 and 5519 remain critical levels. As long as we can keep defending 5493, ES is still in relief bounce/squeeze mode. This would work us up the levels to 5528-30, 5554, then on to 5582-86. If 5492 fails, bulls dropped the ball on this and we need to take another leg down.
SPX (S&P 500 Index)

Combined US Indexes - Warning Trend Change to DOWNFrom the last post, there was a Gap closure and breakout... well, almost. What happened was a stall after the gap closure. This is the first indication that something is not right and a strong resistance is in the way.
After more than a week, a decisive down candle wiped out two prior days of bullish candles, and reopened the earlier gap. This by itself is very bearish... first on the candlestick pattern, and next on the reopening of the gap.
MACD have crossed under the signal line, in support of the bearish undertone.
Now, we wait for a full reopening of the gap, meaning a further breakdown of the supports.
By simple projection, the down wave from mid July to August (blue arrow) is projected from the last lower high in mid-August.
This brings the target to mid-September, at an old critical support level of 780.
Oddly enough, am expecting this to happen by the end of next week.

FED Rate Cut Sept. 19: Market ImplicationsFed expected to cut rates ~0.5% on Sept. 19
Short-term outlook:
• Likely market correction before/during the event
• "Sell the news" expected
• Traders may capitalize on retail investors' optimism around the FED rate cut
Why? Historical patterns show corrections often precede rate cuts. this time might be no exception.
FED rate cut market dynamics:
• Institutional investors take profits around the rate cut
• Potential liquidity squeeze as positions unwind
• Volatility and TVC:VIX will increase
Long-term:
• Rate cuts generally bullish over time
• Lower rates can stimulate economic growth
• But full effects may take months to materialize
Strategic considerations:
• Market dip can be a buying opportunities
• Consider index ETFs like SP:SPX and NASDAQ:QQQ and stocks with fundamentals or even Bitcoin. Personally, I will also add the leveraged ETFs AMEX:SSO and AMEX:QLD
• Consider dollar-cost averaging during volatility
Markets are complex. This analysis isn't financial advice. Always do thorough research and consider your risk tolerance.

Bear Pressure Remains (Key Levels to Watch - SPX, NDX)Tuesday - Bear Candle breaking support
Wednesday - weak re-test of the support (now becoming resistance)
Bearish pressure remains firm with key levels lower on the major indexes.
Near-term bearish until price proves otherwise. Taking stops, protecting profits and managing hedges.
JPY "unwinding" is also back on the radar. I'll be watching the JPY strength and Nikkei correlation. I still hold long FXY through 2026 (call options)
Thanks for watching!!!

2024-09-04 - priceactiontds - short daily update - sp500Good Evening and I hope you are well.
tl;dr
Indexes - Bearish bias confirmed. Bulls getting nervous by now. More bad data releases and markets are leaving bear gaps unclosed. Today we also made lower lows and the pullbacks were shallow. All good for the bears and the odds of another strong leg down and a measured move got higher today.
sp500 e-mini futures
comment : Many of the same arguments as for dax. Very strong leg down and bears want another one. Measured move target would be 5350-5370. Market closed 5 points above the open, so a big nothingburger but both sides made money today.
current market cycle: trading range
key levels: 5500 -5670
bull case: Bulls made money today if they were quick to take profits but the problem is, that the pullback was not high enough to seriously question the bear case. Bulls need to fight for 5500 or we get the second leg down. Same easy if-this-then-that scenario for most indexes.
Invalidation is below 5490/5500.
bear case: Bears confirmed the leg down with lower lows and a shallow pullback, which they sold again. They closed below the daily ema and also left a bear gap open, though a small one. First target below 5500 is 5420 which is the 50% pullback from the bull rally.
Invalidation is above 5666.
short term: Bearish. Below 5500 I become full bear again but can also see this going a bit more sideways. I do expect this week to close deep red and below 5500.
medium-long term - Update from 2024-09-01: Very much like my outlook in dax. Trading range on the daily chart and we are at the highs. We could make higher ones or not. Does not matter much. I expect 5000 to be hit again in 2024.
current swing trade: Nope and will only do on bigger swing short it will probably be dax.
trade of the day : Very strong open and longs were good. After that it was so two sided and no obvious amazing trade. In hindsight it was an obvious short but not as it was happening imo. Market had strong two sided trading during news releases. After bar 11 close I expected market to close nearer to the open price and scalped some shorts.
SPX Analysis for Today: What’s Next After Yesterday’s Big Drop?Wow! Yesterday was brutal for us all on SPX with a major bearish move that probably left a lot of traders scratching their heads. So, what’s the game plan for today? Let’s break it down.
1. Technical Picture After the Drop
Yesterday’s sell-off took SPX to key levels, and now we’re sitting in some interesting territory. The 5550-5570 range is what we’re watching closely—this could act as support, but if it cracks, we might be heading lower, potentially toward 5500.
On the flip side, if buyers step in, we could see a bounce back toward 5550, which was previous support but might now act as resistance. Traders should keep an eye on whether we break out of that range or get rejected.
2. The News That Matters
A lot of today’s action depends on what’s going on in the broader world. Are we getting any new data on inflation or jobs? If inflation numbers come in hot, the market could get nervous again, anticipating more rate hikes from the Fed. But if the data is lighter, we might get a relief rally after yesterday’s beatdown.
Also, keep an eye on any big headlines—geopolitical tension, tech earnings, or even Fed commentary. All of these could be wildcards that drive sentiment today.
3. Sentiment Check
We’ve got VIX (the fear gauge) pretty elevated right now, so people are still pretty nervous. Watch for whether that calms down today—if it does, we might get some relief in SPX. But if VIX stays high or climbs further, brace yourselves for more volatility.
The Bottom Line:
If today’s news stokes more fear, we could see another push lower. But if the market takes a breather, we might get a short-term bounce. Either way, buckle up—it’s going to be another interesting session!

2024-09-03 - priceactiontds - daily update - sp500Good Evening and I hope you are well.
tl;dr
Indexes - Huge bear surprise today. The strength of the selling was absolutely unexpected. Bulls closed August at the very high and had all the arguments to print new ath but as of now, this selling is different and new highs are now very unlikely. Most daily charts printed a huge outside down bar, closing at the lows and below the daily ema. If bears get follow through tomorrow, they have taken control of the market and we might take the elevator down again.
sp500 e-mini futures
Here is the quote from my weekly update:
bear case: Bears see it as a big trading range and we are at the highs again. They start scaling into shorts above 5600. Same observation as last week. Until bears print consecutive daily bear bars or stronger 1h bars below 5650, bulls remain in control. If bears somehow manage to print a bigger engulfing bear bar on the daily chart, especially if it closes below 5600, that would probably be enough to make many more bulls exiting their longs. Interesting week ahead of us.
comment : Market went only down today and did not touch the 15m ema, so it only makes sense to talk about the daily chart. Bears did exactly what they needed to do in order to make more bulls take profits. Now comes the most important part. If they let the bulls have a bigger pullback, this might go above 5650 again but if it stays below 5600 and we print 5490, that would certainly hit the last stops and could accelerate this down hard.
current market cycle: trading range
key levels: 5500 -5670
bull case: Bulls are running for the exits. They want to secure the profits from the insane reversal over the last weeks. I expect many more stops around 5490 and bulls need to prevent the market from getting there. Bulls have the slight hope this was an early sell climax with a bear trap below the daily ema and the expanding triangle. If they can get above 5600 again, their case is valid and we could get back above 5640 again.
Invalidation is below 5490/5500.
bear case: Bears have all arguments on their side, if they keep the pullback shallow and print below 5500 tomorrow. Seasonality is on their side this month and since the market is in a very volatile state, it’s possible to see 5000 this month. The first bigger target for the bears is obviously every round number, so 5500 but I do think 5400-5420 is the real target because that is the 50% pb from the recent bull rally. I will look to see if the 1h ema will hold tomorrow. Max bearishness would be to go sideways between 5500-5560 until bears want the bigger second leg down.
Invalidation is above 5660.
short term: Bearish but I expect a pullback before another leg down. Need to see how strong bulls are tomorrow. First bigger target for the bears is 5400.
medium-long term: Very much like my outlook in dax. Trading range on the daily chart and we are at the highs. We could make higher ones or not. Does not matter much. I expect 5000 to be hit again in 2024.
current swing trade: Nope.
trade of the day: Sell anywhere and hold. Sounds a lot easier than it is but those are the hard facts. If you struggle to do that, you need to come up with strategies to force yourself to swing part of your position and not close until a clear signal appears. Today had no signal to exit shorts.

SPX adjusted to M2 money supplyThe value of stock market indices is highly correlated with the amount of existing money. That is why to measure the economic cycles, I weight the value of the stock market with that of the money supply (M2), obtaining this chart.
We see how after 2008, business cycles of about 4 years have been established and that, in addition, we are now in an already mature bullish phase. This bullish phase will conclude with the distribution phase mentioned above, with the first resistances at the maximum value of 2007, and the maximum value trend line that continues since 2011 that has recently broken to the upside.
It strikes me that we are not better off now than in 2007 or in 2000, despite all the debt created and the amount of money printed along the way.
Take into account that Business cycles and the value of Bitcoin are highly correlated

Bull markets with staples outperforming discretionaries?Well history says yes, as it has happened before
History also says that the times it happened it lasted for 10 to 16 months, and this time it has lasted for 11 months
The key here is that normally, when the $XLY/ AMEX:XLP ratio goes up then the SP:SPX goes up too, but this does not mean that the SP:SPX cannot continue its uptrend without the other going up
Sector rotation is the blood of bull market's heart.

SPX Is Bearish! Short!
Here is our detailed technical review for SPX.
Time Frame: 1D
Current Trend: Bearish
Sentiment: Overbought (based on 7-period RSI)
Forecast: Bearish
The market is approaching a key horizontal level 5,647.50.
Considering the today's price action, probabilities will be high to see a movement to 5,385.34.
P.S
Please, note that an oversold/overbought condition can last for a long time, and therefore being oversold/overbought doesn't mean a price rally will come soon, or at all.
Like and subscribe and comment my ideas if you enjoy them!

SPXPair : SPX500 Index
Description :
Double Top Pattern in Long Time Frame
RSI - Divergence
Resistance Level
Rising Wedge as an Corrective Pattern in Short Time Frame
Completed " 12345 " Impulsive Waves

S&P500 The Bull Cycle is still far from over!Six months ago while the market was undecided about whether or not the S&P500 (SPX) rally would continue, we presented a very useful multi-year chart on the 1M time-frame (February 27, see chart below), where we called for an extension of the uptrend, claiming confidently that the 'Bull Cycle is far from over':
As you can see those who bought without fear have enjoyed so far more than +15% gains. What's even more impressive is the massive bullish reversal of the August candle, that managed to close the month in green, despite the early aggressive sell-off.
This is a strong sign that the rally is far from over, but it's not the only one. The key here, and constitutes our main modification relative to the chart 6 months ago, is that the most accurate sell signal on a cyclical basis has been historically given after the 1M RSI breaks above the 70.00 overbought barrier and posts Lower Highs.
This signal has had 100% accuracy in the past 10 years, effectively projecting the 2015, 2018 and 2022 corrections. The 1M RSI also has a Channel Down Resistance to consider but the Lower Highs signal should be top priority for investors to start selling.
As a result, we expect the index to surpass the 6000 mark and even approach 6500, before we consider a cyclical selling sequence again.
-------------------------------------------------------------------------------
** Please LIKE 👍, FOLLOW ✅, SHARE 🙌 and COMMENT ✍ if you enjoy this idea! Also share your ideas and charts in the comments section below! This is best way to keep it relevant, support us, keep the content here free and allow the idea to reach as many people as possible. **
-------------------------------------------------------------------------------
💸💸💸💸💸💸
👇 👇 👇 👇 👇 👇

September Effect - Up/Down/Sideways - How I'm Trading ItSummer trading is officially done and the market will be news sensitive leading up to the big bad FOMC Rate Decision on September 18.
August's monthly candle is a wild one with a massive wick to the south and the bulls pushed the SPY within a whisker of all-time highs, Dow to several all-time highs, Nasdaq into a nice bullish recovery posture, and Russell the same (higher lows).
6 Central Bank Rate Decisions in September
US News on Employment and Inflation all rolling out before the FOMC
I'd like to see a seasonal dip or pullback to offer more accumulation opportunities before a run higher. Let's see how it plays out.

Stock feedback loopStock market is a adaptive system or a stock, with feedback loops (for inflow, outflow function). Where nobody knows the outcome or future, but feedbacks (corrections or resistance) gives tells (makes inflows or outflows). Without a common leader.
Economists think in models (price is the result of supply-demand, or inflow-outflow) that helps to explain system behavior (short term moves), but models are just ideas to explain complex world (models work until they dont). System thinkers study the stock not aggregate behavior .
Looking at markets trough perspective of "eco system" helps better understand the drivers or moving forces?

S&P recovers; bulls maintain long-term controlThe last week of August was sluggish, despite several exciting events. First, NVDA’s earnings, although very strong, failed to boost the market beyond its daily trading range. The GDP and inflation data (positive) released later also didn’t provide sufficient momentum, and the market continued to bracket. The week closed at the high, but buyers didn’t manage to break out of the trading range and confirm control of the daily timeframe. We can conclude that the market has reached a temporary balance—both bulls and bears seem content with the current price and lack the conviction to initiate strong moves.
Zooming out to the monthly view, August closed green, near the historical high. The long lower wick signifies a bullish rally that brought the price up from the low, indicating the strength and conviction of the bulls. Although the bulls didn’t manage to achieve a new high, they still maintain long-term control.
Overall, the market is still in a monthly and weekly uptrend. Even if sellers manage to set a weekly lower high in September, it is unlikely to mark the start of a trend reversal. Buyers have created enough space for potential weekly consolidation that will not threaten their long-term control.
Important levels:
Last major weekly trend high (565). If buyers manage to move above and hold they will confirm continuation of monthly uptrend.
Last major weekly trend low (510). Buyers must protect this level if they want to keep long term control
Short Term Trading range (555-564). Breaking out from the range in either direction will mark gaining of a short-term control.

The economy peaked in April 2023"JOBS, JOBS, JOBS!"
As Obama said during the recovery period post GFC
This chart shows the employment level --- how many people are employed in the States / divided by the unemployment level --- the number of people without a job. .
A simple Ratio
With all the official Recessions highlighted in the red box.
The dates of the recessions are from Wikipedia.
JOBS are the ECONOMY
Goods and services are still made by people. (That is obviously under attack by robotics and AI) --- but will likely lead to new economies being birthed and new jobs created.
THE #FED is late to cut
and will likely cut too slowly
guaranteeing a GDP contraction therefore further job losses.
HOLDING RISK ASSETS
IS RISKY
needless to say.

BRIEFING Week #35 : The Battle Extends FurtherHere's your weekly update ! Brought to you each weekend with years of track-record history..
Don't forget to hit the like/follow button if you feel like this post deserves it ;)
That's the best way to support me and help pushing this content to other users.
Kindly,
Phil

Weekly Recap & Market Forecast $SPX (Sept 1st —> Sept 6th)**DIYWallST Weekly Recap & Market Forecast**
---
Hello Investors! 🌟 This week saw mixed movements in the stock markets as strength in consumer staples, energy, and financials helped offset weakness in discretionary and technology shares. Let’s dive into the key events that shaped the financial landscape. 📈
**Market Overview:**
The week began with consumer staples, energy, and financials providing support to the markets, counterbalancing the softness in discretionary and technology shares ahead of key earnings reports in those sectors. Oil prices rose early in the week as Israel responded to a Hezbollah attack from the North, and uncertainty over Libya’s production reemerged. However, crude prices fell back later in the week after a report suggested OPEC+ might proceed with a planned ‘gradual’ oil output increase starting in October. Gold prices continued to set new all-time highs, maintaining their recent outperformance over bitcoin. The S&P 500 encountered resistance around 5,600—a level approximately 20x average 2025 S&P earnings estimates, which moved up towards $275 following Nvidia and other companies' quarterly results. Stock indexes closed mixed for the week, with the S&P edging up 0.2%, the DJIA rising 0.9%, and the Nasdaq down by 0.9%.
**Stock Market Performance:**
- 📈 S&P 500: Up by 0.2%
- 📈 Dow Jones: Up by 0.9%
- 📉 NASDAQ: Down by 0.9%
**Economic Indicators:**
Economic data this week supported the expectation of more central bank rate cuts next month:
- **European CPI:** Preliminary German and French CPI fell below the ECB’s 2% target for the first time since August 2021, reinforcing expectations of a rate cut from the ECB in September.
- **US Durable Goods:** July data rebounded sharply as expected, but core capital goods (nondefense excluding aircraft) were disappointing, showing no monthly increase since April.
- **Richmond Fed Index:** The August print was soft, contracting to a level not seen since the pandemic.
- **PCE Inflation Data:** The Fed’s preferred inflation gauge did little to alter expectations for a September rate cut, while Q2 preliminary GDP and July personal consumption data remained solid.
- **US Yield Curve:** The 2-10 spread moved closer to de-inverting, with just a few basis points separating it from positive territory.
**Corporate News:**
Earnings reports continued to be a major market driver, especially in the retail sector, which delivered mixed signals:
- **Best Buy:** Exceeded earnings expectations despite posting its 11th consecutive quarter of negative US same-store sales, highlighting that consumers are seeking value but still willing to invest in new technologies.
- **Dollar General:** Missed estimates and confirmed that lower-end consumers are struggling, with many running out of paychecks before month-end and relying on credit cards for basic needs.
- **PDD (Temu-parent):** Shares were hit hard after the company reported that intensifying competition was pressuring revenue growth.
- **Nvidia:** Beat earnings expectations again but saw a slightly more modest increase in guidance than usual, leading to a retracement in big tech stocks on Thursday.
- **Marvell Technology:** Impressed investors with a strong earnings report and forecasted that custom silicon would become a significant revenue growth driver.
- **Intel:** Reportedly considering a major restructuring, which could include spinning off its foundry business.
- **Paramount:** The latest development in the ongoing acquisition saga saw the Edgar Bronfman Jr.-led consortium withdraw its proposal, clearing the way for Skydance to close the deal.
**Looking Ahead:**
Next week will bring several key events and data releases:
- **U.S. Jobs Report**
- **U.S. PMI Surveys**
- **Fed Beige Book**
- **Earnings Reports:** Broadcom ( NASDAQ:AVGO ), Dollar Tree ( NASDAQ:DLTR ), Dick’s Sporting Goods ( NYSE:DKS ), Nio ( NYSE:NIO )
- **Labor Day Holiday:** Markets will be closed on Monday
As we move forward, these developments will be crucial in shaping market sentiment and guiding investment decisions. If you have any questions or need further insights, feel free to reach out. Here’s to another week of informed investing and strategic decision-making! 🌟

#202436 - priceactiontds - weekly update - sp500 e-miniGood Evening and I hope you are well.
tl;dr
sp500: Current bullish leg looks more like a leg in a trading range than something of a new bull trend that breaks above the previous ath. It’s 50/50 if bulls can print a new ath or this stays a lower high. It’s too high to buy for anything but intraday and too early to short unless you short small and have a stop above 5800. It’s a bullish structure but you would be buying very high in a potential trading range. Bad R:R.
Quote from last week:
comment: Not much difference to dax, just that this market was a tat stronger even. Bulls almost reversed completely but 7 consecutive bull bars is as climactic as it gets. A pullback is due but that does not mean you can short it at 5578. Could go further since the obvious pain trade is up.
comment : Are we that much smarter than last Sunday after past week’s price action? I don’t think so. Still a lower high. Bulls closed the month extremely bullish but we are at previous resistance. Can’t be anything but neutral. Clear invalidation prices though. Above 5670 it’s bullish for ath retest 5721 or higher high. Below 5550 bears can generate momentum and convince bulls this was just a climactic retest of the highs and we go down again. Bulls still do have better arguments than the bears as long as they stay above the daily ema at 5565.
current market cycle: Bull trend inside bigger trading range.
key levels: 5000-5700
bull case: Bulls need to break above 5670 if they want a new ath and it look’s very good after Friday. If they fail on Monday, I have my doubts that they can get it. Bulls are still clearly in control of the market or we would have been trading below the daily ema already. Will be interesting to see how many bears come around above 5700 and bulls taking profit, if we get there.
Invalidation is below 5550.
bear case: Bears see it as a big trading range and we are at the highs again. They start scaling into shorts above 5600. Same observation as last week. Until bears print consecutive daily bear bars or stronger 1h bars below 5650, bulls remain in control. If bears somehow manage to print a bigger engulfing bear bar on the daily chart, especially if it closes below 5600, that would probably be enough to make many more bulls exiting their longs. Interesting week ahead of us.
Invalidation is above 5670.
outlook last week:
short term: Neutral af. Want to see a pullback and also how market reacts to 5600.
→ Last Sunday we traded 5652 and now we are at 5661. 9 points off. I do think that was a perfect outlook.
short term: Neutral again. No interest in bigger buying above 5600. Will scalp long if bulls make it clear that they want a new ath but mostly looking for signs of bear strength over the next week. Bulls closed above 5660 so it’s a buy signal going into next week but my outlook has not changed. I wait for bears to come around and will only scalp longs.
medium-long term: Very much like my outlook in dax. Trading range on the daily chart and we are at the highs. We could make higher ones or not. Does not matter much. I expect 5000 to be hit again in 2024.
current swing trade: None.
chart update: Big ABC correction is pure speculation. Don’t bet on it. I do think the climactic bull rally is over and market is going sideways before the next bigger breakout. Only above 5750 can bulls dream about a breakout above the big bull wedge.

SPX: supported by consumer spendingThe Fed's favorite inflation gauge, the PCE index, was standing behind the increased investors optimism during the previous week. The Index reached the level of 2.5% in July, which was lower from market expectation of 2.6%. The US equities reacted positively, in expectation of the first Fed's rate cut. The S&P 500 gained more than 1%, ending the week at the level of 5.648. The index ended August with a gain of 2.3%.
Additional support to the surging index came from good results which companies posted for the Q2. There are still only seven companies included in the S&P 500 which are pending results posts. The major companies in the tech industry continue to drive the index to the higher grounds. Market favorite stock, Nvidia, posted increased earnings by 13% for the second quarter. Almost all industries included in the index posted high results for Q2, except materials and real estate industries, which ended the quarter in a correction.
The optimism on financial markets is expected to continue, taking into account posted consumer spending data. With the increase in consumer spending, investors are now expecting that the Q3 data will also be positive, and are adjusting accordingly. Also, analysts are currently making corrections of GDP projections for this year. Atlanta's Federal Reserve GDP now also made a correction of GDP growth expectations to 2.5% from 2.0% expected previously.

SPX analysis at Time One daily timeThis index continues its upward trend and the ceiling of 48,000 will be broken
The price has made its protected floor by hitting its local support and is doing fractal behavior to break the price ceiling.
I watch the market
Not financial advice

SPX dollar adjustedSPX is entering into a distribution phase before a leg down. Moves between a 25% range could happen in the distribution phase and could last a long time. The move down afterwards could be very high.

Why ORB + VWAP is Your New Best Friend in Trading -No, SeriouslySP:SPX Hey there, traders! Deno Trading here;👋 Stop feeling like the market is just a one big, mysterious puzzle, and felt you're missing the piece that makes everything click? Well, strap in, because today we're diving into the magic of the Open Range Breakout (ORB) strategy, sprinkled with a little VWAP (Volume Weighted Average Price) magic dust. Spoiler alert: This combo is like peanut butter and jelly for traders—simple, effective, and deliciously profitable.
The Chart (aka "The Battlefield")
Take a look at the chart above—our trusty S&P 500 on a 15-minute time frame. Notice those blue zones? That’s your ORB, the first 15-30 minutes of market action where all the cool kids (a.k.a. the big institutions) are making their moves. The VWAP line? That’s the referee, keeping everyone honest.
Now, let’s break down why ORB works most of the time (we're not wizards, after all, just really good strategists).
ORB: The Reliable Wingman
Imagine ORB as your super-reliable wingman. It’s there at the start of the trading day, setting the boundaries. If the price breaks out of this range, it’s like getting the go-ahead from your wingman to approach—“Yeah, this one's a keeper.”
In our chart, you can see how every time the price breaks above or below the ORB, it either rockets off to the moon 🌕 or dives deep into the abyss. And just like in life, we always want to go with the flow—if the price breaks out, we’re in for the ride.
VWAP: The Truth Serum
Now, let’s talk VWAP. Think of VWAP as the lie detector of the trading world. When the price is above VWAP, it’s like the market is saying, “I’m feeling good, let’s keep pushing higher.” Below VWAP? Well, it’s like the market’s had a rough night out, and it’s probably heading home early.
In this chart, you’ll notice how the price interacts with VWAP after breaking out of the ORB. When the price stays above VWAP after a breakout, it’s a sign that the bulls are in control—cue the confetti! 🎉 But when it dips below, the bears start growling, and you might want to reconsider your long positions.
Jokes Aside But Hey: ORB Always Works (Except When It Doesn’t)
Let’s be real for a second—ORB mostly works. Kind of like how your Wi-Fi mostly works until you really need it. But when ORB does work, it’s like hitting the jackpot. You’re basically riding the wave that everyone else is trying to catch. And if it doesn’t work? Well, blame it on the market gremlins and move on.
Why and Why again: ORB + VWAP = Trading BFFs
Let me wrap up that if you’re not using ORB with VWAP, you’re missing out on a killer combo. These two are like Batman and Robin, or coffee and donuts—they just make sense together. So, the next time you’re staring at your charts, remember: Trust in the ORB, let VWAP be your guide, and don’t forget to laugh at the market’s little quirks and use the news as your catalysts. Because at the end of the day, trading should be fun, profitable, and maybe just a little bit magical.
Now go forth and conquer those charts, my fellow traders! 🚀 Deno Trading in and out!
