DeGRAM | XRPUSD Retest of Support Level📊 Technical Analysis
Breakout from wedge
XRP/USDT broke above a descending wedge, confirming support near $2.00.
Key resistance
The next target is $2.30, aligned with the upper resistance trendline.
Predictive scenario
If support holds, XRP could climb toward $2.30 with room for further upside if broken.
💡 Fundamental Analysis
Ripple gains momentum as legal clarity improves. Positive sentiment around altcoins and rising market activity support a bullish outlook.
✨ Summary
XRP’s breakout and legal tailwinds point to continued growth. Watch $2.30 for potential breakout confirmation.
-------------------
Share your opinion in the comments and support the idea with a like. Thanks for your support!
Support and Resistance

How to break through the gold shock patternOperation suggestionsTechnical analysis of gold: The current gold price is in a stalemate stage of long-short game. On the one hand, the path of the Fed's easing policy has been basically clear, and the US dollar is facing correction pressure; on the other hand, the stable global risk sentiment and the strong performance of the stock market have weakened the attractiveness of gold as a safe-haven tool. The repeated signals of global trade negotiations have also made the market direction unclear. From a technical point of view, gold has received support after the correction to the 26.3% Fibonacci retracement level near 3317 this week, and has returned to above $3,300 in the short term. The upper resistance focuses on the position of 3380. Once it breaks through, it will open up the space leading to the 3400 mark.
From the daily chart of gold, yesterday's gold price fell sharply and recorded a large real body Yin line K-line pattern. The peak pattern of the previous price high is more obvious, suggesting that the upper pressure effect is strong. The MACD indicator double line began to turn downward, increasing the risk of further correction in the short term. However, the MA5 and MA10 moving averages have not turned downward yet. You can pay attention to the support and defense of the moving average. From the 4-hour gold chart, the gold price has been fluctuating and falling since it came under pressure at the 3500 level. The current price has fallen back to the 3260 level, with a short-term decline of 240 US dollars. Although there has been a rebound during the day, the upward trend has been destroyed. The MACD indicator has issued a dead cross signal, suggesting that the correction trend may have started.
Gold fell after rising in the Asian session, and fell below the support levels of 3351 and 3330. Now the market rebounded near 3314, which is also in line with our analysis of the long and short trends. In the big trend, the gold rally did not exceed 3380, so there is still a downward demand, that is to say, it can only be regarded as a rebound during the decline. In the short term, this wave of gains stopped at 3367. Now it broke through 3351 and pierced 3316 to rebound. The main focus on the upper side is the support-to-resistance level of 51, followed by 3342. Specifically, you can wait for the area near 3345 to go short and see the gold price break the previous rebound low of 3314 to 3300. If it breaks down effectively, you can move the protection loss down to see the position of the rebound turning point of 3283 and 3260. On the whole, the short-term operation strategy of gold today is to short on rebound and long on callback. The short-term focus on the upper side is 3350-3370 resistance, and the short-term focus on the lower side is 3300-3280 support.

Quick correctionI bough some puts form 05/02 strike 242.5. I think is going to respect that resistance in short term. I'll take the loss if it breaks up that resistance. Also SPY is hitting a resistance zone. We might see a pull back soon.

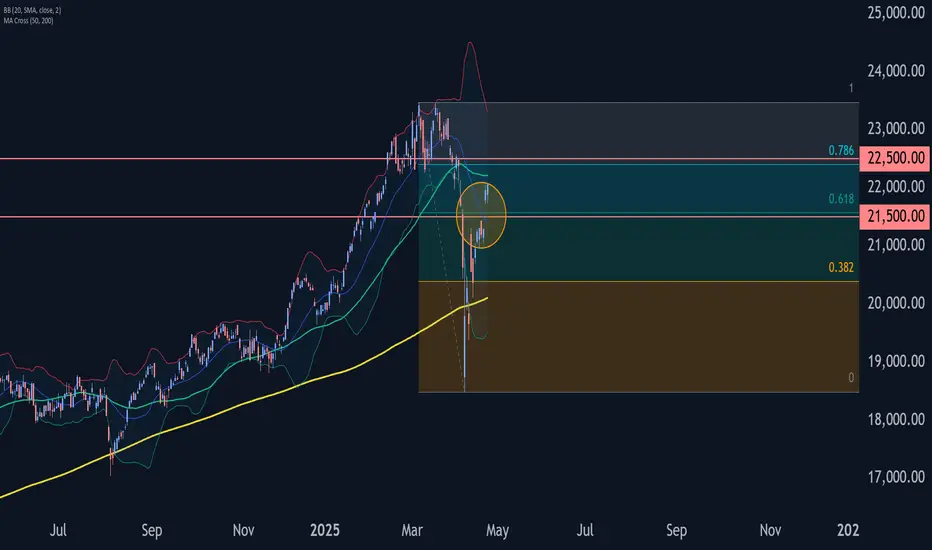
DAX Wave Analysis – 24 April 2025- DAX broke resistance area
- Likely to rise to resistance level 22500.00
DAX index is under the bullish pressure after it broke the resistance area between resistance level 21500.00 (top of the previous correction A) and the 61.8% Fibonacci correction of the downward ABC wave (2) from March.
The breakout of this resistance area accelerated the active impulse wave (3) from the start of April.
Given the clear daily uptrend, DAX index can be expected to rise toward the next resistance level 22500.00 (which stopped wave B of the earlier ABC wave (2)).
Gold – How Important Could the Fibonacci Support Levels Be?Even by recent standards, the price action seen in Gold this week so far has been extreme. For those that may not have seen it all, here we go. Gold opened at 3331 on Monday, traded to a new all time high of 3500 on Tuesday, then dropped all the way back down to 3260 on Wednesday before recovering again to current levels around 3330. A round trip of circa 14%.
The drivers appear to be comments from President Trump and US Treasury Secretary Bessant. With President Trump seeming to challenging the independence of the Federal Reserve at the start of the week (Gold higher) and then pulling back from his most outspoken criticism on Wednesday (Gold lower). Alongside President Trump and Secretary Bessant both commenting on the potential for a de-escalation of the trade war with China on Wednesday (Gold lower), but then suggesting it may take some time to agree (Gold higher).
All of this at the same time that a potential US brokered peace detail between Ukraine and Russia may be moving a step closer to becoming a reality and you can possibly see why Gold prices have moved so much.
Right now, as traders take a pause for breath, its may be a good time to consider the charts and identify some potential support and resistance levels that may come into play into the Friday close.
Technical Update: 3292 Fibonacci 38.2% Support in Focus
Let’s be honest here, when a market is accelerating higher into new all-time high ground, as an almost ‘panic’ rush to get long of an asset is seen, it is very difficult to establish upside resistance levels that may or may not be able to hold the advance, let alone reverse it.
As technical analysts, we can only really focus on 2 things in such a condition, psychological round numbers and Fibonacci extension levels.
Therefore, it’s interesting where the recent acceleration higher in Gold stalled this week, at 3500.
Obviously, this is a round number that may have drawn traders’ interest from a psychological perspective, but this also represented a test of 3468, which is equal to the 261.8% Fibonacci extension of the October 31st to November 14th 2024 sell-off.
With weakness developing from 3500, this extension level held on a closing basis, from which further declines have materialised.
So, we might suggest after the recent weakness in Gold prices, that an upside resistance area has now been established between 3468/3500.
If that is the case, what might the support levels be for us to monitor to gauge if current weakness has further to carry of not?
Potential Support Levels:
The latest phase of price strength in Gold was seen between April 7th to April 22nd 2025, and calculating Fibonacci retracement on this price strength, may highlight some interesting support levels.
The latest downside move has tested, and is so far being held by support at 3292, which is the 38.2% Fibonacci retracement of the latest strength. Traders may now be watching how this level performs on a closing basis, as confirmed breaks lower might see a more extended phase of price weakness emerge.
Much will of course depend on future market sentiment and price trends, but closing breaks below 3292 could suggest further declines to 3228, the 50% level, possibly even 3165, which is the deeper 62% retracement.
Potential Resistance Levels:
As we have already said, the latest price activity may well be suggesting the 3468/3500 range is an area that may prove to be a resistance focus. However, if the 3292 retracement support continues to hold, focus could then be on 3380, as a possible lower resistance level.
This is equal to half of the latest declines, with closing upside breaks of this resistance possibly suggesting positive themes are re-emerging, which could lead to further pressure being placed on the important 3468/3500 resistance range.
The material provided here has not been prepared in accordance with legal requirements designed to promote the independence of investment research and as such is considered to be a marketing communication. Whilst it is not subject to any prohibition on dealing ahead of the dissemination of investment research, we will not seek to take any advantage before providing it to our clients.
Pepperstone doesn’t represent that the material provided here is accurate, current or complete, and therefore shouldn’t be relied upon as such. The information, whether from a third party or not, isn’t to be considered as a recommendation; or an offer to buy or sell; or the solicitation of an offer to buy or sell any security, financial product or instrument; or to participate in any particular trading strategy. It does not take into account readers’ financial situation or investment objectives. We advise any readers of this content to seek their own advice. Without the approval of Pepperstone, reproduction or redistribution of this information isn’t permitted.

EUR/USD Bullish Reversal Setup - Long OpportunityEUR/USD Trade Setup (1H Chart) Analysis
Type: Long (Buy)
Entry Zone: 1.1340 – 1.1355
Stop Loss: 1.1302
Targets:
🎯 Target 1: 1.1440
🎯 Target 2: 1.1500
🎯 Target 3: 1.1560
Pattern: Bullish Reversal Zone (Support Rebound Setup)
Price is bouncing off a strong support zone (highlighted in purple) and forming a potential higher low. If bullish momentum sustains above this area, a move toward higher targets is anticipated.
Note: Short-term intraday to swing trade – let price confirm direction before full commitment. Do proper risk management and trade at your own risk.

PLTR eyes on $109.xx: Possible End of bounce wave to Dip next?PLTR coming back strong after the tariff tantrum.
Now approaching a key resistance at $108.52-109.02.
Elliott Waves also point to a completed 5-wave structure.
Looking for a dip here, to either $103 or $96, will post updates.

USOIL ANALYSISHello friends
Everything is clear on the chart for you, our probability is price growth to the specified areas.
Be sure to observe risk and capital management.
*Trade safely with us*

Potential HSNot confirmed yet but I'm jumping in anyways. I bought some puts of GLD for May 23 strike 304. My SL triggers if the price breaks up the resistance shown and closes above in the daily timeframe. Might be some turbulence, bulls will try to push the price higher. too much noise in the political arena, but Gold is overbought and needs a healthy correction.

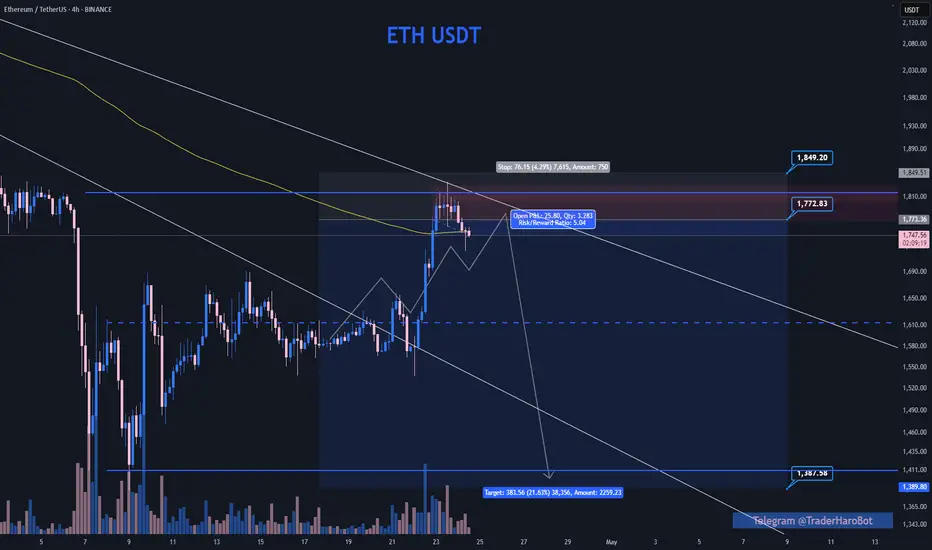
ETH Short - Sweep of 12 H HighsETH Short was planned 5 days prior to when it got triggered, main idea is a sweep of the 12 H highs, and a continuation of the bear trend on higher time frames.
We got the sweep, now we wait for the setup to play out.
TEM eyes on $50 round: Key fib and psych level to breakTEM trying to recover along with the general market.
Testing a key fib Zone and psych val $50.01-50.27
Look for break and retest for blue skies above.

CHECK BTCUSD ANALYSIS SIGNAL UPDATE > GO AND READ THE CAPTAINBaddy dears friends 👋🏼
(BTCUSD) trading signals technical analysis satup👇🏼
I think now (BTCUSD) ready for(SELL)trade ( BTCUSD) SELL zone
( TRADE SATUP) 👇🏼
ENTRY POINT (92200) to (92000) 📊
FIRST TP (92600)📊
2ND TARGET (90800)📊
LAST TARGET (90100) 📊
STOP LOOS (93000)❌
Tachincal analysis satup
Fallow risk management

24/4/2025 Gold structure formed.24/4/2025
Gold structure formed.
In the biggest time frame like weekly and daily trend is still strong bullish. However current trend is bearish due to the strong rejection from 3500 to 3260.
From which today gold has seen respecting 3260 start to gave a sign of the continuation to climb back up to test again 3500.
Current resistance is 3367. And the current cmp support stand at 3267-3277.
Today is a good potential to scalp buys and sells in either support or resistances.
With cloned trendline placed we can witness a bullish flag pattern also forming. However its too early to say and its just an assumptioned.
To sell at the market its seems to be a little high risk so a slightly higher postion seem safer like 3410 where the broke of support to 3500 breaks and strong push down ever since.
To buy of current smaller timeframe seems safer and with a continuation of fresh breakout pullback in M15 or M30 however avoid buying near resistance.

BPCL: Preempting a Rounding Bottom Breakout! 🚀 BPCL: Preempting a Rounding Bottom Breakout! 🚀
📉 CMP: ₹286.8
🔒 Stop Loss: ₹271
🎯 Targets: ₹298 | ₹307 | ₹318
Why BPCL Looks Interesting?
✅ Technical Setup: Forming a rounding bottom with ₹290 as a key resistance-turned-support level
✅ Strength Amid Volatility: Despite tariff fluctuations and market swings, BPCL has held firm, signaling a potential reversal
✅ Breakout Potential: A sustained move above ₹290 could confirm the bullish structure
💡 Strategy & Risk Management:
🔒 Stop Loss: ₹271 to protect downside risk
📈 Staggered Entry: Phased accumulation to manage volatility effectively
⚠️ Caution: The market has seen strong moves—position sizing should be managed carefully.
💬 Do you see energy stocks leading the next market move? Drop your thoughts below!
#BPCL #BreakoutTrading #TechnicalAnalysis #StockMarket #SwingTrading
📉 Disclaimer: Not SEBI-registered. Conduct independent research or consult a professional before investing.

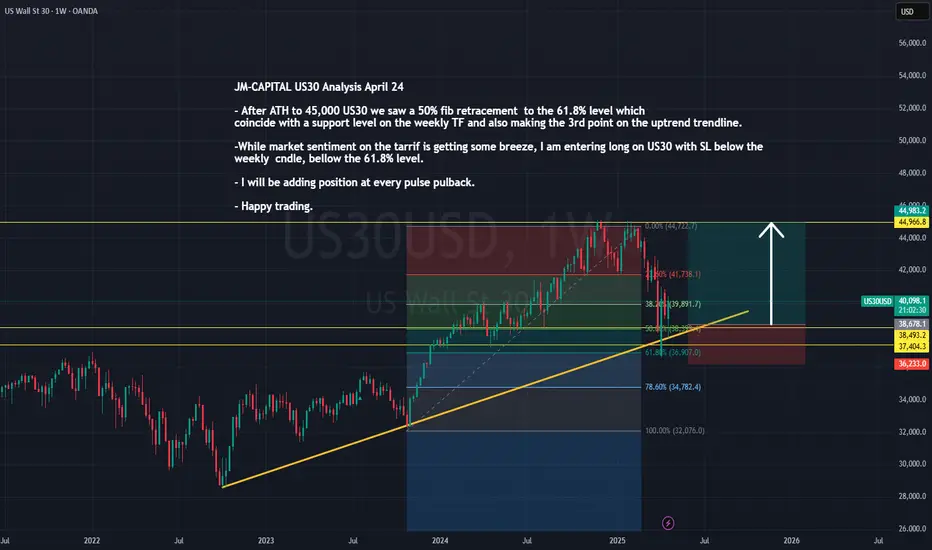
JM-CAPITAL US30 Analysis April 24After reaching an all-time high of 45,000, US30 experienced a pullback, retracing to the 61.8% Fibonacci level—aligning perfectly with a key support zone on the weekly timeframe and forming the third touchpoint on the ascending trendline.
With market sentiment beginning to ease around the tariff discussions, I’m taking a long position on US30. My stop loss is set just below the weekly candle and beneath the 61.8% Fibonacci level for added protection.
I plan to scale into the trade by adding positions on each corrective pullback in line with the bullish structure.
Wishing you all a profitable trading session. Stay sharp!
XAGUSD Expecting Grows StrctureHere is My XAGUSD analysis what will next move trade wisely best of luck buddies.
lets seeing the market condition very high all time background is very strong Guys. Current price move between 32.630 if the price stay in 32.000 the next Strong resistance will be 35.000
you may find more details in the chart.
Ps Support with like and comments for motivating to share analysis to with you.

Acadia Healthcare Company | ACHC | Long at $21.98Acadia Healthcare's NASDAQ:ACHC stock has fallen nearly -76% in a year, primarily due to weak 2024 results, missed revenue and EPS expectations, and a soft 2025 revenue guidance. Ongoing federal investigations into billing practices and lawsuits have further eroded investor confidence. However, it is currently trading at a price-to-earnings ratio of 7.42x and earnings are forecast to grow 7.07% per year. The profitable company is trading at a good value compared to other healthcare companies. Debt-to-equity is relatively low (0.64x), but legal risks (DOJ probe, lawsuits) strain margins.
The stock has entered my "major crash" simple moving average territory and there is a lot of downward / selling pressure. But, more often than not, this area (which... I caution... still extends down near $16) can often signal a temporary or longer-term bottom. Personally, this is a buy area ($16-$21) even if it turns into a short-term bounce in 2025. But I believe the overall market moves in the S&P 500, etc. will guide this stock more than anything at this point (unless more bad news about the company emerges).
One thing to note is that there are open price gaps on the daily chart near $17, $10, and $8. These gaps, which often (but not always) get closed in the lifetime of a stock, are a potential signal for further declines - at least at some point. There could be a drop near $16, then a $10-$20 bullish price increase after that, followed by more declines (trapping investors). Time will tell, but NASDAQ:ACHC is currently attractively valued. From a technical analysis standpoint, it is in a personal "buy zone", even if purely for a swing trade.
Targets:
$27.00
$33.00
$39.00

INTU watch $607-610: Double Golden zone and Major Milestone INTU recovering nicely and is pretty much tariff-proof.
Currently testing a Double Golden zone $ 606.75-610.16
This if often a major milestone in the lifetime of any asset.

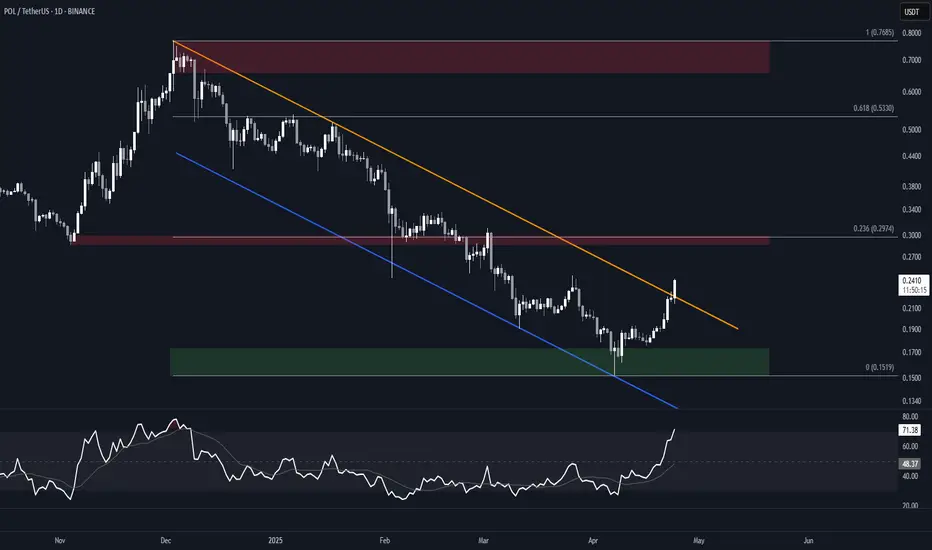
POL (MATIC) Falling Channel BreakoutBINANCE:POLUSDT is attempting a breakout from a nearly 6-months long falling channel. A daily close above the resistance would offer confirmation.
Watch for a potential retest of the resistance as support, as the overbought Daily RSI could signal an imminent pullback.
Key Levels
Aside from the support, these are all good candidates for partial TPs.
• $0.15-$0.17: Bull order block and current support
• $0.30: Previous S/R, 0.236 fib of the move down, and HVN. Will likely offer resistance.
• $0.53: Previous S/R, and 0.618 fib of the move down.
• $0.66-$0.77: Main supply zone, and December 2024 high.
Gold's downside target is AB=CD, 3132On the 4-hour chart, XAUUSD fluctuated and fell, and the bears have the upper hand. At present, attention can be paid to the resistance near 3367. If the rebound is not broken, it is expected to start to fall. The support below is around 3260. If it falls below, it is expected to form an AB=CD pattern, with a target near 3132.

TCS Ready for BounceTCS Ready for Bounce
Current Market Price (CMP): ₹3,647
Stop Loss (SL): ₹3,430
Target 1: ₹3,784
Target 2: ₹3,986
📊 Market Insight:
TCS is showing signs of a potential bounce, closely mirroring the NIFTY IT index. The stock has formed a base on the daily chart and recently breached a small resistance, suggesting bullish momentum may follow.
💡 Trade Setup:
With April’s quarterly results on the horizon, increased activity in TCS and the broader IT sector could present a short-term trading opportunity.
⚠️ Caution:
The market remains volatile—practice smart position sizing and maintain a strict stop-loss to protect your capital.
📌 Disclaimer: Not a SEBI-registered advisor. Always conduct your own research before making any investment decisions.
#TCS #NIFTYIT #StockMarket #TechnicalAnalysis #TradingOpportunity #MarketUpdate

Supply and Demand Zones 4/23/25 $NQLink: www.tradingview.com
After manyyyy months, I am finally coming back into my bread and butter.. Supply and Demand zones. Relearning this type of chart analysis was interesting, muscle memory kicked in but I definitely had to rewatch and re-read some old material to remember how I used to do this.
Back to the charts, my 2 games plans are:
1. Push into 1HR supply above to create (an ugly) shoulder and go short to fill the gap below. If we are respecting higher timeframe trend down, a retest of the gap/IMB/demand below would make sense.
2. Break out of HTF trend and reclaim the 1HR supply to become support (new demand level). If we are bullish and news is actually good, I want to see the 30MIN supply and gap get filled above.

RUNE/USDT : BUY LIMITHello friends
Given the growth in price and the entry of buyers, now that the price is in the ascending channel, we can buy in stages and with risk and capital management and move towards the specified goals.
*Trade safely with us*

THETA at Rock Bottom? The Bounce Could Be LegendaryFor the past 136 days, THETA has been in a strong downtrend, shedding an incredible -82% from its high at $3.351. Recently, it tapped into a major support level at $0.617, interesting that it's like the golden ratio 0.618. And it bounced off it beautifully. Over the last few days, we’ve seen a notable surge in volume, hinting at potential accumulation. Could this be one of the best times to scale in? It might just be. An 82% discount is no joke.
🔑 Key Levels to Watch
The $1 level is the key psychological and technical resistance everyone’s eyeing. Longing from current levels to $1 offers a solid +40% gain, not bad at all. But let’s zoom out and get the bigger picture with some Fibonacci levels.
Using Fib retracement on the full 136-day move down:
0.236 Fib = $1.252 → Approx. +75% from current price
0.382 Fib = $1.653 → Roughly +135% gain
These are solid mid- to long-term upside targets if bullish momentum builds.
📈 Trade Setup & R:R
Invalidation: Current low at $0.600
Monthly Open: $0.804. Reclaiming and flipping this level into support would be a bullish sign.
Current Resistance: Around $0.71, where the anchored VWAP (yellow line) aligns with a yearly level. This needs to be broken and ideally retested as support.
We might also be seeing the early formation of an inverse head and shoulders pattern. While the “head” is still developing, if this setup plays out, the target sits at $1.5.
And here’s the kicker:
That $1.5 region lines up with multiple higher timeframe moving averages, adding significant weight to the level:
Monthly 21 EMA: $1.52
Monthly 21 SMA: $1.47
Weekly 21 SMA: $1.514
This confluence makes $1.47–$1.52 a major magnet for price and a likely take-profit or reaction zone if momentum continues.
👉 Feel free to use this indicator—just head over to my profile and under the Scripts section, add it to your favorites. Enjoy.
🎯 Risk to Reward Potential
These setups have excellent R:R potentials, ranging from 3:1 to over 60:1, depending on entry, stop-loss placement, and target selection. These are the kinds of high-probability setups that traders dream of. Clean structure, strong support, major upside, and clear invalidation.
If we see a breakout above $1 with strong volume, it could act as a catalyst for an even faster move toward higher Fib levels and MA targets.
Didn’t want to go too deep, but this lays out a clear roadmap with levels to monitor and possibilities to consider. The rest depends on how new data unfolds in the coming weeks. As always... plan your trade, manage your risk, and let the market come to you. Keep monitoring volume, structure, and key levels. The opportunities are here, now it's about execution.
____________________________________
If you found this helpful, leave a like and comment below! Got requests for the next technical analysis? Let me know.
