USDJPY: Long Signal with Entry/SL/TP
USDJPY
- Classic bullish formation
- Our team expects growth
SUGGESTED TRADE:
Swing Trade
Buy USDJPY
Entry Level - 145.33
Sl - 144.41
Tp - 147.41
Our Risk - 1%
Start protection of your profits from lower levels
Disclosure: I am part of Trade Nation's Influencer program and receive a monthly fee for using their TradingView charts in my analysis.
❤️ Please, support our work with like & comment! ❤️
Tecnicalanalysis

GBPJPY Trading Opportunity! BUY!
My dear friends,
Please, find my technical outlook for GBPJPY below:
The price is coiling around a solid key level - 188.12
Bias - Bullish
Technical Indicators: Pivot Points Low anticipates a potential price reversal.
Super trend shows a clear buy, giving a perfect indicators' convergence.
Goal - 190.71
Safe Stop Loss - 186.87
About Used Indicators:
The pivot point itself is simply the average of the high, low and closing prices from the previous trading day.
Disclosure: I am part of Trade Nation's Influencer program and receive a monthly fee for using their TradingView charts in my analysis.
———————————
WISH YOU ALL LUCK

GOLD Chart Analysis for Gold (XAU/USD) – April 10, 2025
Key Observations:
1. Price Action and Trend:
- The price is currently in an uptrend, forming a bullish channel (green box) as it moves upwards.
- Resistance is positioned near 3,134.588 and 3,123.580 which are key levels to watch for potential price rejection or breakout.
- Support levels are defined at 3,067.613 and 2,974.936. The price has recently bounced off the support level, suggesting that the trend is still intact and may continue to push higher.
2. Key Levels:
- Resistance: The resistance level near 3,134.588 is being tested currently. A breakout above this level could indicate further bullish momentum.
- Support: The support zone near 3,067.613 is crucial. If the price drops below thi…
ChatGPT: - The volume bars show a spike in activity, suggesting market indecision, but also strong bullish sentiment near the support level.
4. Target Price and Future Projections:
- The target price for this move is 3,134.588, where the price is expected to test resistance. If it breaks this level, the next target could be near 3,150.00.
- The bullish channel suggests that Gold is still trending upward, and the price is likely to continue moving towards the upper boundary of the channel.
Scenario Predictions:
1. Bullish Scenario:
- If Gold successfully breaks the resistance at 3,134.588, it could continue to push higher towards the next resistance zone around 3,150.00.
- Support level at 3,067.613 holds strong, and the price continues to make higher highs…

USDCAD: Growth & Bullish Forecast
It is essential that we apply multitimeframe technical analysis and there is no better example of why that is the case than the current USDCAD chart which, if analyzed properly, clearly points in the upward direction.
Disclosure: I am part of Trade Nation's Influencer program and receive a monthly fee for using their TradingView charts in my analysis.
❤️ Please, support our work with like & comment! ❤️

CHFJPY Under Pressure! SELL!
My dear followers,
This is my opinion on the CHFJPY next move:
The asset is approaching an important pivot point 173.25
Bias - Bearish
Technical Indicators: Supper Trend generates a clear short signal while Pivot Point HL is currently determining the overall Bearish trend of the market.
Goal - 171.69
About Used Indicators:
For more efficient signals, super-trend is used in combination with other indicators like Pivot Points.
Disclosure: I am part of Trade Nation's Influencer program and receive a monthly fee for using their TradingView charts in my analysis.
———————————
WISH YOU ALL LUCK

GOLD: Target Is Up! Long!
My dear friends,
Today we will analyse GOLD together☺️
The in-trend continuation seems likely as the current long-term trend appears to be strong, and price is holding above a key level of 2,984.73 So a bullish continuation seems plausible, targeting the next high. We should enter on confirmation, and place a stop-loss beyond the recent swing level.
❤️Sending you lots of Love and Hugs❤️

GOLD A Fall Expected! SELL!
My dear friends,
My technical analysis for GOLD is below:
The market is trading on 3123.0 pivot level.
Bias - Bearish
Technical Indicators: Both Super Trend & Pivot HL indicate a highly probable Bearish continuation.
Target - 3102.5
Recommended Stop Loss - 3132.0
About Used Indicators:
A pivot point is a technical analysis indicator, or calculations, used to determine the overall trend of the market over different time frames.
Disclosure: I am part of Trade Nation's Influencer program and receive a monthly fee for using their TradingView charts in my analysis.
———————————
WISH YOU ALL LUCK

XAUUSD BUY TARGET SUCCESSFUL HITTING READ IN CAPTIONSHere's a descriptive analysis of the chart you provided, which is a technical analysis chart for Gold (CFDs on Gold, USD/OZ) as of April 9, 2025:
---
Chart Description: Gold (XAU/USD) Price Action Analysis
Time Frame: Intraday (Likely 1-hour or 2-hour candles)
Volume: Displayed at the bottom in green/red bars, showing buying and selling pressure.
Key Highlights:
1. Downtrend Channel:
The price has been moving within a downward channel (marked by red and blue trendlines).
Several lower highs and lower lows were observed until a breakout occurred.
2. Support and Resistance Levels:
Support Level: Around 2,974.936 – This acted as a solid base before the bullish reversal.
Resistance Zone: Around 3,132.939 - 3,137.725 – This area is expected to be a stron…

DXY: Will Go Up! Long!
My dear friends,
Today we will analyse DXY together☺️
The recent price action suggests a shift in mid-term momentum. A break above the current local range around 102.250 will confirm the new direction upwards with the target being the next key level of 102.798 and a reconvened placement of a stop-loss beyond the range.
❤️Sending you lots of Love and Hugs❤️

SILVER: The Market Is Looking Down! Short!
My dear friends,
Today we will analyse SILVER together☺️
The in-trend continuation seems likely as the current long-term trend appears to be strong, and price is holding below a key level of 30.436 So a bearish continuation seems plausible, targeting the next low. We should enter on confirmation, and place a stop-loss beyond the recent swing level.
❤️Sending you lots of Love and Hugs❤️

EURUSD: Strong Bullish Sentiment! Long!
My dear friends,
Today we will analyse EURUSD together☺️
The market is at an inflection zone and price has now reached an area around 1.10453 where previous reversals or breakouts have occurred.And a price reaction that we are seeing on multiple timeframes here could signal the next move up so we can enter on confirmation, and target the next key level of 1.10992.Stop-loss is recommended beyond the inflection zone.
❤️Sending you lots of Love and Hugs❤️

GOLD: Bears Are Winning! Short!
My dear friends,
Today we will analyse GOLD together☺️
The price is near a wide key level
and the pair is approaching a significant decision level of 3,082.61 Therefore, a strong bearish reaction here could determine the next move down.We will watch for a confirmation candle, and then target the next key level of 3,023.93..Recommend Stop-loss is beyond the current level.
❤️Sending you lots of Love and Hugs❤️

CADJPY: Bullish Continuation & Long Signal
CADJPY
- Classic bullish formation
- Our team expects pullback
SUGGESTED TRADE:
Swing Trade
Long CADJPY
Entry - 101.91
Sl - 101.20
Tp - 103.24
Our Risk - 1%
Start protection of your profits from lower levels
Disclosure: I am part of Trade Nation's Influencer program and receive a monthly fee for using their TradingView charts in my analysis.
❤️ Please, support our work with like & comment! ❤️

BTCUSD ChatGPT: Chart Analysis for Bitcoin (1-Hour Timeframe) – April 08, 2025
Key Observations:
1. Price Action and Trend:
- Bitcoin is in a downtrend, as indicated by the blue descending trendlines, creating lower highs and lower lows.
- The resistance zone is near 80,000, with 79,161 acting as a key level of resistance.
- Price is currently approaching the support level, which is in the range of 75,000 to 77,000, indicating a potential area for price reversal or further decline.
2. Order Block and FVG (Fair Value Gap):
- The order block located near 79,161 to $79,000 is an important zone where price rejected and fell previously. This suggests that sellers have been controlling this level, and it may act as a strong resistance again if the price revisits.
- …
ChatGPT: - As Bitcoin approaches the support level, a surge in volume could indicate a possible breakout or a reversal from the support zone.
4. Target and Potential Movement:
- The target for the current setup is 79,161, near the upper resistance zone, with potential upward momentum from the support area.
- Bitcoin is likely to reach the 79,161 target after bouncing from the support zone. However, if the price fails to break through the resistance, a drop back to the support zone or even further downward movement may occur.
Potential Scenarios:
- Bullish Reversal: If Bitcoin bounces from the support level and breaks above the resistance at 79,161, it may push higher towards 80,000 and beyond. The FVG area will be a critical point to monitor for further upward m…
ChatGPT: Currently, Bitcoin is at a pivotal point, testing support while trying to break through resistance. The next price action will depend on how Bitcoin reacts at these key levels. Traders should keep an eye on 79,161, which could be a crucial turning point for the market direction. If the support holds, a reversal is possible, but failure to maintain the support could lead to further declines.

GBPNZD: Bearish Continuation
The charts are full of distraction, disturbance and are a graveyard of fear and greed which shall not cloud our judgement on the current state of affairs in the GBPNZD pair price action which suggests a high likelihood of a coming move down.
Disclosure: I am part of Trade Nation's Influencer program and receive a monthly fee for using their TradingView charts in my analysis.
❤️ Please, support our work with like & comment! ❤️

USDCHF: Forecast & Trading Plan
The analysis of the USDCHF chart clearly shows us that the pair is finally about to go up due to the rising pressure from the buyers.
Disclosure: I am part of Trade Nation's Influencer program and receive a monthly fee for using their TradingView charts in my analysis.
❤️ Please, support our work with like & comment! ❤️

GOLD: Short Signal with Entry/SL/TP
GOLD
- Classic bearish pattern
- Our team expects retracement
SUGGESTED TRADE:
Swing Trade
Sell GOLD
Entry - 3044.0
Stop - 3051.7
Take - 3027.6
Our Risk - 1%
Start protection of your profits from lower levels
Disclosure: I am part of Trade Nation's Influencer program and receive a monthly fee for using their TradingView charts in my analysis.
❤️ Please, support our work with like & comment! ❤️

USDCAD On The Rise! BUY!
My dear friends,
Please, find my technical outlook for USDCAD below:
The instrument tests an important psychological level 1.4161
Bias - Bullish
Technical Indicators: Supper Trend gives a precise Bullish signal, while Pivot Point HL predicts price changes and potential reversals in the market.
Target - 1.4266
Recommended Stop Loss - 1.4101
About Used Indicators:
Super-trend indicator is more useful in trending markets where there are clear uptrends and downtrends in price.
Disclosure: I am part of Trade Nation's Influencer program and receive a monthly fee for using their TradingView charts in my analysis.
———————————
WISH YOU ALL LUCK

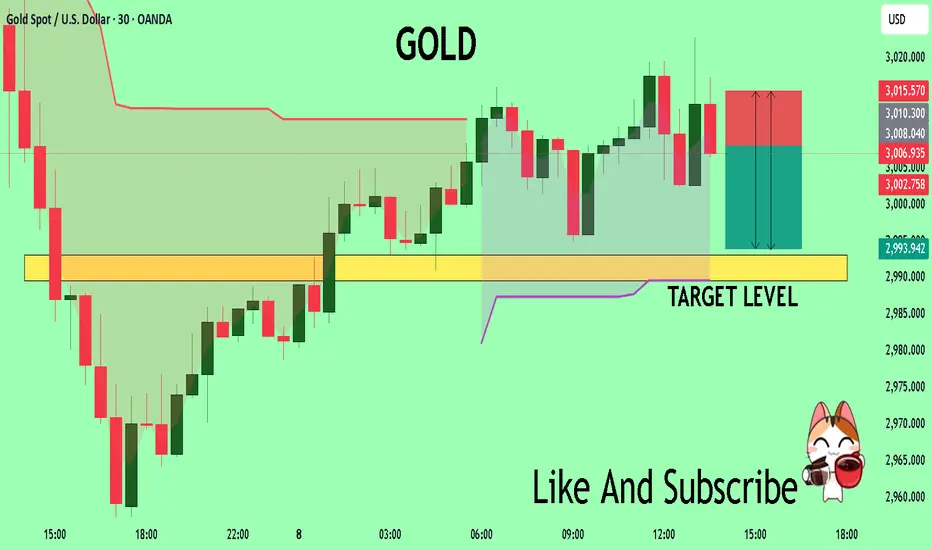
GOLD My Opinion! SELL!
My dear friends,
Please, find my technical outlook for GOLD below:
The instrument tests an important psychological level 3007.7
Bias - Bearish
Technical Indicators: Supper Trend gives a precise Bearish signal, while Pivot Point HL predicts price changes and potential reversals in the market.
Target - 2993.1
Recommended Stop Loss - 3015.5
About Used Indicators:
Super-trend indicator is more useful in trending markets where there are clear uptrends and downtrends in price.
Disclosure: I am part of Trade Nation's Influencer program and receive a monthly fee for using their TradingView charts in my analysis.
———————————
WISH YOU ALL LUCK
NZDCAD What Next? SELL!
My dear subscribers,
This is my opinion on the NZDCAD next move:
The instrument tests an important psychological level 0.7949
Bias - Bearish
Technical Indicators: Supper Trend gives a precise Bearish signal, while Pivot Point HL predicts price changes and potential reversals in the market.
Target - 0.7903
About Used Indicators:
On the subsequent day, trading above the pivot point is thought to indicate ongoing bullish sentiment, while trading below the pivot point indicates bearish sentiment.
Disclosure: I am part of Trade Nation's Influencer program and receive a monthly fee for using their TradingView charts in my analysis.
———————————
WISH YOU ALL LUCK

#Bitcoin (April9)The most in-demand buying zones in Bitcoin —don’t miss the opportunity! :)
Naturally, you can freely use the levels for a new order or for TP of your positions. The levels are updated daily!
The results of price reaction to these levels will be shown in the upcoming videos.

USOIL ChatGPT: Chart Analysis for WTI Crude Oil (1-Hour Timeframe) – April 08, 2025
Key Observations:
1. Trend and Price Action:
- WTI Crude Oil has been trading in a range-bound pattern, as shown by the blue trendlines. The price has been bouncing between the resistance and support levels. Currently, the price is at the lower end of this range near the support level around 58.88.
- The resistance level is at 59.05, and this has been tested multiple times without a sustained breakout, indicating that sellers have been in control around this level.
- The price just tested the support level and bounced slightly higher, which suggests the market may be consolidating before deciding the next move.
2. Order Block and FVG (Fair Value Gap):
- The order block is located…
ChatGPT: - Fair Value Gap (FVG) has been formed around the order block. This means there’s an imbalance in the market that could eventually be filled. Traders should watch for price action near this gap for further insight into whether the gap will be filled or left untested.
3. Volume:
- Volume is relatively low, which suggests a lack of strong momentum in the market. This is typical in range-bound markets, where buying and selling activity are often balanced.
- However, the volume has spiked during the downward move, which could indicate a potential bearish continuation if the price breaks below 58.88.
4. Bearish Setup and Target:
- The chart is showing a bearish setup with the price trading below the resistance zone, and it is testing the support level near

Gold ChatGPT: Chart Analysis for Gold (XAU/USD) – April 08, 2025 – 1-Hour Timeframe
Key Observations:
1. Trend and Price Action:
- The price of Gold is currently in a downtrend, as indicated by the red trendline showing lower highs and lower lows. The price has recently broken below the previous support level, signaling a continuation of the bearish movement.
- The resistance zone near 3,141.64 remains a significant barrier for any upward movement, while the support level at 2,960.00 is holding the price from falling further.
2. Order Block and FVG (Fair Value Gap):
- The order block located at 3,138.95 to 3,141.64 has been a key area where price rejection occurred. The price approached this area but failed to break above, indicating strong selling pressure. This …
ChatGPT: - The target for the current bearish setup is 3,021, which aligns with the support level near 2,987.47. If the price continues to decline, this target could be reached soon, with further downside movement expected.
- If the price holds at the support level and forms a bullish reversal pattern, it may head back towards the resistance zone. However, until the support level holds, the price is likely to continue the downward trajectory.
4. Volume and Market Sentiment:
- The volume shows a consistent decline, confirming the selling pressure. The recent spikes in volume near the support level suggest that the market is reacting to the critical support area.
- Market sentiment remains bearish, with the price currently below its recent highs and the resistan…
ChatGPT: - Bullish Reversal Scenario: If Gold finds support at 2,960 and forms a bullish pattern (such as a reversal candle or engulfing candle), the price might move towards 3,141.64 again.
Conclusion:
The price of Gold is currently in a downtrend, facing resistance around 3,141.64 and support near 2,960. Traders should watch for price action near these levels to assess the next move. The target of 3,021 is the key level to focus on, and a breakout below this could lead to further downside. If the support level holds, there could be a potential for a bullish rebound towards resistance.

DAX: Next Move Is Down! Short!
My dear friends,
Today we will analyse DAX together☺️
The recent price action suggests a shift in mid-term momentum. A break below the current local range around 20,299.80 will confirm the new direction downwards with the target being the next key level of 19,659.04.and a reconvened placement of a stop-loss beyond the range.
❤️Sending you lots of Love and Hugs❤️
