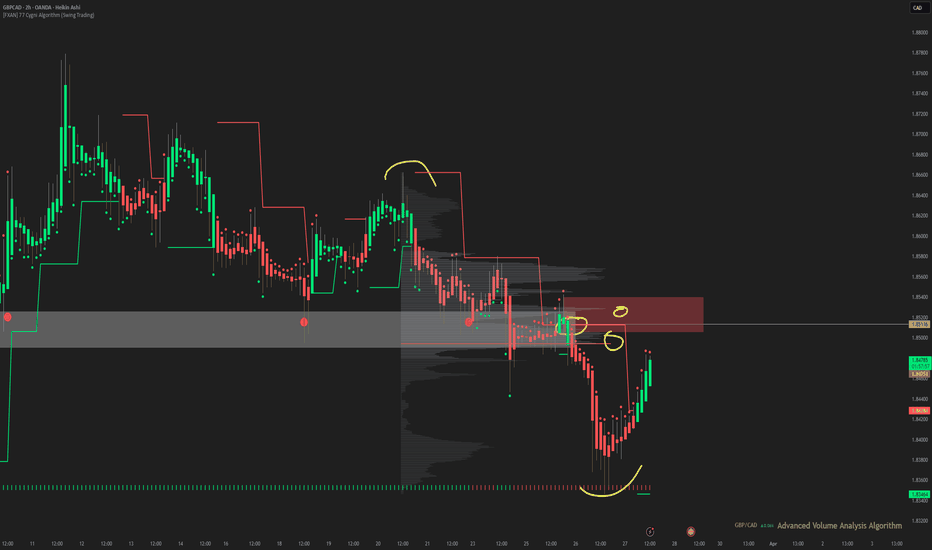
NZDCHF Set To Grow! BUY!
My dear followers,
I analysed this chart on NZDCHF and concluded the following:
The market is trading on 0.5520 pivot level.
Bias - Bullish
Technical Indicators: Both Super Trend & Pivot HL indicate a highly probable Bullish continuation.
Target - 0.5563
Safe Stop Loss - 0.5491
About Used Indicators:
A super-trend indicator is plotted on either above or below the closing price to signal a buy or sell. The indicator changes color, based on whether or not you should be buying. If the super-trend indicator moves below the closing price, the indicator turns green, and it signals an entry point or points to buy.
———————————
WISH YOU ALL LUCK
Trading-signals
EURCAD What Next? SELL!
My dear friends,
Please, find my technical outlook for EURCAD below:
The price is coiling around a solid key level - 1.4860
Bias - Bearish
Technical Indicators: Pivot Points Low anticipates a potential price reversal.
Super trend shows a clear sell, giving a perfect indicators' convergence.
Goal - 1.4822
Safe Stop Loss - 1.4888
About Used Indicators:
The pivot point itself is simply the average of the high, low and closing prices from the previous trading day.
———————————
WISH YOU ALL LUCK
GBPCAD My Opinion! SELL!
My dear friends,
Please, find my technical outlook for GBPCAD below:
The instrument tests an important psychological level 1.7453
Bias - Bearish
Technical Indicators: Supper Trend gives a precise Bearish signal, while Pivot Point HL predicts price changes and potential reversals in the market.
Target - 1.7409
About Used Indicators:
Super-trend indicator is more useful in trending markets where there are clear uptrends and downtrends in price.
———————————
WISH YOU ALL LUCK
GOLD Massive Long! BUY!
My dear subscribers,
My technical analysis for GOLD is below:
The price is coiling around a solid key level - 2329.4
Bias - Bullish
Technical Indicators: Pivot Points Low anticipates a potential price reversal.
Super trend shows a clear buy, giving a perfect indicators' convergence.
Goal - 2341.4
About Used Indicators:
By the very nature of the supertrend indicator, it offers firm support and resistance levels for traders to enter and exit trades. Additionally, it also provides signals for setting stop losses
———————————
WISH YOU ALL LUCK
GBPAUD Expected Growth! BUY!
My dear followers,
I analysed this chart on GBPAUD and concluded the following:
The market is trading on 1.9104 pivot level.
Bias - Bullish
Technical Indicators: Both Super Trend & Pivot HL indicate a highly probable Bullish continuation.
Target - 1.9173
About Used Indicators:
A super-trend indicator is plotted on either above or below the closing price to signal a buy or sell. The indicator changes color, based on whether or not you should be buying. If the super-trend indicator moves below the closing price, the indicator turns green, and it signals an entry point or points to buy.
———————————
WISH YOU ALL LUCK
NZDUSD Set To Fall! SELL!
My dear subscribers,
NZDUSD looks like it will make a good move, and here are the details:
The market is trading on 0.6188 pivot level.
Bias - Bearish
My Stop Loss - 0.6221
Technical Indicators: Both Super Trend & Pivot HL indicate a highly probable Bearish ) continuation.
Target - 0.6139
About Used Indicators:
The average true range ATR plays an important role in 'Supertrend' as the indicator uses ATR to calculate its value. The ATR indicator signals the degree of price volatility.
———————————
WISH YOU ALL LUCK
AUDJPY The Target Is DOWN! SELL!
My dear friends,
Please, find my technical outlook for AUDJPY below:
The instrument tests an important psychological level 104.61
Bias - Bearish
Technical Indicators: Supper Trend gives a precise Bearish signal, while Pivot Point HL predicts price changes and potential reversals in the market.
Target - 103.93
Recommended Stop Loss - 105.04
About Used Indicators:
Super-trend indicator is more useful in trending markets where there are clear uptrends and downtrends in price.
———————————
WISH YOU ALL LUCK
Bullish DXYMonthly:
1. Direction:
Bullish
2. Reasons:
1. Price is coming to discount.
2. A good Displacement
Weekly:
1. Direction:
Bullish
2. Reasons:
1. Price is reaching towards weekly FVG
2. No FVG formed in bearish move
3. Price is moving from ERL to IRL
Daily:
1. Direction:
Bullish
2. Reasons:
1. Price is going for weekly FVG
2. Price is coming in discount area
4H:
1. Direction:
Bearish
2. Reasons:
1. FVG
2. BOS with displacement
BTCUSD The Target Is UP! BUY!
My dear subscribers,
My technical analysis for BTCUSD is below:
The price is coiling around a solid key level - 67651.
Bias - Bullish
Technical Indicators: Pivot Points Low anticipates a potential price reversal.
Super trend shows a clear buy, giving a perfect indicators' convergence.
Goal - 69199
My Stop Loss - 66702
About Used Indicators:
By the very nature of the supertrend indicator, it offers firm support and resistance levels for traders to enter and exit trades. Additionally, it also provides signals for setting stop losses
———————————
WISH YOU ALL LUCK
QQQ Trading Opportunity! BUY!
My dear friends,
Please, find my technical outlook for QQQ below:
The price is coiling around a solid key level - 451.74
Bias - Bullish
Technical Indicators: Pivot Points Low anticipates a potential price reversal.
Super trend shows a clear buy, giving a perfect indicators' convergence.
Goal - 455.42
About Used Indicators:
The pivot point itself is simply the average of the high, low and closing prices from the previous trading day.
———————————
WISH YOU ALL LUCK
GBPCHF Technical Analysis! BUY!
My dear friends,
My technical analysis for GBPCHF is below:
The market is trading on 1.1450 pivot level.
Bias - Bullish
Technical Indicators: Both Super Trend & Pivot HL indicate a highly probable Bullish continuation.
Target - 1.1527
Recommended Stop Loss - 1.1400
About Used Indicators:
A pivot point is a technical analysis indicator, or calculations, used to determine the overall trend of the market over different time frames.
———————————
WISH YOU ALL LUCK
EURUSD Will Collapse! SELL!
My dear friends,
EURUSD looks like it will make a good move, and here are the details:
The market is trading on 1.0851 pivot level.
Bias - Bearish
Technical Indicators: Supper Trend generates a clear short signal while Pivot Point HL is currently determining the overall Bearish trend of the market.
Goal - 1.0830
About Used Indicators:
Pivot points are a great way to identify areas of support and resistance, but they work best when combined with other kinds of technical analysis
———————————
WISH YOU ALL LUCK
FLOATING SPREAD VS FIXED SPREAD🌐 The trading conditions of any account specify the type of spread: floating or fixed. As a rule, the value of a fixed spread is larger, but a floating spread has an insidious wording “from...” in the terms and conditions. This means that the floating spread may well be greater than the fixed one. Nevertheless, it is considered better. What are its advantages and disadvantages, what spread to choose?
📍 ADVANTAGES AND DISADVANTAGES OF FLOATING SPREAD
▶️ FIXED SPREAD
The difference between the buy and sell price of an asset is constant. This indicates that the broker works according to Straight Through Processing (STP) model - directly with a specific liquidity provider, the size of the spread with which is pre-agreed. The broker charges its commission (markup) and the trader sees the final difference. The fixed spread is only theoretical. Often in the offer there is a clause that the broker can unilaterally change it. And broker does it at the moment of news release, when volatility increases sharply.
▶️ FLOATING SPREAD
The difference between price/offer is formed by the market. The broker only adds its small commission, that's why there are no zero spreads.
Floating spreads are set on ECN accounts, where orders are not placed to a specific liquidity provider, but to the general market. Such accounts have a high entry threshold and a fixed commission for each lot placed on the account.
📍 THE FLOATING SPREAD DEPENDS ON:
🔘 Market Liquidity. During the vacation season, on the eve of vacations, at the moment of flat trading activity decreases. The smaller the volumes and the fewer traders, the bigger the gap between Bid and Ask prices.
🔘 Currency Liquidity. Or investors' interest. The FX:EURUSD pair is liquid, the pair of the US dollar with the South African rand is called exotic and the spread on it is one of the largest.
🔘 Volatility. Or the speed of trend movement. If after the news release the imbalance of bids in the direction of buyers or sellers sharply increases, the spread will also grow.
🔘 Time of day. Or the period of activity of traders of this or that region.
📍 ADVANTAGES OF A FLOATING SPREAD:
➡️ Most of the time it is less than the fixed spread.
➡️ No requotes - the transaction is executed in any case.
➡️ Floating spread is more profitable than fixed spread for liquid currencies. Fixed spread is more profitable for “exotics”.
➡️ It is favorable for scalping, where every tenth of a point is important for profit.
📍 DISADVANTAGES OF FLOATING SPREAD:
➡️ There are slippages at the moment of sharp spread widening.
➡️ It is necessary to constantly monitor its change.
➡️ It can sharply increase when a fundamental factor appears.
➡️ There is still a risk of artificial spread widening by the broker (it is not easy to prove).
➡️ Increases emotional tension. With a fixed spread a trader always knows the amount of expenses. Expansion of a floating spread can turn a profitable trade into a losing one.
If you open a new account with a broker, pay attention to the following points. In what cases the broker has the right to change the fixed spread. What quotes we are talking about. Outdated data on the website may turn out to be conditions for 4-digit quotes.
Compare spreads at different brokers on a demo account; install a script showing the current spread. Run it on one asset, watch how and when the floating spread might widen.
📍 CONCLUSION
The choice between a fixed spread and a floating spread depends on several factors, including market liquidity, currency pair, volatility, and time of day. While fixed spreads offer a set and predictable price difference, floating spreads can be more competitive and profitable, especially for scalping strategies. However, floating spreads also come with risks, such as slippage and the need to constantly monitor spread changes. When opening a new account with a broker, it's essential to pay attention to the terms and conditions, clarify quotes, compare spreads across different brokers, and test the floating spread on a demo account.
Traders, If you liked this educational post🎓, give it a boost 🚀 and drop a comment
USDCAD Will Collapse! SELL!
My dear followers,
I analysed this chart on USDCAD and concluded the following:
The market is trading on 1.3685 pivot level.
Bias - Bearish
Technical Indicators: Both Super Trend & Pivot HL indicate a highly probable Bearish continuation.
Target - 1.3638
Safe Stop Loss - 1.3718
About Used Indicators:
A super-trend indicator is plotted on either above or below the closing price to signal a buy or sell. The indicator changes color, based on whether or not you should be buying. If the super-trend indicator moves below the closing price, the indicator turns green, and it signals an entry point or points to buy.
———————————
WISH YOU ALL LUCK
APPLE Buyers In Panic! SELL!
My dear followers,
I analysed this chart on APPLE and concluded the following:
The market is trading on 192.38 pivot level.
Bias - Bearish
Technical Indicators: Both Super Trend & Pivot HL indicate a highly probable Bearish continuation.
Target - 184.58
Safe Stop Loss - 197.26
About Used Indicators:
A super-trend indicator is plotted on either above or below the closing price to signal a buy or sell. The indicator changes color, based on whether or not you should be buying. If the super-trend indicator moves below the closing price, the indicator turns green, and it signals an entry point or points to buy.
———————————
WISH YOU ALL LUCK
NATGAS Trading Opportunity! BUY!
My dear friends,
Please, find my technical outlook for NATGAS below:
The instrument tests an important psychological level 2.503
Bias - Bullish
Technical Indicators: Supper Trend gives a precise Bullish signal, while Pivot Point HL predicts price changes and potential reversals in the market.
Target - 2.683
About Used Indicators:
Super-trend indicator is more useful in trending markets where there are clear uptrends and downtrends in price.
———————————
WISH YOU ALL LUCK
QQQ Will Collapse! SELL!
My dear subscribers,
This is my opinion on the QQQ next move:
The instrument tests an important psychological level 458.03
Bias - Bearish
Technical Indicators: Supper Trend gives a precise Bearish signal, while Pivot Point HL predicts price changes and potential reversals in the market.
Target - 442.80
My Stop Loss - 467.33
About Used Indicators:
On the subsequent day, trading above the pivot point is thought to indicate ongoing bullish sentiment, while trading below the pivot point indicates bearish sentiment.
———————————
WISH YOU ALL LUCK
NZDUSD Set To Fall! SELL!
My dear subscribers,
NZDUSD looks like it will make a good move, and here are the details:
The market is trading on 0.6149 pivot level.
Bias - Bearish
Technical Indicators: Both Super Trend & Pivot HL indicate a highly probable Bearish continuation.
Target - 0.6110
About Used Indicators:
The average true range (ATR) plays an important role in 'Supertrend' as the indicator uses ATR to calculate its value. The ATR indicator signals the degree of price volatility.
———————————
WISH YOU ALL LUCK
USDCAD Under Pressure! SELL!
My dear friends,
Please, find my technical outlook for USDCAD below:
The price is coiling around a solid key level - 1.3668
Bias - Bearish
Technical Indicators: Pivot Points High anticipates a potential price reversal.
Super trend shows a clear sell, giving a perfect indicators' convergence.
Goal - 1.3631
Safe Stop Loss - 1.3695
About Used Indicators:
The pivot point itself is simply the average of the high, low and closing prices from the previous trading day.
———————————
WISH YOU ALL LUCK
AUDCHF Technical Analysis! BUY!
My dear friends,
AUDCHF looks like it will make a good move, and here are the details:
The market is trading on 0.5990 pivot level.
Bias - Bullish
Technical Indicators: Supper Trend generates a clear long signal while Pivot Point HL is currently determining the overall Bullish trend of the market.
Goal - 0.6031
Recommended Stop Loss - 0.5966
About Used Indicators:
Pivot points are a great way to identify areas of support and resistance, but they work best when combined with other kinds of technical analysis
———————————
WISH YOU ALL LUCK
GOLD Trading Opportunity! BUY!
My dear friends,
Please, find my technical outlook for GOLD below:
The instrument tests an important psychological level 2342.7
Bias - Bullish
Technical Indicators: Supper Trend gives a precise Bullish signal, while Pivot Point HL predicts price changes and potential reversals in the market.
Target - 2348.5
About Used Indicators:
Super-trend indicator is more useful in trending markets where there are clear uptrends and downtrends in price.
———————————
WISH YOU ALL LUCK
GBPCHF What Next? BUY!
My dear friends,
My technical analysis for GBPCHF is below:
The market is trading on 1.1509 pivot level.
Bias - Bullish
Technical Indicators: Both Super Trend & Pivot HL indicate a highly probable Bullish continuation.
Target - 1.1593
Recommended Stop Loss - 1.1454
About Used Indicators:
A pivot point is a technical analysis indicator, or calculations, used to determine the overall trend of the market over different time frames.
———————————
WISH YOU ALL LUCK