Descending triangle : Chart pattern on Gold 15 min time framedescending triangle one of classic chart pattern on 15 min time frame.
Elliott wave chat pattern trading strategy.
This type of chart pattern are often made in 2,4 or B corrective wave
Triangle

eurjpy daily time framein weekly and daily time frame we expect bearish market
1 . Descending triangle
2 . breaked out previous bullish trend lines
3 . Trend is downtrend in bigger time frames
4 . pass higher low and strong support ( if price reached to Entry zone ) below of higher low
5 . actually we are in another descending triangle in weekly time frame that seems we are facing with strong bearish market
Notice that only enter after confirmations . Then Get and Forget with suit sl
targets are placed by fibonacci and support resistance lines
sl in this case will be upper that higher high
we should wait to see what will happen
what do you think ?! swapping idea helps to find new view ♥

Trading Triangles: Part TwoAt Target One of the Daily Triangle 50% of the position is closed.
It would then be logical to assume Price would drop by 50% of the move from Entry.
Price did not drop by 50% and instead began to form a new Triangle pattern.
Dropping to a lower time frame (4H) we can see the process begin to repeat itself.
Targets One and Two for the 4H Triangle are shown below.

Trading Triangles: Part OneTriangles occur during periods of consolidation.
They represent indecision in the market as to whether the overall trend will reverse or continue.
The direction is confirmed by a candle close above or below the boundaries of the triangle.


How To Trade an Ascending Triangle - Educational PostHOW TO TRADE THE ASCENDING TRIANGLE?
1. Wait for the price to breakout from the inside of the triangle.
2. Enter the trade when price retest the breakout level.
3. Set your Stop-Loss below the last Lower Low of the market structure.
4. Set target to be equal with the distance from A to B.
This tutorial contains educational material.
Please hit the LIKE button to support me!
FOLLOW ME if you liked this post and want to see more educational post and trading ideas.
Thank you!

Binance Hot list coin July 15, 2020 : XMRUSDT #3Looking similar with the other 2 coins IOTA and BNB. Currently the price is trending slightly below the resistance zone of the ascending triangle pattern for short term perspective. But, for longer term perspective there is a small gap for the price to test the resistance trend line that is a strong resistance zone. Breaking above this resistance trend line will lead the price to the new up trend bias in long term. The hidden bullish divergence is occurring and I think the take off will take place soon.

Binance Hot list coin July 15, 2020 : IOTAUSDT #2Currently the price is trending slightly below the strong resistance horizontal line (white). Beside that, there is still another hidden bullish divergence on RSI that is forming now. Breaking above this resistance will leads the price to interim swing high as the nearest target.

Binance Hot list coin July 13, 2020 : ETCUSDT #2Here is my premature deduction based on the Elliot Wave Theory and count on Ethereum Classic. There could be a complex and flat correction wave on 4th which forms a potential descending triangle that usually becomes a failure. Beside, the RSI has its first peak and there could potentially the 2nd peak which forms a lower high but higher high on the price. Breaking out above the resistance trend line will activate my laddering buy.

Binance Hot list coin July 13, 2020 : QTUMUSDT #1Quantum is looking good for now. The action of slowing down of the volatility and the fact of the contracting triangle to form after a huge break out from the white resistance trend line could be the action of the accumulation zone. During this accumulation phase, the bulls is slowly gaining some momentum of potential breaks out to the upside of the triangle. Currently there is a hidden bullish divergence occurs between price, RSI and MACD. This is one of a good sign of potential bullish continuation.

Binance Hot list coin July, 7th 2020 : NPXSUSDT #2The price is currently forming a Symmetrical triangle with the sign of lower in volume and volatility. On the 2 hours chart the price is trending slightly above the EMA 55 (yellow) which acts as a dynamic support. This is however a strong support for Pundi X. While the price comes closer to the APEX of the triangle, I'll expect a breaks toward the upside and targeting the white region as the nearest resistance and the interim swing high.

Binance Hot list coin July, 4th 2020 : IOTAUSDT #2IOTA is currently trending above the white resistance trend line after a phase 1 of break out strategy. there is a high probability that at current structure, the price is forming the 2nd phase of break out strategy which is retesting the previous broken resistance as a support.
After this break out, the price forms a descending type of triangle which I expect it to become a failure with a break out to the upside. The confirmation of buy is when it has broken out of the upper line of the triangle and simply targeting the interim swing high.

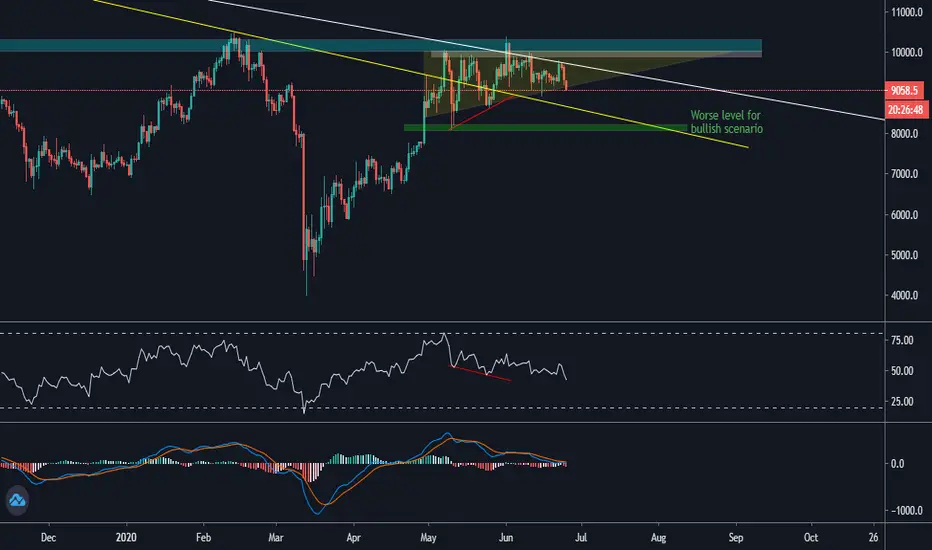
Bitcoin : Is it time for reversal?Bitcoin is now at a very crucial momentum with a lot of bearish pressure has occurred in the short term and lower degree of cycle. This is however still a normal behavior from the market and the choppiness that is still ideal when you see the price tries to break out of the psychological level like $10000 region.
If you say that the price is going to reverse at current rate, I do believe it's totally invalid bias because there are still a lot of strong support below this level that you must respect them. Beside there are 2 signs that shows us the price is still in the stage of potential bullish structure. The first sign is the ascending triangle that is still in play. The price has been trending inside this triangle since the beginning of May 2020 and there is no doubt that the price is still maintaining the higher low structure.
The 2nd sign of the continuation to the upside will be on the RSI. There is a higher low on the price action but the RSI has printed a lower low which indicates current condition as the hidden bullish divergence as well.
My worse case scenario (for bullish bias) is that the price can touches the green region as the interim swing low of current structure. If the price breaks below this region, I will come again and review my bullish bias.
Psychology behind Ascending and Descending Triangles PatternJust as with ascending triangles, most of the times, the price will break the horizontal support line, and continue with the move lower.
there is usually psychology behind every chart pattern ; and ascending and descending triangles are no exception.
Follow me closely as we will now ‘investigate’ the PSYCHOLOGY behind ascending triangles :
To make the analysis easier, let’s think of the ascending triangle pattern as a visualization of an ongoing battle between the bulls (#buyers) and the bears (#sellers).
The bulls keep pushing the stock up in price until they get overpowered by the bears/sellers at the horizontal resistance level.
It is at that resistance level that bears/sellers attempt to push the price down.
Though sellers are somehow successful in pushing the price down, they are however unable to push the price to the previous low levels, as bulls/buyers are persistent, and the price sets a higher low (bottom trend line).
This pattern continues until the price action becomes confined to the vertex of the triangle, representing a pivotal moment in this battle. At this point, either the bears will win, and the stock will break the bottom trend line, or the bulls will win and break the horizontal resistance line.
If history is anything to go by, this pattern favors the bulls, and if the horizontal resistance line is broken, the bulls will be able to push the price up, triggering a breakout.
This same psychology also applies to descending triangles, but in reverse .
Now let’s looks at how we can to make money from this chart pattern:
1. Wait for the Breakout –we should wait price to break above the horizontal resistance line before placing a trade.
2. Lookout for Volume – High volume usually represents conviction behind a move, indicating that a large number of traders want a position in the stock. While above average volume is not necessary for an ascending triangle pattern breakout, it may increase the likelihood of a stronger move.
3. Look for Confirmation – If an ascending triangle breakout is genuine, the flat line resistance level should become a support level. If the stock starts to pullback after the breakout, you should look for the previous resistance level to hold as support. This will help confirm the legitimacy of the breakout. It also allows traders who missed the initial move to take a position
4. Have an Exit Plan – All trades require an exit plan for both favorable and unfavorable outcomes.
For ascending triangles, Stop loss should typically be placed just below the previous horizontal resistance (which will now be acting as support).
Thanks for Your Likes & Support & Subscribe....

THE ASCENDING AND DESCENDING TRIANGLE CHART PATTERN
Ascending triangles are classified as continuation Patterns . Here are the key elements that make up an ascending triangle:
1. Bottom Trend Line(Support) – An ascending triangle is characterized by a bottom trend line that is formed as the price continues to set higher lows. The more touch points on the trend line, the more reliable it will be.
2. Horizontal Resistance Line – An ascending triangle also contains a flat horizontal resistance line that is formed as the stock continues to reject its previous highs (for a given period). Once again, the more touch points on the resistance line, the more reliable the pattern will be.
You must be wondering how the chart pattern get to be formed?
What happens during the formation of an ascending triangle is that there is a certain level that the buyers cannot seem to break ( red resistance line ).
However, as evidenced by the higher lows ( green uptrend support line ), buyers will gradually push the price up, hence we end up with an uptrend of higher lows.
As buyers and sellers keep putting pressure, a breakout will become inevitable.
Though a price breakout is inevitable, the big question is, “ Who will break the price, buyers or sellers? Will the buyers be able to break that resistance level, or will the resistance be too strong?”
Well, the answer is, most of the times the price will break the resistance area and go up.
However, it is not always the case, sometimes, the resistance is too strong for buyers to break.
Now let’s look at its inverse, the DESCENDING TRIANGLE CHAT PATTERN
In a descending triangle chart pattern, as can be seen on the BTCUSD chart above, there is a string of lower highs which forms the upper line (red resistance line). The lower line is a support area (green horizontal line) in which the price seems to be failing to break.
Just as with ascending triangles, most of the times, the price will break the horizontal support line, and continue with the move lower.
Follow me closely as we will now ‘investigate’ the PSYCHOLOGY behind ascending triangles:
To make the analysis easier, let’s think of the ascending triangle pattern as a visualization of an ongoing battle between the bulls (buyers) and the bears (sellers).
The bulls keep pushing the stock up in price until they get overpowered by the bears/sellers at the horizontal resistance level.
It is at that resistance level that bears/sellers attempt to push the price down.
Though sellers are somehow successful in pushing the price down, they are however unable to push the price to the previous low levels, as bulls/buyers are persistent, and the price sets a higher low (bottom trend line).
This pattern continues until the price action becomes confined to the vertex of the triangle, representing a pivotal moment in this battle. At this point, either the bears will win, and the BTC will break the bottom trend line, or the bulls will win and break the horizontal resistance line.
If history is anything to go by, this pattern favors the bulls, and if the horizontal resistance line is broken, the bulls will be able to push the price up, triggering a breakout.
Thanks for Your Likes & Support & Subscribe....

Bitcoin | Ascending Triangle & EMA50..!!BTCUSD (Update)
In Daily Chart, Bitcoin forming Ascending Triangle Pattern.
Daily EMA50 acting As Strong Support (Tested 3 Times in last 34 Days)
In Bullish Case, If Resistance (10.4k) got Cleared, Next Stop Would be 11666.
If Ascending Triangle & EMA50 (9.1K) Broken Down, then Bitcoin Might Test the Major Support (8.2k)
By the Way, Volume has been Decreasing Since 10 May (Halving Hype), Big Move Ahead So Be Ready for Both Bullish & Bearish Scenarios.
What We Do Now ??
If You're Holding Bitcoin, Set Stop Loss Below Daily EMA50 (9105) & Wait for Triangle Breakout..!!
In Longterm, Bitcoin Might Retest the 6666 Area Before Triangle Breakout,
Please like the idea for Support & Subscribe for More ideas like this and share your ideas and charts in Comments Section..!!
Thanks for Your Love & Support..!

BTCUSD on log scale with words and linesThis is a chart with the entire pattern of BTCUSD value from pre-2009 projecting into 2030

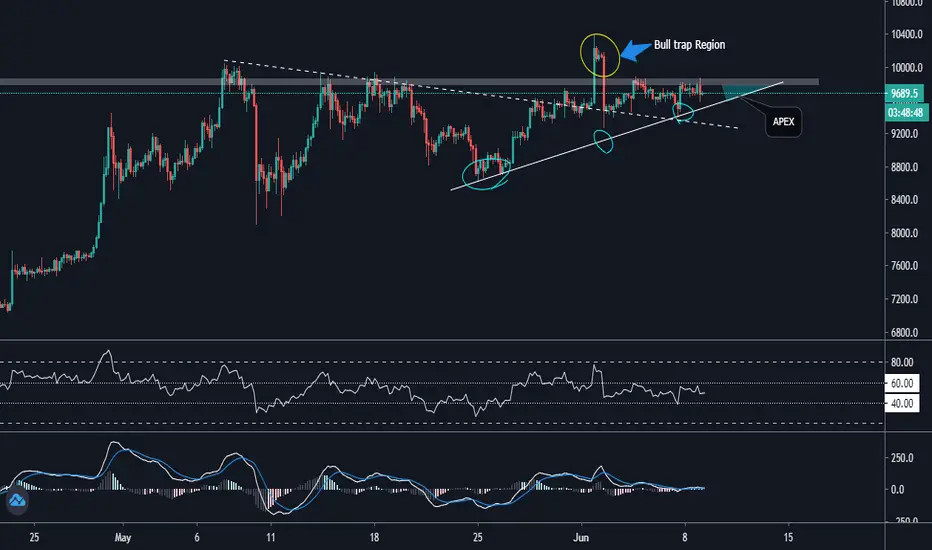
Between the higher low structure and the strong resistanceHello all, I want to give an update of current market's condition. We have seen some high volatility movement lately in the last 8 hours, will it become the confirmation of the next potential moves? let's see!
There isn't any strong argument that can deny current resistance level that the bitcoin faces. There is a huge historical price action and the major psychological area above current price right now. Since the May 24th, 2020 the price has frequently printed a higher low moves which is a good sign for the bitcoin in overall. But, we've seen a type of bullish trap too that occurred between June 1st - 2nd.
So, considering the strong horizontal resistance ahead and the higher low structure since May 25th, I see that the bulls are trying very hard to gain any strong for the price to breaks out of the resistance zone. Now, assuming the ascending triangle to be in play, I'm pretty sure that the bulls will gain strength until it breaks out of the horizontal resistance. But, as a trader you may understand the risk of failure on any pattern which I can't ignore it. If the price breaks down of the trend line, I will get out of any trade that I'm in right now and will flip my long to short position.
We might see a further consolidation at this ascending triangle until it comes closer to the APEX and we'll see what will the next bias be. Currently still holding my long since $9500 but if the price breaks below the support trend line, I'll flip to short term short.
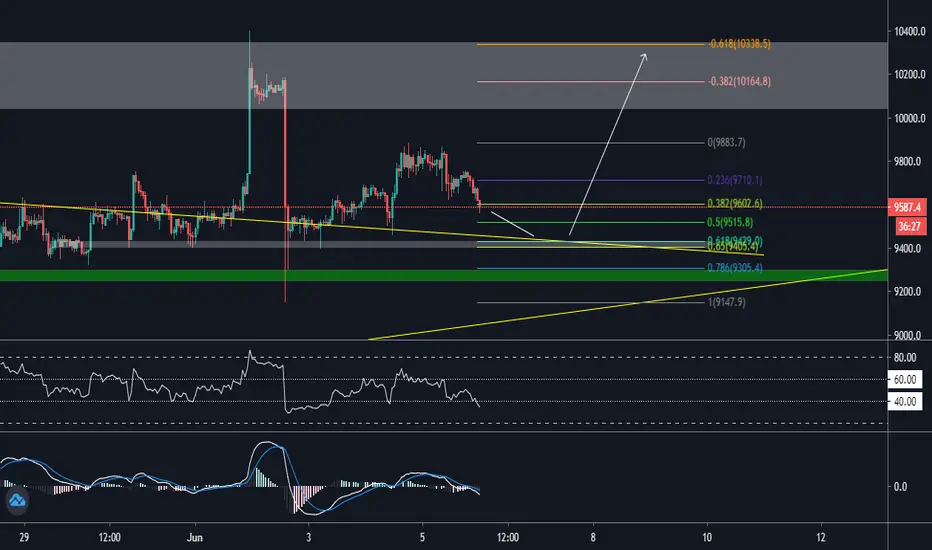
Bitcoin : Fibonacci and the perspective in 1 hour time frame.Hello all, Happy Saturday! Today I want to cover about today's potential volatility that could occur in the market. Now, let's do the technical analysis.
Whenever it comes to the weekend, usually the price will have an extra volatility due to the closes on the CME daily candle in the next 2 days and a potential addition volume from the retail traders. With this potential of much volatility, there will be a lot of faking out moves in the market as well. Wick fishing, squeeze are those thing that usually occur between Saturday and Sunday.
Now let's look at the RSI as one of my favorite volume indicator which in the lower time frame is now breaching the lower limit of the neutral zone and entering the bearish zone as well. I'm pretty sure that the bears will try to push the price lower to make the RSI trends at the oversold region. Similar action at the MACD histogram too, both the histogram and the trend lines are trending slight below the 0 level.
Based on the price action, the above statement is in align with the potential correction to the golden pocket zone which has the confluence with the previous broken resistance trend line of the contracting triangle (around $9400). In this case, I will assume a bounce after the price touches this region because this support region is the strong level for intraday level. I will expect the price bounces and head back to the interim swing high which is having an alignment with the -.618 fibonacci retracement as the ideal short term target as well.
Huge volatility incoming, just be cautious!
Bitcoin | Expanding Triangle & Crucial Support..!!#BTC (Update)
In Shorter Timeframe, Bitcoin Forming Expanding triangle Pattern...!!
3 Days ago, Bitcoin tested the 10.4k Resistance (Higher High) but Rejected it.
At the Moment, Holding the Crucial Support (9.3k) But Big Move Ahead.
Now There Are Two Possible Scenarios..
1- If Bulls lost the Support, Bitcoin might form Another Low (Might test 8k Area)
2- In Bullish Case, If Bulls Held the Support & Bounced Back 📈 , It Might Test the 10.6k Area (Major Resistance)
Be Ready for Both Bearish & Bullish Scenarios..📌
In Weekly Chart, Printing 9th TD Bearish Candle & Still Below the Major Downtrend Resistance 📉
If weekly Candle Closed Below trendline, Bitcoin Might Crash Again in Coming Days..!!
Another Weekly View...!!
Expecting Bearish Wave before Triangle Breakout... (6666 then 19191)
Please like the idea for Support & Subscribe for More ideas like this and share your ideas and charts in Comments Section..!!
Thanks for Your Love & Support..!

USD/CAD: Below 1.35 for picture-perfect triangle breakoutThe height of the descending triangle gives a target price below if projected downwards from the support price
(in this case its about 425 pips)

GBPJPY | Ascending Triangle & Major Resistance ..!!GBPJPY (Update)
In Daily Chart, Forming ascending triangle Pattern (Bullish Pattern)
At the Moment, Facing Major Resistance (135.40), If Bulls Failed to Clear it, expecting Trendline Retest ( Higher Low)
If Resistance got Cleared, Next Stop Would be 144.00 area (Next Major Resistance)
Please like the idea for Support & Subscribe for More ideas like this and share your ideas and charts in Comments Section..!!
Thanks for Your Love & Support..!

BITCOIN | BullRun 2020 Ahead..!!BTC/USD (Update)
In Weekly Chart, Bulls Facing Crucial Resistance (9.6k)
If Bulls Cleared the Resistance, Expecting Bitcoin Bullrun in Coming Weeks.📈
If Bulls Failed to Clear the Resistance, Bitcoin Might Retest the 6k Area in Late June..!!
Volume has been Decreasing from last 4-5 Weeks, While Bulls Need Power to Clear the Resistance.
I think Bitcoin Might form another Lower High before Breakout. (But We Should Wait for Clear Direction, So far There is no Sign of Breakout or Reversal)
In Weekly Chart, Bitcoin Printing 9th TD Bearish Candle & Facing Major Resistance as well..!!
If Current Weekly Candle Closed Below Resistance (9.6k), We Might See Bearish Wave in Coming Days.
In Shorter Timeframe Chart, Bitcoin has been forming Triangle But Not Completed yet, Expecting Tiny Bearish Wave towards the 9k before Breakout..!!
Please like the idea for Support & Subscribe for More ideas like this and share your ideas and charts in Comments Section..!!
Thanks for Your Love & Support..!
