Crude Oil Brent

Brent: countertrend dealThe decision by OPEC and OPEC + on Monday to keep the plan for a gradual increase in oil production was prompted by fears that demand and prices could weaken.
The group also considered the possibility of increasing production by 800,000 barrels per day, which is almost 1% of global production, ahead of Monday's meeting.
Now the OPEC countries are more cautious, because any hasty decision could lead to a sharp drop in oil prices.
In the medium term, the instrument will be on the rise.
Today is rich in news. Taking into account this fact, as well as the strong upward movement in oil, no one canceled short-term sales for the instrument.
Proposed deal for this tool:
Entry Point - 82.85
Stop Loss - 83.80
Take Profit - 82.08

Crude Oil (WTI): Key Levels to Watch 🛢️
Hey traders,
Contemplating this bullish rally on WTI,
here are the major key level to watch for pullbacks.
77.0 - is the structure resistance that went broken this week.
Now it turned into a support
91.0 is a minor monthly/weekly resistance.
The price may retrace from that.
107.0 - 115.0 is a major monthly resistance cluster.
A strong bearish reaction will be expected from that.
Be prepared for a bullish continuation.
Try to catch it on an occasional pullback.
❤️Please, support this idea with like and comment!❤️

USDCAD: in the trade balanceAnd so, the Canadian is also in anticipation of today's events during the American session. It is expected that the pair may sink at the moment, but it is unlikely to fall below 1.24911 (even more likely it would not reach and go up). The combination of technical and fundamental facts suggests that the instrument would move up in the medium term within the trade balance 1.24911 - 1.28962.
Remember, there is no place for luck in trading - only strategy!
Thanks for the likes and comments.

Brent: dollar would force correctionThe oil is supported by reports that Saudi Arabia lowered its November export oil prices for Asia, the Mediterranean countries, Europe and the United States.
Also, a positive factor for the oil market in recent days was the decision of the OPEC + states to maintain the previously adopted plan to increase oil production, despite the growth in demand amid a sharp rise in the cost of natural gas.
In accordance with this plan, OPEC + countries will increase oil production in November by 400 thousand barrels per day.
Meanwhile, data from the American Petroleum Institute (API) indicated an increase in US oil inventories by 951 thousand barrels for the week ended October 1, while analysts predicted an average rise of 4.127 million barrels.
Further oil situation will directly depend on the dynamics of the US dollar. The oil itself, most likely, needs a correction, and if the dollar is not weak, this is possible.
Proposed deal for this tool:
Entry Point - 82.59 (SELL-Limit)
Stop Loss - 83.45
Take Profit - 81.73

UKOIL facing bearish pressure, drop incoming!UKOIL is approaching the upper resistance of the ascending price channel in line with 1st resistance at 83.09 in line with Horizontal swing high and 78.6% Fibonacci extension. Price is likely to reverse off from 1st resistance at 83.09 in line with Horizontal swing high and 78.6% Fibonacci extension to take 1st support at 78.80 in line with 61.8% Fibonacci retracement and 100% Fibonacci extension level. Our bearish bias is further supported by how RSI is showing a negative bearish divergence. Otherwise price may bullish towards 2nd resistance at 85.04 in line with -27.2% Fibonacci retracement and 127.2% Fibonacci extension.
Trading CFDs on margin carries high risk. Losses can exceed the initial investment so please ensure you fully understand the risks.

Crude Oil Elliott Wave IdeaWorking in the oil & gas industry I've always wanted to plot an Elliott Wave idea with oil reaching $100, one that I felt was realistic and not pie in the sky...in my opinion oil is heading that direction now.
The exact 0.382 retracement level from $44,05 to $33,79 at the end of 2020 leads me to believe that was the end of wave 2 and the next retracement will begin at the 1.618 level around $77 for wave 4, before wave 5 towards $100.
I had a similar idea back when this move from $33 started () that this move could be wave 5 but its flown far beyond those levels and has me thinking this is wave 3 we are in now, and its not quite finished yet.

Crude Oil - experiment !Hy trader !
This Crude Oil weekly chart is a combination of 2 Fib Circles ,Time Cycles, Sine Line and Fib retracement !
No trading advice !
If you like this post smash the like👍 button, comment or follow me.
Thanks for reading my idea,
Trade save!!

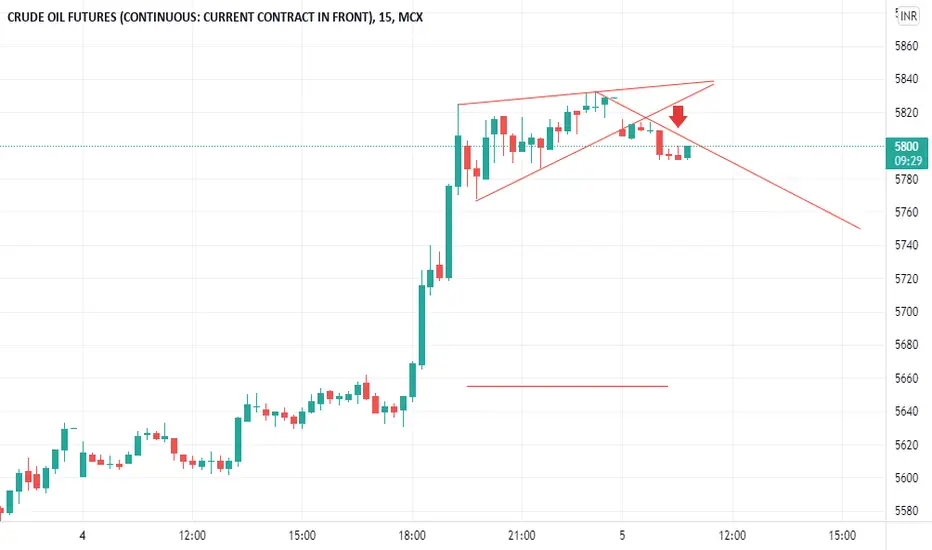
MCX CRUDEOILMarket Over bought .Market Down For at The Level SELL -
5800-5810 .I Think Market Down ..Comment Your Opinion
Crude Oil Elliott Wave Idea - UpdateAn update on these ideas from March 2021:
It appears that wave 4 is complete close to the 0.382 level and the next move could be wave 5 up towards the $90 level.

OIL Intraday. Aiming 1:10 RRRisk 1% and aiming for 10% on this trade. No indicators used. Pure price action. Like to keep my chart clean.
All trades closed on the same day. Entries on 1 min chart
Mostly trade 12-5pm UK time NY session. Sometimes London Session. Don't like the idea of watching charts the whole day.

OIL Intraday. Aiming 1:10 RRRisk 1% and aiming for 10% on this trade. No indicators used. Pure price action. Like to keep my chart clean.
All trades closed on the same day.
Mostly trade 12-5pm UK time NY session. Sometimes London Session. Don't like the idea of watching charts the whole day.

BrentCrudeOil may completing running flat at around 90. 4/10/21Gosh! Jesus! Wallstreet bet 100USD- 200USD on Brent Crude Oil???!!! aka UK Oil might be completing running / expanding flat (A)(B)(C) ( Cyan/Light Blue) pattern soon at around 90..

UKOIL (Brent Crude Oil) : 1Month TFWell, as we can see, we are technically reviewing Brent oil charts at monthly timeframes. The price finally broke its 13-year downtrend last month ... (This break needs to be stabilized) Currently, the most important support range for Brent oil is from $ 72 to $ 76 ... Brent oil currently has a significant static resistance of $ 85 and we have to see if it can break this resistance after 3 years and pave its way to climb or not.
⚠️ This Analysis will be updated ... TVC:UKOIL
👤 Arman Shaban : @Ar_M_An_4
📅 02.Oct.2021
⚠️(DYOR)

USOIL (WTI Crude Oil) : 1Month TFWell, as we see in the monthly time frame of the US Crude Oil Chart, the price in February finally broke its 13-year downward trend ... After that, it continued to grow well and reached its static resistance level in July 2021, and It failed to defeat it and then rebounded to its broken support level in August. Last month, the price reached to the psychologically and Impostant resistance level which is 77$ ... we have to see if the price can finally break this important 3-year resistance in October or what ...
⚠️ This Analysis will be updated ... TVC:USOIL
👤 Arman Shaban : @Ar_M_An_4
📅 02.Oct.2021
⚠️(DYOR)

UKOIL in consolidation The price is in an uptrend and a consolidation is formed after a false pullback just below strong resistance. There is no strong pullback. I think that the price may still rise, so my target at the moment is the resistance of 80.5
Traders, if you like this idea or have your own opinion about it, write in the comments. I will be glad👩💻

UKOIL facing bearish pressure, drop incoming!UKOIL is holding below 1st resistance at 79.28 in line with 61.8 Fibonacci retracement and 38.2% Fibonacci extension and may bearish towards 1st support at 76.10 in line 61.8% Fibonacci retracement and 161.8% Fibonacci extension. Our bearish is further supported by how MACD is showing a bearish signal where the signal line is above the MACD line. Otherwise price may bullish towards 2nd resistance at 80.72 in line with Horizontal swing high and 61.8% Fibonacci extension.
Trading CFDs on margin carries high risk. Losses can exceed the initial investment so please ensure you fully understand the risks.

Education excerpt: OPECThe Organization of the Petroleum Exporting Countries (OPEC)
The Organization of the Petroleum Exporting Countries (OPEC) is a permanent intergovernmental organization with main goal to coordinate and unify the petroleum policies of its member countries. This pertains mainly to securing fair and stable pricing in the oil market; efficient and regular supply of petroleum to consuming nations and fair return on capital to the producing countries.
The OPEC was established in Baghdad, Iraq in 1960 by five countries. Founding countries were: Iraq, Islamic Republic of Iran, Kuwait, Saudi Arabia and Venezuela. One year later the organization was joined by Qatar in 1961. After that Indonesia and Libya followed in 1962. United Arab Emirates joined the cartel in 1967 and Algeria in 1969. Then Nigeria became member of the OPEC in 1971, Ecuador in 1973 and Gabon in 1975. Few decades later, Angola joined the OPEC in 2007, Equatorial Guinea in 2017 and Congo in 2018.
Ecuador suspended its membership in 1962. However, it rejoined the cartel in 2007. But then again in 2009 Ecuador withdrew its membership from OPEC. Similarly, Indonesia suspended its membership in 2009 and rejoined the cartel in 2016 only to leave it again in 2016. Gabon also suspended its membership in 1995. Although, Gabon reactivated its membership in 2016. Qatar was the last country to terminate its membership in 2019.
Current members:
1. Iraq
2. Iran
3. Kuwait
4. Saudi Arabia
5. Venezuela
6. Libya
7. United Arab Emirates
8. Algeria
9. Nigeria
10. Gabon
11. Angola
12. Equatorial Guinea
13. Congo
The OPEC's executive organ is called the Secretariat and it is run by the Secretary General. Secretariat was originally established in 1961. It also functions as headquarters for the organization. In the beginning, OPEC had its headquarters in Geneva, Switzerland for five years. However, OPEC's headquarters were moved to Vienna, Austria in 1965. Executive organ is responsible for implementation of all resolutions passed by the Conference. Secretariat also conducts research and fullfills all decisions made by the Board of Governeros.
The Secretary General is the representative of the OPEC who simultaneously acts as Executive of the Secretariat. The Secretary General is electable role and its term last three years. Although, there is possibility to renew this term once. The Secretary General is assisted by the Office of the Secretary general and several other officers and staff members of the OPEC. The Office of the Secretary general helps the executive chief of the Secretariat to maintain efficient relations with relevant international organizations and governments. Another important organ of the organization is the Legal Office which supervises legal matters of the Secretariat and provides legal advice to the Secretary General. In addition to that, there is also the Research Division that consists of three departments: Data Services, Energy Studies and Petroleum Studies. The Research Division is responsible for conducting research with regards to the energy and related matters. Infrastructure and services are provided by the Support Services Division.
OPEC Fund
The OPEC Fund for International Development is international finance development institution that was established in 1976. It consists of 12 members: Algeria, Ecuador, Gabon, Indonesia, IR Iran, Iraq, Kuwait, Libya, Nigeria, Saudi Arabia, the United Arab Emirates and Venezuela. Its purpose is to provide financial help to the developing countries and support advancement in these low-income and middle-income countries.
Disclaimer: This content serves solely educational purpose.

CRUDE OIL (WTI) Video Analysis & Technical Outlook 🛢
Top-down analysis on WTI.
Key leves, price action.
Trading recommendations & thoughts.
❤️Please, support this idea with like and comment!❤️

DeGRAM | BRENT in consolidation oil after a false breakout does not roll back deeply.
Consolidation is forming between 79.42 and 77.92. I think that at the end of the consolidation, the price can break through the resistance and rise to 80.48
-------------------
Share your opinion in the comments and support the idea with Like.
Thanks for your support!

UKOIL at very important level.Brent Crude at a very crucial juncture. If crossed the monthly trend line by end of September 2021 decisively, the next bull run will start with a target to the previous high. It will face resistance at blue zone crossing which will be unstoppable. But this will be the last bull run of Crude. It will crash down to an all-time low and by (or before) 2030.
It is also near 50% FIB level which can act as a resistance.

CRUDE OIL (WTI) Year's High Ahead! Important Update 🛢
Hey traders,
WTI Oil is approaching a key weekly/daily structure resistance.
76.8 - 77.2 is our potential reversal zone.
Being heavily overbought, we may catch a pullback from that.
Our confirmation will be a bearish breakout of a rising channel on 4h.
In case of a 4H candle close below its support, a bearish continuation will be expected.
Goals will be: 74.0/73.0
Alternatively, in case of a daily candle close above the underlined zone, a bullish continuation will be expected.
❤️Please, support this idea with like and comment!❤️

UKOil Dip Looks Compelling on HourlyFurther to yesterday's article, , UKOil has pulled back on the hourly. The left daily chart continues to show UKOil in the bullish area (upper blue - upper red). The hourly stochastic on the right has already crossed bullishly. If the EMAs cross to the upside that would be considered a bullish development. Assuming this, if the stochastic can move to 80 and hold that level a bullish momentum push may be back on.
