USO: Springy 👟👟USO seems to have put on its extra springy sneakers as it has jumped up into the green zone between $83.54 and $87.83 quite briskly after pressing against it for some time. Now, it should finish wave B in green in this region and subsequently turn around to move downwards. On its way, USO should then drop back below $82.48 and also fall below the support lines at $67.68 and $62.92 to reach the yellow zone between $60.18 and $43.48, where wave (2) in yellow should end.
Usoilidea

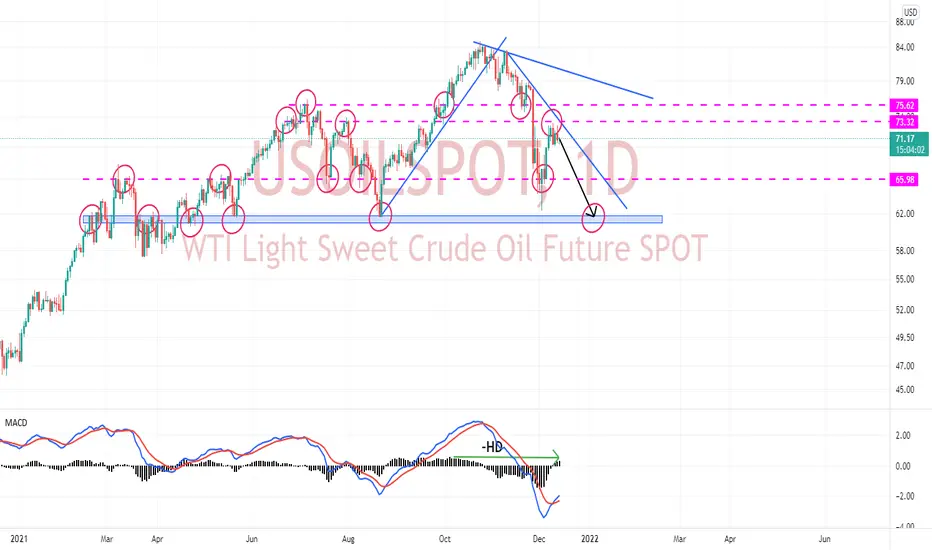
USOIL seems BearishI have high lite the resistance zone which I think is best to sell the crude oil.

US Oil (WTI Crude Oil) Analysis and trade IdeaOil has broken structure to the downside, and a return to the originating impulse was expected... and now fulfilled. What now? This video explains identifies the most likely scenarios... and the higher probability movement.
I believe price is indicating further declines, for a shallow pullback on the HTFs.

USOIL seems BullishAs per the MACD indicator, it is showing bullish momentum to me. D1 candle is also in Bullish. So I believe it may give us handsome profit. Follow the trend line of your stop loss and take profit.

USOIL Very Near Strong Res , Short Setup With 4H Bearish P.A This is an educational + analytic content that will teach why and how to enter a trade
Make sure you watch the price action closely in each analysis as this is a very important part of our method
Disclaimer : this analysis can change at anytime without notice and it is only for the purpose of assisting traders to make independent investments decisions

USOIL - LONGUSOIL is looking like it may move higher.
We have found a bottom (point 5 green) and a nice reversal higher.
We have made it above point 4 - creating new high and we should take nice profits now.
Now we expect a reversal to the breakout - blue line.
If it gets there we'll examine the price action to see if we can go long again and continue the swing higher.

USO: StairwalkerUSO has planned a tough workout on the stairwalker. After finishing wave iii in turquoise in the upper turquoise zone between $76.92 and $75.60, it should move upwards to complete wave iv in turquoise. Then, USO should drop into the lower turquoise zone between $73.45 and $72.12 to end waves v in turquoise and 1 in green. Following another countermovement into the green zone between $77.71 and $81.57, where wave 2 in green should end, USO should fall below the support at $67.68 and the one at $62.92. There, it should enter the yellow zone between $60.18 and $43.48 to finish waves 3 in green, c in orange and (2) in yellow.

USOIL seems BullishUSOIL is increased last week as US increased it's interest rate. I believe that USOIL will continue grow to 116.20. Furthermore USOIL is obeying it's trend line and taking support on it.


USOILtwo possible way
I. retest and then go up ,short term target is previous high
.
II. go up and gone
.
.
This is Not Financial Advice
.
🧅JUST AN OPINION OF THE ONION.🧅

🧅USOILwe are reached bearish OB
.
it's a good opportunity to open short position
.
target will be those OB
.
This is Not Financial Advice
.
🧅JUST AN OPINION OF THE ONION.🧅

Oil Repeting Pathern?We know how istitutions and people in general are moved by emotions, and chart partherns most of the time
will USOIL behave in the same way?
There are few events in the Economic Calendar for the next week previewing a rally on the dollar, which may cause Oil prices to plunge a bit

USO: Island Hopping 🏝 Summer is approaching slowly but surely, and some might start to arrange their next holiday. Meanwhile, USO is already heading south and has a bit of island hopping planned. The first stop should be in the green zone between $68.62 and $66.43, where USO should finish wave 3 in green – and maybe drink a cocktail or two. Then, it should draw some breath in a short countermovement to complete wave 4 in green. Afterwards, the next green island between $62.86 and $60.67 is waiting, where USO should conclude wave 5 in green, wave c in orange and wave in magenta. Following another countermovement in wave in magenta, USO should finally reach the warm beach strip between $60.18 and $43.48 to finish wave in magenta and wave (2) in yellow and to catch some rays.

USOIL - Short Ideahello guys , short term at least Short opportunity I am seeing in USOIL , be careful with your risk / money management before getting into trade
this is not any financial advice, trade at your own risk

USOIL top-down analysisHello traders, this is the full breakdown of this pair. We will take this trade if all the conditions are satisfied as discussed in the analysis. Smash the like button if you find value in this analysis and drop a comment if you have any questions or let me know which pair to cover in my next analysis.

USOIL top-down analysisHello traders, this is the full breakdown of this pair. We will take this trade if all the conditions are satisfied as discussed in the analysis. Smash the like button if you find value in this analysis and drop a comment if you have any questions or let me know which pair to cover in my next analysis.

Oil Possible Top?We've been tracking a count on US Oil and it looks like the intermediate top is in for wave 1, if that's the case we can set up for a nice short trade for the wave 2 coming down to the 75-80 dollars range. If you do want to make this trade we'd suggest putting your stop at 92 dollars with a take profit at 80 giving a very healthy 1:5 risk to reward opportunity.

USOIL hit blue channel Oil received a reaction from the blue channel, if it does not break the channel, the first target is 92.86 and then 93.82 is expected.
I'm using Fibonacci circle , Fibonacci levels , Fibonacci channel to create this analysis
❤️👍🏻 Please support me with LIKE / COMMENT ❤️👍🏻
DISCLAIMER: This post does not provide financial advice. It is for educational purposes only! You can use the information from the post to make your own trading plan for the market. But you must do your own research and use it as the priority. Trading is risky, and it is not suitable for everyone. Only you can be responsible for your trading.

Usoil ready to drop are you ready if ready follow meUsoil ready to drop are you ready if ready follow me our ist step strategy when market break the d1 HH then if break in 4 H structure it mean ready to reversal
we expect a bearish move

Crude Oil 4Hr Analysis, Jan 25th NY Session3 Reasons why I believe this commodity will go bearish and create cad weakness.
I think it is possible we can touch 81.60$

USOIL Potential Head and Shoulders FormationUSOIL made a massive move after the pandemic and it's now moving in a range. It's currently trading in the resistance zone. Based on previous price action, it seems like it will complete this Head and Shoulders pattern over the next few weeks.
But it's quite possible that it will continue its move upward after completing this pattern because there are fewer chances of a breakdown. This analysis will be considered wrong if it touched 78.30 level before completing the pattern.
Thanks!
Best Regards,
Trade Like Pros.

USOIL SELL TRADE IDEAHello everyone, if you like the idea, do not forget to support with a like and follow.
We do have a W pattern formation on the Weekly. We can expect a rejection to the downside, and we still didnt see the retracement to the 0.382 so a deeper correction does seem possible
On the daily, we can see an ICI strategy and is currently testing previous daily support which it has tested 2 times and now currently testing as resistance which if we see a candle closure below this support. Taking the fibonacci on this daily impulse we can see that the market has retraced back to the 0.618 golden ration taken on this daily impulse.
On the 4H time frame, we can see the area is acting as support, while MACD is below 0 but EMA's have just slightly cut for long, so if the market manages to cut below this support, EMA's will cut for short, so the break and shift of the environment, on the retest and when EMA's line up with structure. Stop loss is above the high or above the 0.786 of the fibo on the impulse and take profit on the fibo on the daily retracement.
Trade Signals
SELL
Entry: 81.04
Take Profit: 77.11
Stop Loss: 82.33
Good luck!
All Strategies Are Good; If Managed Properly!
~FX_SHIFTER

US Oil (WTI Crude Oil) Analysis and trade Idea...UpdatePrice has invalidated the right shoulder OB I highlighted in the previous video. It has reacted off of the "head" OB, forming a double top, formed an engulfer, and is now retesting the base candle.
This may lead to the bearish PA I was hoping for.
