USOIL - OUTLOOK 12USOIL - OUTLOOK 12
Hello traders and happy Sunday, let's no waste time and jump straight into it.
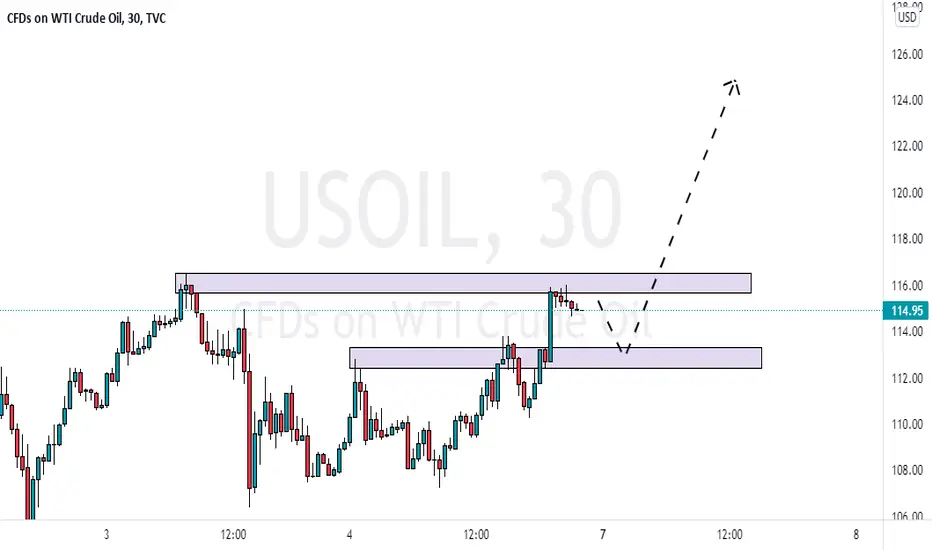
From the last outlook USOIL declined as we expected it to, we caught two nice trades but GBPJPY and NASDAQ came back to bite us and but us straight to bed. USOIL is now stuck $99.73 and $106.41, we must break from here to get a directional bias. We are still very bullish and have broken a descending wedge but it's critical we come back above $106.41 to move higher. Above this region and $114 and recent highs will be the target. Any new tensions or negative news for the war will only drive price up again and once ATH breaks it will be a clear run to $185 which is my cycle target.
If USOIL doesn't break 106.41 but instead falls below $99.73 we will see a quick sell off to $91.27 and even $88. It's all to play for in USOIL and right now I am neutral until either zone breaks with confirmation. It is best to stick to the 4hr timeframe for further and greater confirmation on USOIL to avoid fake outs. The candle closures will play the most important role.
We have rebranded; come find out why using the link below.
Usoillong

Inside Bar Candlestick Pattern📉📉📉We will cover the following today:
Inside Bar (Inside Day)
Inside Days
✅ Inside Days are a daily pattern involving two daily candles, we have a day of trade, also known as the ‘mother candle’ and then the following day trades the whole day within the range of the previous day. This is a two-day bias suggesting a potential reversal. A great way to play these sorts of biases is to pre-empt the failure of this reversal, as well as playing the success of the inside day, so what does this look like? Let’s take a look at an example below.
✅ What is an inside bar?
The inside bar is a popular reversal/continuation candle formation that only requires two candles to present itself. This pattern is a direct play on short-term market sentiment looking to enter before the 'big moves' that may take place in the market.
✅ Is an inside bar bullish?
First, unlike other candlestick patterns, inside bars are usually not distinguished as bullish and bearish by their look or color of the body itself, but rather by the location they are at and other peripheral developments
✅ An “inside bar” pattern is a two-bar price action trading strategy in which the inside bar is smaller and within the high to low range of the prior bar, i.e. the high is lower than the previous bar's high, and the low is higher than the previous bar's low.
📈 HOW TO IDENTIFY AN INSIDE BAR ON FOREX CHARTS
The following steps are used when identifying the inside bar pattern on forex charts:
Identify a preceding trend using price action/technical indicators
Locate inside bar pattern whereby the inside bar is engulfed fully by the preceding candle high and low

OIL daily trade This is not financial advice. This is for only my private trade plan. If you have follow at your own risk.

CRUDE OIL – Futures: Buying A PullbackCRUDE OIL – Futures: Buying After A Pullback To Support Area
Price Action: There is no new price action signal to note at this time.
The recent Bearish Inside Bar Pattern + Pin Bar (Combo Setup), didn’t trigger (We did not consider trading this setup, nor did we mention it).
Potential Trade Idea: We are still considering buying on a retracement lower and after a price action buy signal, within the $88.81 – $95.84 short-term support area.

USOIL - Long Opportunityhere my analysis on USOIL , we are looking for LONG on the retest of the given level.

USOIL LONGS ACTIVE 📉📉📉📈 Expecting bullish price action on USOIL, as we are in a HTF bullish market strucutre, price fills all the bullish imbalances on D1 and H4, we have a h4/d1 bullish orderblock rejection + institutional figure 100$ for USOIL which is very important, we have also a lot of bearish imbalances that should be filled somewhere around 120 as price was very inefficent in that area, that area works as a magnet for the price. Fundamental Context on this asset is likely bullish, i will also attach market seasonality chart so you will understand that we are in a bullish cycle.
What do you think ? Comment below..

USOIL LONG ZONEFor More Daily Detailed analysis, go ahead and Click the Follow Button.
Here we have our US OIL chart..
On recent Market sentiment crushing fears of demand we have seen a rapid fall in the price of oil. This fall comes after sellers rushed in the market to sell it down..
This now allows buyers to swiftly enter at the current KEY technical level. We can look long until we reach some early resistance. We can further continue by scaling in and out of the market as it rises.
Use arrows/eclipse symbol for price guidance.

USOIL LONGS 📉📉📉📉 Expecting bullish price action on USOIL as price takes out weekly low liquidity, a lot of bearish imbalances are left somewhere around 120-115 price area price should rise to fill them ASAP. As market is imbalanced
USOIL is in a huge bullish market strucutre area on a HTF.
What do you think ? Comment below..

USOIL - OUTLOOK 11USOIL - OUTLOOK 11
It has been a very very slow week for us, only 138 pips profit booked and a 50% accuracy for our trades (4 taken in total). If you are struggling to trade these conditions it is through no fault of your own. Due to the impulsive moves the charts have no structure and we are fundamental led. No matter what analysis you apply it can be undone in seconds with one statement from Putin etc!
WTI closed bearish as expected and we should see further downside from here unless fundamentals drive it up during the weekend. WTI will be looking for it's next lower high which I think will be confirmed around 94.50. I expect further dips lower to fill the gap and these would be prime buy opportunities.
The current economic climate is just the beginning and I still have $185 a barrel clear in my sights.
There is not much more to comment as price from here becomes very choppy.
Make sure you use the link below to keep up with us!

USOIL - WEEK 10Traders I come to you midweek with outlook 10 for good reason.
I told members I would let the market move about at the start of the week due to the large bullish gap and impulsive moves. All FUNDAMENTLS have been called correctly and the most recent one which was the banning of Russian energy exportation, I wonder where this was written over a week before hand.
Next on my hitlist for fundamentals are:
Dollar targeted
New ATH
Deep world recession
Everything we predicted from a fundamental aspect has been seen and you can tell it's no coincidence!
Today I mapped out a bearish scenario for WTI which is coming through perfectly so far and now that we are seeing some real pullbacks we can start returning to technicals for guidance. WTI should pull back deeper and my eyes are locked in at $99.50 - $98.22 but I also can't shake the gap fill around $92.00. There is nothing to stop USOIL hitting the $92.00 as this would provide a huge buy region, a technical gap fill and as long as it didn't close below it would be a new higher low. Price isn't bearish as a new higher high was made before the drop off.
Your brokers, guru's and FX news places are all writing about how USOIL is sinking from 14-16 year highs and it's reversal time. 100% Incorrect, for USOIL to hit new ATH serious momentum is needed and large pullbacks would provide this. USOIL dropped due to inventory reports and this has been to prefect excuse to take profit on longs and get ready for the next set. Believe me when I say this $185 will be seen should no changes come from eastern Europe.
All this momentum has been driven by the war in Europe so why should some reports have should a huge effect. I said repeatedly price will be sensitive to any news due to no technical data being respected. With the ban on Russia energy export it is going to leave WTI as the monopoly.
This drop is an abnormality and we will take advantage!
Only one way to found out how and that is using the link below!

USOIL free signalI recommend buy USOIL we still up ...we have a great confiramtion in the chart + indicators

USOIL BuyWe had a bullish break again. OB is marked in a grey box. Look for a buy from there.
NOTE: I always wait for a candle close below the grey box for setup to invalidate. So either set sl with some margin or manually monitor the price on 15m chart.

USOIL 128.00 6.36 % LONG IDEA * CONT. PTTNS & PRICE ACTIONHELLO EVERYONE
HOPE EVERYONE IS DOING GOOD HAVING A GOOD ONE.
LOOKING AT THE USOIL
* The ENERGY is currently trading in an uptrend , just consolidated and rejecting at the base of this structure, fundametals went in and saw the ENERGY sour to $132 highs.
- Short term the pair is currently at the supply zone could go lower but looking for possible continuation with the bulls with evrything happening fundametally wouldnt be surprised to see a challenge of the 2008 high of $ 145.85 in the near future but well we are not there yet.
- The energy saw a break and close above a structure possibly signaling that we could see some continuation with the bulls.
- Looking for LONG entries on the THE CRUDE swing should all the rules of the formation be met but we might see some correction before this comes to play.
******* CRUDE OIL INVENTORIES TOMMORROW will definitely be interesting, the increase in the oil is actually MORE than expected @ -2.597 M which implies weaker demand and the energy could react BEARISH which support the idea of a correction and delay before continuation.
So lets see how it goes
IF THIS IDEA ASSISTS IN ANY OR IF YOU LIKE THIS ONE
SMASH THAT LIKE BUTTON & LEAVE A COMMENT.
ALWAYS APPRECIATED
____________________________________________________________________________________________________________________
* Kindly follow your entry rules on entries & stops. |* Some of The idea's may be predictive yet are not financial advice or signals. | *Trading plans can change at anytime reactive to the market. | * Many stars must align with the plan before executing the trade, kindly follow your rules & RISK MANAGEMENT.
_____________________________________________________________________________________________________________________
| * ENTRY & SL -KINDLY FOLLOW YOUR RULES | * RISK-MANAGEMENT | *PERIOD - SWING TRADE

usoil RESULT hit our Target ✅ALHAMDULILAH ✅ Congratulations to all +1000 PIPS ... was interesting trade ..see you in VIP room

Mar 8, 22 Crude Oil TP Hit-Nice ProfitsYesterday I posted my Buy Order at 123 and price action just hit my Take Profit at 128 as Biden just announced he will probably sanction Russian oil later today. This of course spiked prices up huge in less than 10 minutes.
How high will Oil go? Not sure. But I'm out of this market for now. I will keep you updated if there looks like another trade opportunity.
Congrats to traders who followed this call - Enjoy Your Profits!
Stay safe.
Heiko

USOIL signalI recommend buy USOIL at this levels as you can see we have a good confirmation in price acion also in indicators

USOIL PERFECT ANALYSISMy coach/partner once told me, continue the quality work and not do it for views or likes, because Bees do not have to explain themselves with flees that Honey is better than shit... this proves a lot in my life, personally as a trader and as a stoic, my life have been Up and Down like the price action, but i am still heading in an up trend direction as my life pattern is forming higher highs and higher lows.. lol.
Usoil for the third year is a win, i am grateful to Team PFX

USOIL (LONG) 🔥🔥🔥Fundamental and technical analysis works best together. With the current war in Ukraine and Russia USOIL has been on a bullish trend. we also see higher lows crashing into a resistance which signals a bullish signal.
Risk Disclaimer:
Please be advised that I am not telling anyone how to spend or invest their money. Take all of my analysis as my own opinion, as entertainment, and at your own risk. I assume no responsibility or liability for any errors or omissions in the content of this page, and they are for educational purposes only. Any action you take on the information in this analysis is strictly at your own risk. There is a very high degree of risk involved in trading. Past results are not indicative of future returns. Good luck
📊 What is Market Seasonality ? 🎯 Seasonality refers to particular time frames when stocks/sectors/indices are subjected to and influenced by recurring tendencies that produce patterns that are apparent in the investment valuation.
🎯 Seasonality is a characteristic of a time series in which the data experiences regular and predictable changes that recur every calendar year. Any predictable fluctuation or pattern that recurs or repeats over a one-year period is said to be seasonal.
📊 What is a Seasonality Forecast?
In time series data, seasonality refers to the presence of variations which occur at certain regular intervals either on a weekly basis, monthly basis, or even quarterly (but never up to a year). Various factors may cause seasonality - like a vacation, weather, and holidays
-
✅ You can use the Market Seasonality as an extra fundamental confluence for the price, we have 2 market seasonalities bullish and bearish. If a price has bullish seasonality it means the pariticular asset will tend to rise during that cycle and viceversa. Market Seasonality (MS) is a good tool to have in your arsenal but only if you are trading on a mid-long term perspective. You can't trade using the market seasonality on a scalping or a intra-day basis because it makes no sense.
Was this a valuable information ?

CORN SHORTS 📉📉📉The same view on CORN as on WHEAT chart, we have a nice bullish market strucutre but looks like price is very exhausted and right now we should see a corrective movement down ito 700/600, we have a lot of bullish gaps on it's way and price should retrace to fill those.
On a long-term perspective i am still bullish based on the fundamental context.
What do you think ? ..

Trade Defensively 🔰🔰🔰 🔰 Trading Defensively
• Proper Lot Size
Stop changing the lot size on each trade you take based on the ,, confluences,, your risk should be pre-determined and fixed.
Example you risk only 0.50% from your account on each trade
• Take Profits before News Release
Number one goal is to protect your equity, news can bring high volatility into the markets and random big moves. It is better to fix your profit or move your stoploss to breakeven before important news release
• Use Trailing Stops
Secure the profits and let your winners run, you can apply this strategy when you are already in profit and want to squeeze more from the trade
• Multiple Take Profits
Remember that a win is still a WIN, you dont need big profits to be profitable in the market. You need small consistent wins and over time you will see the difference
Was this information valuable ?

USOIL LONGS 📉📉📉📉 Expecting bullish price action on USOIL as we are in a huge bullish market strucutre from a technical perspective, look to ONLY LONG this asset. I will try to LONG it from D1 Imbalance area or 100$ institutional figure. From a fundamental perspective we are STRONG BULLISH during Ukraine - Russia conflict + market seasonality that is strongly bullish on OIL
I will switch my bias only if price will close below 90$
What do you think ? Comment below..

USOIL FREE SIGNALI recommend buy USOIL at this levels ....with all this confirmation in price acion+ indicators
