Gold Extends Its 8-Week Winning Streak👋Hello everyone, what are your thoughts on OANDA:XAUUSD ?
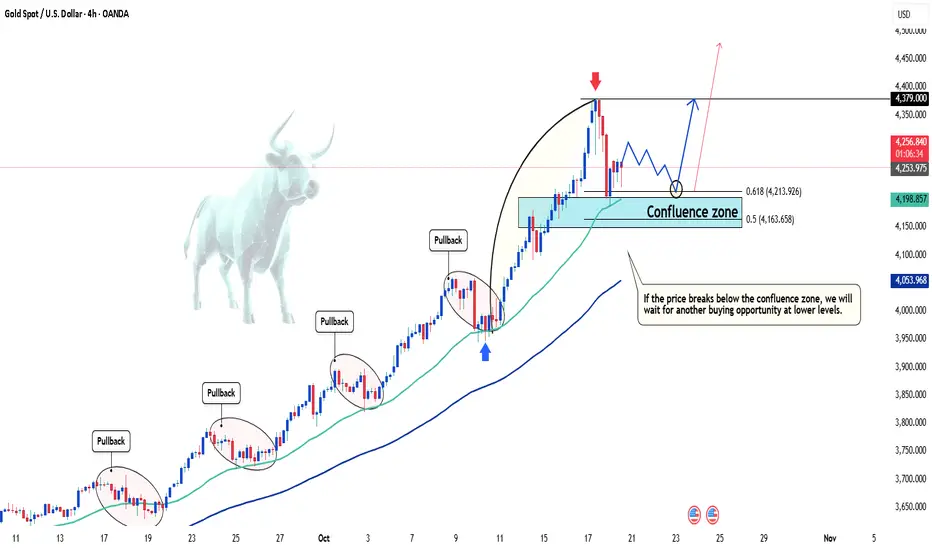
Over the past week, gold prices climbed close to the $4,400 mark before pulling back sharply and closing the week around $4,250, up $223 from the weekly open of $4,022 — nearly a 6% gain, marking the eighth consecutive week of growth. Despite the volatility, Main Street investors remain confident that the precious metal will continue to rise this week.
Trade tensions and geopolitical uncertainties have been the key drivers supporting gold’s rally. Meanwhile, the Fed’s rate cut and the U.S. government shutdown have strengthened the dollar while simultaneously providing support for gold prices.
At the time of writing, gold is fluctuating around $4,255, showing little change since the start of the session. Overall, the bullish trend remains intact, and as long as the confluence zone holds, buying opportunities are still favored.
What about you — what’s your outlook on XAUUSD? 💬Share your thoughts in the comments below, and let’s discuss!
Good luck!
Wave Analysis
Inverse Head & Shoulders on Bitcoin – Breakout or Bull Trap?Right now, Bitcoin ( BINANCE:BTCUSDT ) is moving within its Heavy Support zone($111,980-$105,820) .
Over the past couple of days, it tried twice to break this area but couldn’t. One big reason is that recently, there was news that Japan is considering allowing banks to invest in crypto . Also, yesterday, Trump confirmed he’ll meet with China’s president on October 31st , which the market took as a positive sign that US-China tensions might ease. Previously, the market dropped on news of potential tariffs, and now it’s reacting to the possible easing of those tensions.
In the last 24-48 hours , Bitcoin has formed an inverse head and shoulders pattern , which could signal a short-term bullish reversal. However, there are still important resistance levels and cumulative short liquidation areas overhead. We need to see if Bitcoin can break through those.
From an Elliott Wave perspective, Bitcoin still seems to be in a corrective structure, and until it gets above around $116,000 , there’s still a risk of further downside. So we shouldn’t get too excited about the recent 48-hour bounce.
In short, I expect Bitcoin might push up to those Resistance lines , the Resistance zone($114,300-$113,000) , and Cumulative Short Liquidation($115,241-$113,454) , thanks to the inverse head and shoulders, but it could face resistance there and possibly drop again.
Note: It seems that we may see an increase in Bitcoin with the opening of the US market, but because the SPX500 index( SP:SPX ) is in a correction situation, we can expect Bitcoin to fall again.
Note: Crypto market conditions depend on many parameters these days, and be sure to observe capital management.
New CME Gap: $107,690-$107,220
Cumulative Long Liquidation: $107,000-$105,782
Cumulative Short Liquidation: $112,241-$111,398
Please respect each other's ideas and express them politely if you agree or disagree.
Bitcoin Analysis (BTCUSDT), 1-hour time frame.
Be sure to follow the updated ideas.
Do not forget to put a Stop loss for your positions (For every position you want to open).
Please follow your strategy and updates; this is just my Idea, and I will gladly see your ideas in this post.
Please do not forget the ✅' like '✅ button 🙏😊 & Share it with your friends; thanks, and Trade safe.

Gold 1H – Bullish Rebound After Strong Correction🟡 XAUUSD – Intraday Trading Plan | by Ryan_TitanTrader
📈 Market Context
Gold is attempting to rebound near $4,320 after a sharp correction earlier this week, as traders weigh the recent pullback in U.S. Treasury yields and renewed expectations of a dovish Federal Reserve tone.
Markets are now positioning ahead of key U.S. housing and manufacturing data, which could shape short-term sentiment for both the dollar and real yields.
• Softer economic numbers may reinforce the case for policy easing in early 2026, supporting gold’s safe-haven appeal.
• Conversely, stronger data could momentarily pressure XAUUSD, yet the broader uptrend remains intact amid central-bank accumulation and geopolitical tension.
Expect a liquidity-driven environment, with price potentially sweeping lower before reclaiming bullish momentum.
🔎 Technical Analysis (1H / SMC Style)
• Structure: Overall bias remains bullish following consecutive Breaks of Structure (BOS) and a confirmed Change of Character (ChoCH) indicating corrective retracement.
• Discount Zone: The $4,270–$4,272 demand area sits within the discount zone of the recent range (swing low to 4454 high), ideal for re-accumulation.
• Liquidity Sweep: Recent wicks near $4,300 suggest liquidity has been collected, potentially setting up for another bullish push.
• Premium Zone: Upside liquidity clusters near $4,454–$4,452, aligning with a premium supply area where short-term selling may appear.
🔴 Sell Setup
• Entry: 4454 – 4452
• Stop-Loss: 4463
• Take-Profit Targets: 4400 → 4330
🟢 Buy Setup
• Entry: 4270 – 4272
• Stop-Loss: 4260
• Take-Profit Targets: 4340 → 4380 → 4450 +
⚠️ Risk Management Notes
• Wait for M15 BOS/ChoCH confirmation before triggering entries.
• Avoid entries during high-volatility windows around U.S. data releases.
• Secure partial profits near intermediate liquidity zones, trail stops after BOS confirmation.
✅ Summary
Gold maintains a bullish re-accumulation structure following a healthy correction.
A retest into the discount zone around $4,270 offers potential long entries targeting the premium zone near $4,450+.
Only a decisive break below $4,260 would invalidate the intraday bullish scenario.
FOLLOW RYAN_TITANTRADER for more SMC trading insights ⚡

BTC's Make or Break Zone: Will $101K Hold?Bitcoin continues to respect the short-term downtrend structure, with price now testing the mini trendline resistance, a zone that has aligned perfectly with the “President Trump Tweet Resistance” a region that historically triggered notable market corrections.
Despite the selling pressure from this resistance, BTC remains supported by its underlying bullish structure. The Immediate Area of Interest still provides short-term stability, but all eyes are now on the Critical Support Zone between $101,000 and $98,000.
This zone is extremely vital for the ongoing bull structure. If price makes a surprise visit into this range, it could offer one of the best re-accumulation opportunities before the next impulsive leg higher.
However, a decisive break below $98K would signal a potential end to the current bullish phase a development that could shift momentum sharply against buyers.
Technical View:
• Resistance Levels: $111,753 – $116,000 (Trump Tweet Resistance)
• Critical Support: $101,000 – $98,000 (Key Re-Accumulation Zone)
• Upside Targets: $127,857 → $132,165 (if breakout confirmed)
As we’ve seen in past market cycles including the 2020–2021 rally Bitcoin often revisits dynamic support zones before launching the next leg of its super-cycle move. As long as BTC trades above the Critical Zone, the macro trend remains bullish.
Risk management is crucial here plan entries carefully and let structure dictate reaction.
Today let’s look into MEME coins family, drop your meme coin on the comment area for quick market analysis.
Like, share and comment your view do you believe BTC will hold the $101K zone or break below?

EURUSD 1H Analysis: Bearish Pressure Builds📊 EURUSD – 1 Hour Analysis
Hello Guys,
Here’s my EURUSD analysis for you.
On the 1-hour chart, bears seem to have taken control, as selling pressure is clearly dominating the picture.
If EURUSD falls below 1.16446 and closes a candle there, my first target will be 1.16106.
🙏 Every like is my biggest motivation to keep sharing these analyses. Thanks to everyone supporting me!

Gold Bull Market Outlook And Targets: 5000 USD/7500 USDGold Bull Markets Long Term Overview and 2025 Market Update
________________________________________
🌊 Five-Wave Roadmap — Targets & Timing
• Wave 1 (2016–2020): From ~$1,050–1,200 to the COVID-era spike; established secular up-trend.
• Wave 2 (2020–2022): Consolidation/corrective pullback (~–20%).
• Wave 3 (2023–2025/26): Power leg to ATHs (current). Room to extend toward $4,200–$4,500 on flow surges before pausing.
• Wave 4 (2026, base case): Re-accumulation/consolidation ~12 months; likely range-bound –10% to –15% from the Wave-3 peak as institutional buying digests gains.
• Wave 5 (2027–2030/32): Final thrust to the cycle’s terminal zone:
– First objective: $5,000–$5,500 (consistent with 2026 Street “bull wave” scenarios).
– Terminal extension: $7,500–$8,000 by 2030–2032 (our desk’s stretch path if real yields stay muted, official-sector demand persists, and private capital rotation broadens).
Why Wave-4 can last ~12 months: prior secular bulls often paused for a full year near major breakouts while flows “change hands.” Expect lower realized vol, fading retail FOMO, and steady official accumulation to define the tape.
📈 Top 10 Stats of the Current Bull 2025
1. Price & ATHs: Spot ~$3.75–$3.79k; fresh ATH $3,790.82 on Sep 23, 2025.
2. 2025 YTD: Roughly +40–43% YTD
3. Central Banks: 1,045 t added in 2024 (later revised to ~1,086 t as lagged data came in). H1/Q1’25 tracking remained elevated.
4. ETF Flows: Back-to-back strong quarters; Q2’25 total demand 1,249 t, value US$132bn (+45% y/y) with ETFs instrumental.
5. Gold vs Equities: Gold ≈+40% vs S&P 500 ≈+13% total return YTD.
6. Jewelry Demand: Tonnage softened as prices surged; value at records (2024 down y/y; weakness persisted into H1’25).
7. Gold–Silver Ratio: ~85–88 (silver torque improving as it pushes into the mid-$40s).
8. Macro Link: Safe-haven bid + expected policy easing keep real-yield headwinds contained.
9. Technical: Confirmed 13-yr cup-and-handle breakout (Mar ’24) underpinning trend.
10. Street Forecasts: GS baseline $4,000 by mid-’26; bulled-up houses (HSBC/BofA) flag $4.9–$5.0k potential into 2026 if private/ETF rotation persists.
• This cycle is different: record central-bank buying + renewed ETF inflows + lower real rates = powerful tailwind.
• Price: Gold notched fresh ATHs this month (up to $3,790.82). 2025 is shaping up as the strongest year since the late 1970s.
• Relative: Gold is crushing equities YTD (≈+40% vs S&P 500 ≈+13% total return).
• Setup: A 13-year “cup-and-handle” breakout in 2024 kick-started the move.
• Outlook: Street base cases cluster near $4,000 by mid-’26; several houses now publish $4,900–$5,000 stretch targets into 2026 as flows accelerate.
________________________________________
🏆 Historic Gold Bull Markets — Timeline & Stats
1. 1968–1980 “Super Bull”
• Start/End: ~$35 → $850 (Jan 1980)
• Gain: ~2,330%
• Drivers: End of Bretton Woods, oil shocks, double-digit inflation, geopolitical stress.
• Drawdown: ~–45% (1974–1976) before the final blow-off run.
2. 1999–2011/12
• Start/Peak: ~$252 (1999) → ~$1,920 (2011–12)
• Gain: ~650%
• Drivers: Commodities supercycle, EM demand, USD weakness, GFC safe-haven bid.
3. 2016/2018–Present (The “CB-Led” Cycle)
• Start Zone: $1,050–$1,200 → New ATH $3,790 (Sep 2025)
• Gain: ~215–260% (depending on 2016 vs 2018 anchor)
• Drivers: Record central-bank accumulation, sticky inflation/low real rates, geopolitics; 2024 13-yr base breakout.
________________________________________
📊 At-A-Glance Comparison (Updated 2025)
Metric | 1968–80 Super Bull | 1999–2012 | 2016/18–2025 Current
🚀 Total Gain | ~2,330% | ~650% | ~215–260% (so far)
⏲️ Duration | 12 yrs | 13 yrs | 7–9 yrs (ongoing)
💔 Max Drawdown | ~–45% (’74–’76) | ~–30% (’08) | ~–20% (2022)
🏦 Main Buyer | Retail/Europe | Funds/EM | Central Banks
🏛️ Pattern | Secular parabolic | Cyclical ramps | 13-yr base → breakout (’24)
Notes: current-cycle characteristics validated by WGC demand trends & the 2024 technical breakout.
________________________________________
________________________________________
________________________________________
🔄 What Makes This Bull Different 2025 Edition
• 🏦 Central-Bank Dominance — Third consecutive 1k+ tonne year in 2024; 2025 is still tracking strong on a run-rate basis. This “sticky” demand is from price-insensitive reserve managers.
• ⚡ Faster Recoveries — Drawdowns are shallower/shorter vs the 1970s analog, consistent with a structural rather than speculative buyer base.
• 📈 Coexisting With Risk Assets — ATHs with equities positive YTD = macro hedge + diversification bid, not just “panic buying.”
• 📐 Structural Breakout — 13-yr base cleared in 2024; market now in multi-year price discovery.
________________________________________
🎯 Strategy Ideas 2025 & Beyond
• Buy/Hold on Dips: Stagger entries (DCA) into physical (allocated), ETFs (e.g., GLD/IAU), and quality miners/royalties.
• Prefer Physical/Allocated where counterparty risk matters; use ETFs for liquidity and tactical tilts.
Satellite/Leverage
• Silver & GSR Mean-Reversion: With GSR ~85–88, silver historically offers torque in up-legs. Pair with high-quality silver miners.
• Factor Tilt in Miners: Prioritize low AISC, strong balance sheets, reserve growth, rule-of-law jurisdictions; emphasize free-cash-flow yield and disciplined capex.
Risk-Management
• Define max drawdown per sleeve; pre-plan trims near parabolic extensions or if macro invalidates (e.g., real-yield spike).
• Use options overlays (collars on miners; long-dated calls on physical proxies) to shape payoff in Wave-3 late innings and Wave-4 digestion.
________________________________________
🧪 Reality Check: What Could Invalidate the Bull?
• Real yields + USD rip higher (sustained) → compress gold’s opportunity cost.
• Official-sector buying stalls (policy or FX-reserve shifts) → removes the anchor bid.
• Growth re-acceleration + faster-than-expected disinflation → weaker safe-haven + fewer rate cuts.
• Technical break: a persistent move below ~$3,600–3,700 would question Wave-3 extension and pull forward Wave-4.
________________________________________
🧭 Quick Reference Tables
🧾 Summary: Historic vs Current
Feature | 1968–80 | 1999–2012 | 2016/18–2025
Total Gain | ~2,330% | ~650% | ~215–260%
Duration | 12 yrs | 13 yrs | 7–9 yrs (ongoing)
Correction | ~–45% | ~–30% | ~–20% (’22)
Main Buyer | Retail/Europe | Funds/EM | Central Banks
Pattern | Parabolic | Cyclical | Cup & Handle → Secular
🧩 “If-This-Then-That” Playbook
• If real yields fall & CB buying persists → Ride trend / add on consolidations.
• If USD + real yields jump → Trim beta, keep core hedge.
• If GSR stays >80 with silver momentum → Overweight silver sleeve for torque.
________________________________________
🔚 Key Takeaways Updated
• Twin pillars: relentless official-sector demand + 2024 structural breakout.
• Base case: Street ~$3.7–4.0k by mid-’26 with upside to $4.5–5.0k on accelerated private/ETF rotation.
• Roadmap: Extend Wave-3 → Wave-4 re-accumulation (~12 months) → Wave-5 to $5,000–$5,500, then $7,500–$8,000 by 2030–2032 under favorable macro/flow dynamics.
• Operating stance: keep core, add on dips/sideways phases, manage beta and drawdowns proactively.

USDJPY – Yen Weakens as Japan Forms New Coalition👋Hello everyone, what are your thoughts on FX:USDJPY ?
At the start of the new week, USDJPY is showing interesting movements following news that Japan’s ruling Liberal Democratic Party (LDP) and the Japan Innovation Party have agreed to form a coalition government. This development paves the way for Sanae Takaichi to become Japan’s first female Prime Minister, sparking market expectations of increased fiscal spending and a more accommodative monetary policy.
From a market perspective, these expectations tend to weaken the yen, as investors anticipate low interest rates to continue and ample liquidity support from the Bank of Japan.
As a result, USDJPY is likely to maintain its upward momentum, with potential for further gains if the U.S. dollar continues to be supported by higher Treasury yields and solid U.S. economic data.
What about you — do you think USDJPY will keep rising or start to fall? 💬Share your thoughts in the comments below!
Good luck!

USD/JPY 30-Min — Volume Buy & Sell Reversals TriggeredStatus: Active Reversal Protocol
Symbol: USD/JPY
Session: London–New York Overlap (Smart Exit Window)
➕Bias: Bullish & bearish Reversal
➕ Bearish Reversal " 151.850 Zone
➕Bullish Reversal : 150.500
🩸 Volume Surge Confirmed — Institutional buyers active
🩸 Session Aligned — Timing matches liquidity expansion window
🩸 Cluster Shield Formed — Demand imbalance verified
🩸 Delta Shift Positive — Accumulation phase confirmed
🩸 POC Retest Completed — Weak shorts absorbed
🩸 Structure Break Pending — Bullish intention verified
Logic: This is engineered reversal, not prediction.
💯 Objective: Controlled execution with minimal draw

USDJPY Rally Faces Pressure Near 151.250 on Safe-Haven FlowsHey Traders, in the coming week we’re monitoring USDJPY for a selling opportunity around the 151.250 zone.
The pair remains in a broader downtrend, currently in a corrective phase as it approaches this key resistance level.
Meanwhile, DXY is also correcting within its own downtrend, approaching resistance near 98.600, which reinforces the bearish bias on USD pairs.
With US–China tensions escalating, we’re seeing renewed safe-haven demand for JPY, potentially setting the stage for another leg lower in USDJPY.
Trade safe,
Joe

EURUSD – Structure Analysis (4H Chart)EURUSD – Structure Analysis (4H Chart)
On the EURUSD chart you can find a well-defined structure analysis with key support and resistance areas highlighted.
At the moment, the pair is trading near 1.1650, positioned between a support zone at 1.1630 and a resistance zone around 1.1720.
If price holds above 1.1630, we could see a short-term bullish move toward 1.1720, followed by 1.1770–1.1785, and possibly 1.1870, which is the upper resistance zone.
However, if EURUSD fails to stay above 1.1630, a deeper correction may take place. The next support levels are found at 1.1547 and 1.1400.
Overall, the structure shows that EURUSD is currently at a decision point — holding above support favors a bullish continuation, while a break below could open the door for further downside movement.
You may find more details in the chart!
Thank you and Good Luck!
❤️PS: Please support with a like or comment if you find this analysis useful for your trading day❤️

( HANZO Gold Protocol ) Bullish Reversal DetectedStatus: Active Reversal Protocol
Symbol: Gold
Session: London–New York Overlap (Smart Exit Window)
➕Bias: Bullish Reversal
Goal: Controlled with minimal drawdown
Tactical Edge: Reversal Protocol through liquidity engineering
Confidence Level: ★★★★★ (Smart Money Aligned)
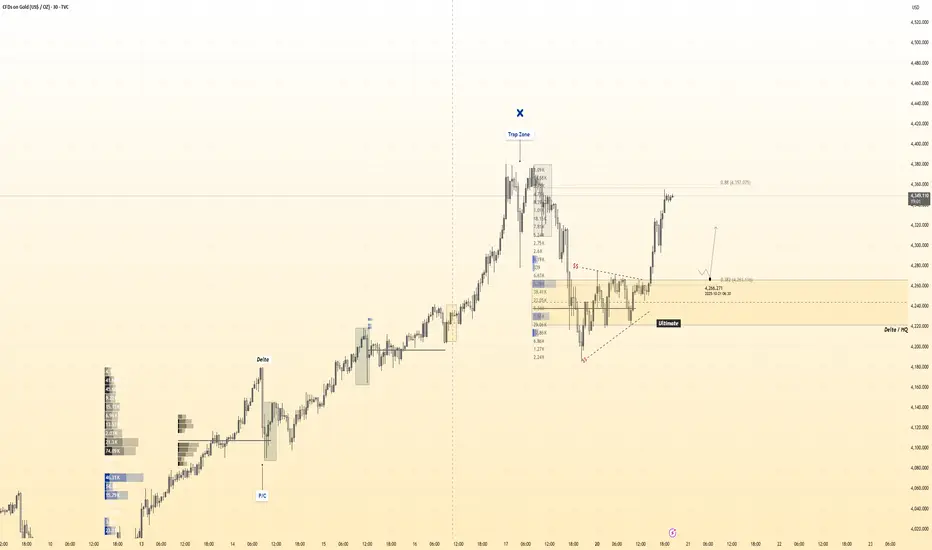
☄️4270 Bullish Reversal Zone — Full Breakdown
1️⃣ Fixed Range HVN Alignment
The 4270 level aligns perfectly with the High Volume Node from the previous accumulation phase — a sign of institutional absorption where orders were heavily exchanged before breakout.
2️⃣ Volume Gap Above, Density Below
Below 4270 we have heavy volume clusters, while above it the profile becomes thin — confirming that 4270 is the last defended zone before liquidity imbalance.
3️⃣ Liquidity Trap Confirmation
The sharp push below 4300 earlier collected stop-loss liquidity, making 4270 the smart money re-entry zone after clearing out retail buyers.
4️⃣ Fibonacci Alignment (0.382–0.5 Zone)
4270 sits inside the 38.2% retracement of the impulsive move, which is a premium re-entry level used by institutional models.
5️⃣ Structural Confluence (Old Resistance → Support)
Previous breakout base and trend compression aligned with 4270 mark it as a flip zone — the structural confirmation of a reversal block.
6️⃣ Delta HQ Reversal Indicator
At the base of the move (near 4270) the Delta HQ showed negative absorption turning neutral, meaning sell volume failed to push price lower — a key reversal trigger.
7️⃣ Session Logic
The level coincides with the post-10:30 session retest window (smart money re-entry timing), fitting your 10:30–10:30 volume cycle.
8️⃣ Trap Zone Above (Liquidity Vacuum)
The upper “Trap Zone” confirms that price already engineered liquidity above, freeing up path for bullish continuation from 4270 upward.
9️⃣ Internal Trendline Compression Break
The descending pattern leading into 4270 forms a bullish breakout wedge — clear compression followed by volume breakout.
🔟 Institutional Behavior Evidence
Sharp imbalance candle after 4270 test shows controlled accumulation — classic smart money re-entry behavior before next expansion.
🎯 Summary (Hanzo Logic)
4270 = Delta Reversal + HVN Defense + Liquidity Reset + Fib Precision
A high-confidence engineered re-entry zone built by smart money to refill positions before bullish continuation.
GOLD → Consolidation. 4269 - trigger. Chances for growth?Gold is consolidating due to uncertainty. On Friday, the market broke its local structure, which slightly changed sentiment. Focus on current consolidation.
Key drivers of the week: Trump's threat to impose 100% tariffs on Chinese imports and China's response supported demand for safe havens. Problems with regional banks (Zions, Western Alliance) and the fall in Treasury bond yields below 4% increased the inflow into gold. Powell maintained a neutral tone, but markets are expecting two rate cuts in 2024.
All eyes are on inflation data, US-China negotiations, developments between Russia, the US, and China; any de-escalation of the situation could trigger a correction.
Technically, the upward trend in gold remains relevant. Corrections will be bought up as long as uncertainty surrounding trade policy, the banking sector, and the Fed's monetary policy persists.
Resistance levels: 4269, 4316
Support levels: 4251, 4218
At the moment, a pre-breakout base is forming around 4269. If the structure remains intact and the price continues to attack resistance, the chances of a breakout and growth will be high. Otherwise, a close below 4251 could trigger a retest of 4218.
Best regards, R. Linda!
ETHUSDT – Bullish Breakout Ahead?👋Hello everyone, do you think BINANCE:ETHUSDT will go up or down?
From a technical perspective, the pair has successfully broken above the descending trendline. This breakout opens up a potential opportunity for a new short-term uptrend. In addition, ETHUSDT is currently reacting to a clearly defined support zone.
If Ethereum continues to hold above this support area, I expect the price could rise toward the next resistance level near $4,300.
From a broader viewpoint, market sentiment is gradually improving as investors regain confidence in risk assets, amid expectations of a softer Fed policy and growing interest in Ethereum’s upcoming network upgrades.
As long as ETH stays above $3,750, the bullish outlook remains valid, and buyers may soon regain control of the market.
What about you — do you agree with this view? 💬Share your thoughts in the comments below. I’d love to hear your opinion!

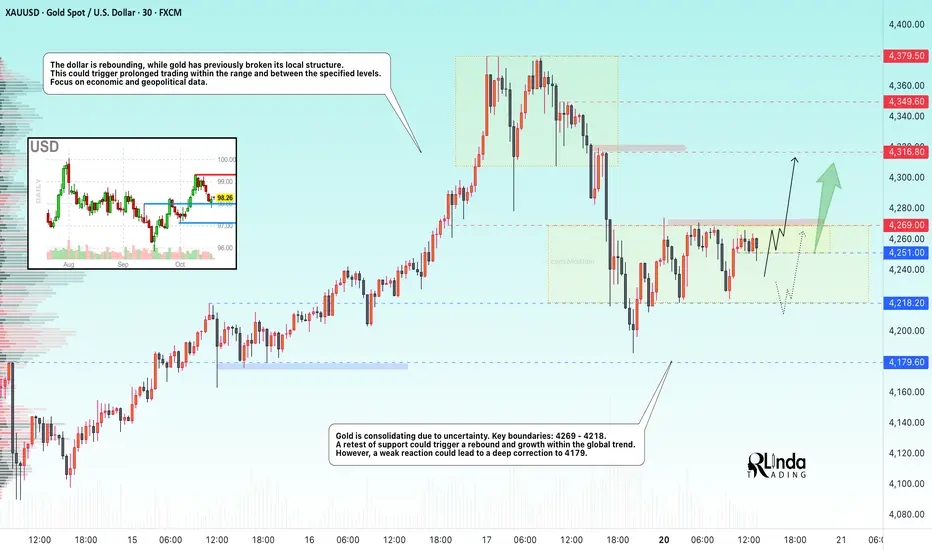
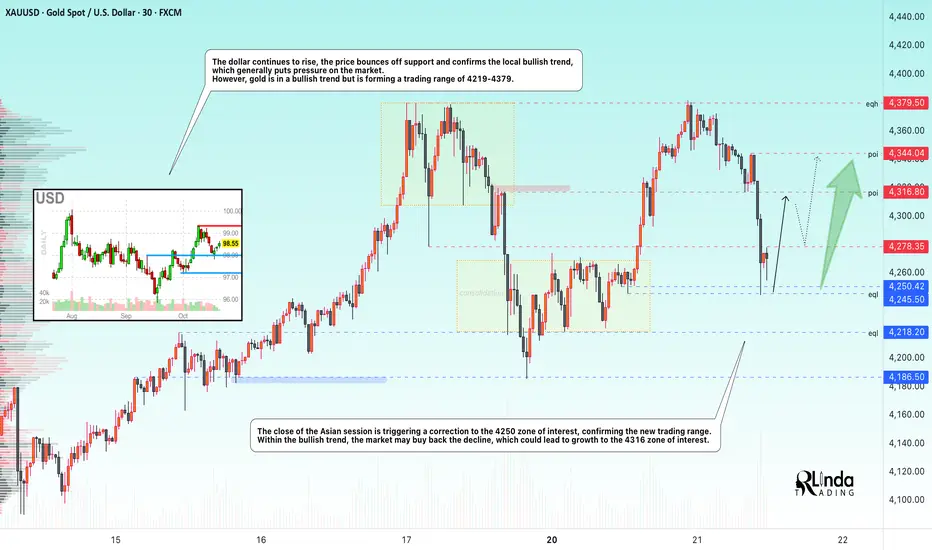
GOLD → The correction forms a trading range. Growth?FX:XAUUSD is adjusting to $4250 after retesting the all-time high of 4380. Short-term pressure is linked to hopes for an easing of the trade war between the US and China, but the bullish trend remains intact.
Key factors: Bentsen's meeting with the Chinese Vice Premier this week has revived optimism for a deal. The reduction in trade risks is temporarily supporting the USD. Hassett's statements about the imminent resumption of government work have reinforced risk-on sentiment.
Support for gold: The threat of tariffs rising to 155% from November 1 reminds us of the risks. Two rate cuts before the end of the year remain in focus. Friday's inflation data release and US corporate earnings reports are keeping demand for hedging alive.
Accordingly, the correction in gold is a temporary pause. The uptrend will remain unchanged as long as macro uncertainty persists.
Support levels: 4250, 4218
Resistance levels: 4278, 4316
Within the bullish trend, the price is forming a trading range. A retest of support could end in a recovery, with the fundamental background favoring the bulls. A retest of 4245 could trigger growth, as could a breakout of 4278 (closing above resistance).
Best regards, R. Linda!
Aster (ASTER/USDT) — Structural Breakout Setup Developing Aster price action has remained technically constructive, continuing to print higher highs and higher lows while backtesting the point of control for confirmation. The structure remains bullish while the $1.15–$1.18 region holds.
Key Technical Points:
Resistance: $1.23 (local breakout level)
Support: $1.15–$1.18 base zone
Bias: Bullish above structure support
The $1.23 resistance is the next key level that needs to break for a continuation move higher. A decisive close above this region would validate the developing trend and trigger further expansion toward upper range liquidity
As long as the local higher-low structure holds, Aster’s short-term trend remains upward, supported by healthy volume and price behavior. Losing the $1.15 base, however, would invalidate the bullish outlook and invite corrective pressure.
Currently, Aster remains one of the more promising technical setups, with $1.23 acting as the breakout confirmation trigger.

Meta - The major triangle rejection!💡Meta ( NASDAQ:META ) will reverse soon:
🔎Analysis summary:
Just a couple of months ago we witnessed a textbook all time high break and retest on Meta. This retest was followed by a major rejection higher and the second retest of the triangle resistance trendline. Therefore, Meta is very likely to create another rejection.
📝Levels to watch:
$750 and $500
SwingTraderPhil
SwingTrading.Simplified. | Investing.Simplified. | #LONGTERMVISION

BNB Holds Strong Support — Potential Rebound AheadBNB Holds Strong Support — Potential Rebound Ahead
BNB is currently trading near a strong support zone around 1,065–1,080, which has been tested multiple times in the past. This area has proven to be a key level where buyers tend to step in.
As long as the price remains above this support, a bullish rebound is likely. The first resistance to watch is around 1,140, followed by 1,190 and 1,240 as higher upside targets.
If the support at 1,065 breaks decisively, however, it could signal further downside pressure. But for now, the structure suggests a potential short-term recovery from the current levels.
You may find more details in the chart!
Thank you and Good Luck!
❤️PS: Please support with a like or comment if you find this analysis useful for your trading day❤️

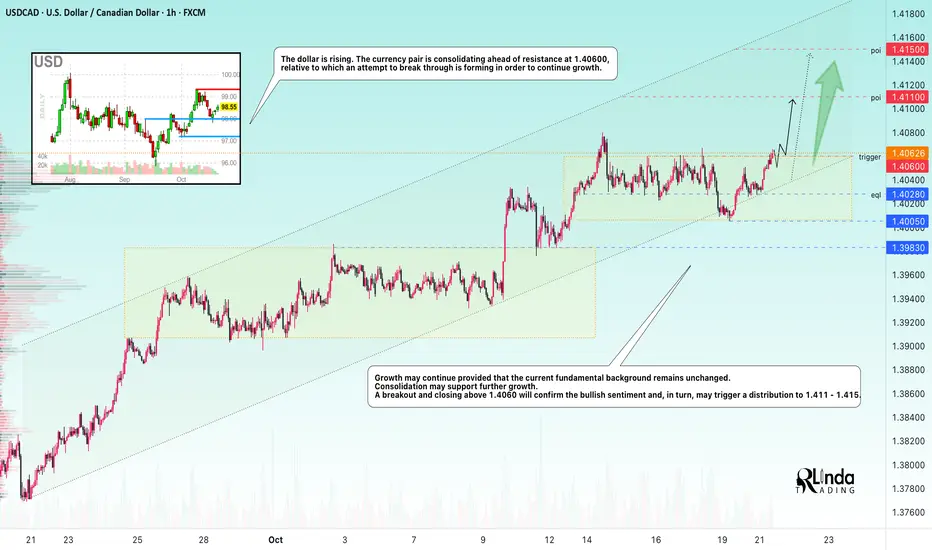
USDCAD → Attempt to break through resistance to continue growth FX:USDCAD is attempting to break through consolidation resistance within an uptrend. Growth in the dollar index may support the current trend.
The dollar is rising. The currency pair is consolidating ahead of resistance at 1.40600, against which it is attempting to break through in order to continue growing.
The growth may continue if the current fundamental background remains unchanged. Consolidation may support further growth. A breakout and closing above 1.4060 will confirm the bullish sentiment and, in turn, may trigger a distribution to 1.411 - 1.415.
Resistance levels: 1.4060
Support levels: 1.4028, 1.4005
The trend is bullish, with virtually no pullback after the growth, only consolidation, which is technically a positive sign. A breakout of the specified consolidation resistance could trigger distribution to areas of interest.
Best regards, R. Linda!
GBPUSD: Breakout and Potential RetraceHey Traders, in today's trading session we are monitoring GBPUSD for a buying opportunity around 1.33600 zone, GBPUSD was trading in a downtrend and successfully managed to break it out. Currently is in a correction phase in which it is approaching the retrace area at 1.33600 support and resistance zone.
Trade safe, Joe.

USDJPY Holds Firm Above 151, Dollar Strength Faces Yen’s Haven USDJPY has surged to fresh highs above 153 before pulling back, showing how stretched the pair has become after weeks of relentless dollar strength. The dollar continues to benefit from sticky US inflation and hawkish Fed expectations, but the yen is finding some defensive flows as Japanese politics and global risk aversion come into play. This leaves USDJPY in a pivotal zone: either buyers defend the 151 handle for another push higher, or yen resilience drags the pair into a deeper correction.
Current Bias
Bullish – Despite the pullback, the trend remains tilted toward further USD strength as long as price stays above 151.00.
Key Fundamental Drivers
US Dollar (USD): Firm inflation, resilient labor data, and higher Treasury yields keep the dollar bid. The Fed is signaling patience before cutting, supporting front-end yield spreads in favor of the USD.
Japanese Yen (JPY): BOJ remains ultra-loose, but rising domestic political pressure and stronger wages are fueling speculation that policy normalization could come earlier than expected.
Risk Sentiment: JPY gains when equities wobble, while USD stays supported by yield and safe-haven flows.
Macro Context
Interest Rates: Fed is cautious about cutting, while BOJ is still holding rates near zero. The divergence remains a powerful driver of USDJPY.
Economic Growth: US growth has outpaced expectations, while Japan shows modest recovery but still depends heavily on exports.
Geopolitical Themes: US–China tariffs, Middle East risks, and Japanese election speculation all tilt in favor of JPY demand on risk-off days, but USD retains the upper hand when markets stabilize.
Primary Risk to the Trend
A sharp shift in BOJ guidance or surprise yen-supportive intervention could trigger a rapid unwind in USDJPY longs.
Most Critical Upcoming News/Event
US CPI data – any upside surprise could cement Fed caution and push USDJPY back to highs.
BOJ commentary – signals of policy adjustment would likely strengthen the yen.
Leader/Lagger Dynamics
USDJPY is a leader in yen pairs, often setting direction for EURJPY, GBPJPY, and CADJPY. It also acts as a barometer for global risk sentiment, with USDJPY strength often reflecting broad dollar dominance.
Key Levels
Support Levels:
151.50
149.95
Resistance Levels:
153.15
154.00
Stop Loss (SL): 148.40
Take Profit (TP): 153.15
Summary: Bias and Watchpoints
USDJPY remains bullish above 151.00, with a stop placed at 148.40 to guard against deeper corrections. A take-profit zone near 153.15 aligns with the recent rejection point. The key watchpoints are US inflation data and BOJ communication, both of which could determine if this move extends higher or stalls. For now, USDJPY remains the dominant driver of yen flows, keeping its role as a leader among JPY crosses.

GBP/USD Analysis – Waiting for a Rejection at Key Supply ZoneAfter multiple rejections from the 1.3450–1.3470 area, GBP/USD continues to trade inside a wide consolidation range, showing signs of exhaustion from buyers. Price is currently hovering near the 1.3400 EMA cluster (20/50/100/200), which acts as short-term dynamic resistance.
Technical Outlook
Resistance zone: 1.3450 – 1.3470
Immediate resistance: 1.3410 – 1.3420 (EMA confluence)
Support: 1.3370 – 1.3380
Major support: 1.3320
Fibonacci retracement from the previous swing high indicates that 1.3450 aligns with the 61.8 % zone — a classic level where sellers often return. As long as price remains below this region, the broader structure favors a potential bearish continuation.
Trading Strategy
Traders may look for a short-term pullback toward 1.3440–1.3460 to confirm a bearish rejection pattern (such as a bearish engulfing or BOS break).
If confirmed, a sell setup could target the 1.3380 – 1.3350 region.
A break below 1.3380 would likely trigger a continuation toward 1.3320 support, completing the projected leg of the descending structure.
Summary
Trend bias: Bearish below 1.3460
Possible short opportunity: 1.3440–1.3460 zone
Targets: 1.3380 → 1.3320
Invalidated if price closes firmly above 1.3470
Price action remains range-bound, but momentum indicators (EMA alignment and RSI divergence) suggest that sellers may soon regain control.
Stay patient — wait for a clear rejection signal at the supply zone before entering.
Follow for more daily strategies and smart trading insights.

USDJPY Technical Analysis – Bearish Reversal UnderwayAfter failing to hold above the short-term resistance zone near 0.00666, USDJPY has shown clear rejection signals, leading to a strong break below the cluster of EMAs (20/50/100/200). The price is now retesting this confluence area, suggesting a potential continuation of the downward leg if sellers maintain control.
From a structure standpoint, the market has shifted from a higher-high sequence into a lower-high → lower-low pattern, confirming bearish momentum. The rejection candle near the EMA200 acted as a key trigger for short entries.
Key Levels to Watch
Resistance: 0.00663 – 0.00664 (EMA confluence + previous structure)
Support 1: 0.00658 (intermediate target)
Support 2: 0.00657 – 0.00654 (Fibonacci 0.618 extension zone)
Trading Strategy
Primary bias: Sell on pullback
Entry zone: 0.00662 – 0.00663
Stop-loss: Above 0.00664 (previous high / EMA cross)
Take-profit targets: 0.00658 → 0.00657 → 0.00654
As long as price remains below the 100- and 200-EMA cluster, bearish pressure is expected to dominate. A confirmed daily close beneath 0.00658 could open the door for an extended drop toward 0.00650.
Stay patient, wait for rejection confirmations, and remember: discipline > prediction. Follow for more daily trade plans and strategy insights.

Double Top Confirmed! Is Gold About to Fall Deeper?As expected from my previous idea , Gold touched its target of $4,183 ( the double top pattern’s target(Small) ). Before reaching that target, it had some ups and downs over the past few days, mainly due to the ongoing US-China tensions .
Gold is trading near a Support zone($4,193 – $4,156) .
From a classical technical analysis perspective, it’s forming a clear double top pattern on the 1-hour timeframe . There’s also a regular bearish divergence (RD-) visible between the two peaks of the double top.
From an Elliott Wave theory standpoint, it looks like Gold has started its corrective wave. If the Support zone($4,193 – $4,156) and the double top pattern’s neckline break , we can expect further downside .
I expect that after breaking the Support zone($4,193 – $4,156) and the neckline , Gold could drop at least to around $4,083(First Target) .
Second Target: $4,057
Stop Loss(SL): $4,385(Worst)
Note: Keep in mind that given the ongoing US-China tensions, any news could invalidate this analysis. So it’s more important than ever to manage your risk carefully these days.
Please respect each other's ideas and express them politely if you agree or disagree.
Gold Analyze (XAUUSD), 1-hour time frame.
Be sure to follow the updated ideas.
Do not forget to put a Stop loss for your positions (For every position you want to open).
Please follow your strategy; this is just my idea, and I will gladly see your ideas in this post.
Please do not forget the ✅ ' like ' ✅ button 🙏😊 & Share it with your friends; thanks, and Trade safe.
