Don't Miss Out! Mastering Elliot Waves : 3 Essential PrinciplesHello friends!
Welcome to RK_Chaarts !!
Let's dive into the ruling principles of Elliot Waves that we cannot violate. There are three key principles:
1. Wave 2 will never Retrace more than 100% of wave 1
2. Wave 3 will never be the shortest among the three impulses (1, 3, and 5).
3. Wave 4 will never enter the territory of wave 1 (except in diagonals or triangles, where wave 4 can overlap with wave 1).
In this post, we'll explore how to apply these principles to analyze and solve the puzzle of a complete chart. We'll use a live example from the chart of SAMVARDHNA MOTHERSON, which is a tough and technically challenging chart. However, using Elliot Wave principles, we'll attempt to solve it.
Please note that this post is for educational purposes only and should not be considered as trading advice. We'll discuss potential scenarios, alternative possibilities, and "what-if" situations.
I hope you find this post helpful and informative. It's a comprehensive explanation in Hindi, and I'm confident that you'll gain valuable insights from it.
Happy learning!
I am not Sebi registered analyst.
My studies are for educational purpose only.
Please Consult your financial advisor before trading or investing.
I am not responsible for any kinds of your profits and your losses.
Most investors treat trading as a hobby because they have a full-time job doing something else.
However, If you treat trading like a business, it will pay you like a business.
If you treat like a hobby, hobbies don't pay, they cost you...!
Hope this post is helpful to community
Thanks
RK💕
Disclaimer and Risk Warning.
The analysis and discussion provided on in.tradingview.com is intended for educational purposes only and should not be relied upon for trading decisions. RK_Chaarts is not an investment adviser and the information provided here should not be taken as professional investment advice. Before buying or selling any investments, securities, or precious metals, it is recommended that you conduct your own due diligence. RK_Chaarts does not share in your profits and will not take responsibility for any losses you may incur. So Please Consult your financial advisor before trading or investing.
Wave Analysis

BTC Breakout: Symmetrical Triangle Formation Near Key Resistance Bitcoin highlights a symmetrical triangle pattern forming just below a descending trendline and key resistance zone around $96,000–$96,600. The price action is consolidating within narrowing support and resistance lines, suggesting a potential breakout. A bullish breakout above the red trendline and consolidation above $96,000 could lead to a strong upward move toward the resistance zone. Traders should watch for volume confirmation and breakout retest opportunities for optimal entry points.

Bitcoin Range-Bound in Heavy Resistance – CME Gap Still Open!Bitcoin ( BINANCE:BTCUSDT ), like Gold , has been moving in a Range for the past 5-6 days and is currently in a Heavy Resistance zone($95,950-$88,500) , as it has been in the past few days .
In terms of Elliott Wave theory , Bitcoin appears to be completing a main wave 4 . The main wave 4 structure can take two forms: Double Three Correction(WXY)_Expanding Flat(3-3-5) .
I label this analysis " Short " for the following reasons:
Due to Bitcoin's higher correlation with the S&P 500 Index ( SP:SPX ) these days, I am short on the S&P 500 Index.
China’s president Xi Jinping says Trump lied about them having a phone call ; it is NOT good news for the S&P 500 Index and Bitcoin .
CME Gap($92,525-$91,415) has NOT filled yet, and I think Bitcoin will NOT start the next bullish rally before filling the CME Gap.
I expect Bitcoin to drop to at least $92,830 and then decline to the Support zone($92,000-$91,400) if the Support lines are broken.
Cumulative Short Liquidation Leverage: $96,741-$95,520
Note: If Bitcoin can touch $97,000, we should expect more pumping.
Note: If Bitcoin goes below the 100_SMA(Daily), we should expect a fall.
Please respect each other's ideas and express them politely if you agree or disagree.
Bitcoin Analyze (BTCUSDT), 1-hour time frame.
Be sure to follow the updated ideas.
Do not forget to put a Stop loss for your positions (For every position you want to open).
Please follow your strategy and updates; this is just my Idea, and I will gladly see your ideas in this post.
Please do not forget the ✅' like '✅ button 🙏😊 & Share it with your friends; thanks, and Trade safe.

BTC new ATH Bitcoin looks poised for a major breakout this summer. With increasing institutional adoption, declining inflation, and the recent halving event tightening supply, the setup for a rally is strong. If momentum holds and macro conditions remain favorable, I wouldn’t be surprised to see BTC hit $120,000 by the end of the summer. The market is showing renewed strength, and the sentiment is shifting bullish again.


EURUSD Shorts?EURUSD has been hinting on bearish momentum with formation of CRT on the weekly timeframe followed by a bearish week prise close...

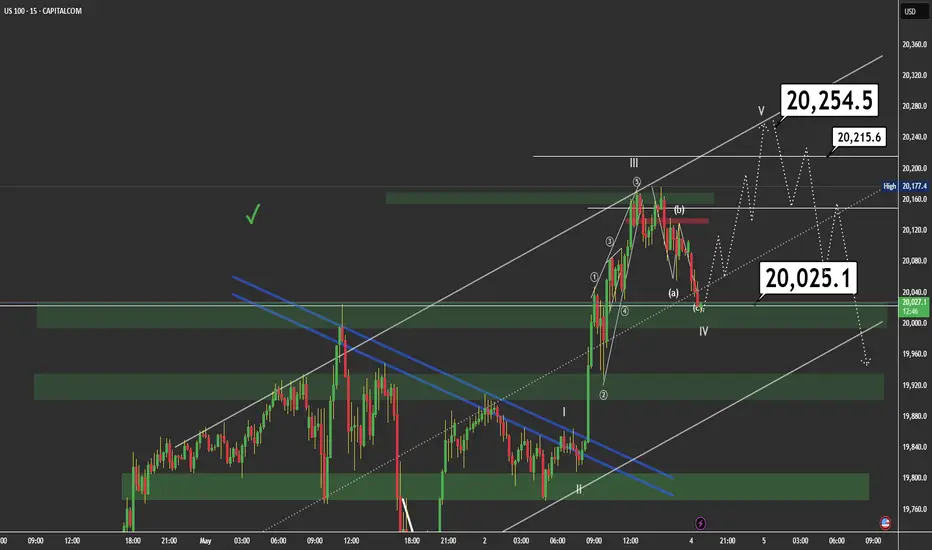
Wave V in PlayThe market appears to have completed a corrective wave IV, forming an ABC structure that tapped into the key demand zone around 20,025.1. This zone aligns with previous structure support, the lower boundary of the ascending channel, and a critical trendline.
🔍 Likely scenario:
If price holds above this level, we could be witnessing the beginning of wave V, with potential targets near 20,254.5.
Wave V is expected to unfold in 5 smaller internal waves and may extend further if price breaks through the mid-channel resistance.
🚨 🔺 CRUCIAL LEVEL TO WATCH: The 20,215 area is extremely important. Price reaction here will be decisive:
A strong rejection could signal a truncated wave V or the start of a deeper correction.
A clean breakout would confirm bullish continuation toward 20,254.5 and beyond.
🟢 Key Zones:
📌 Demand: 20,025 – 20,000
📌 Critical Resistance: 20,215
📌 Wave V Target: 20,254.5
📌 Invalidation level: A drop below 19,975 would invalidate the current bullish count.
📌 Trade Plan:
Look for bullish confirmation at 20,025 to consider long setups.
Watch 20,215 closely for signs of strength or rejection. If price breaks above it with momentum, continuation is likely.
Netflix is going to fall sharply soonNetflix is in the huge 5th wave extension. I expect it to complete wave (v) of 5 very soon, probably within the next week.
RSI divergence on 3-days, weekly frames is quite visible and supports the upcoming trend reversal.
When wave 5 is extended, retracement typically goes to the bottom of wave (ii) of this 5th wave. This would mean 1180-1195 USD to end the wave 5. Also, at this price wave 5 will be 2.168 times bigger than waves 1 and 3 together.

Gas vs. OPEC+🔥 #GasHasNoMercy
📉 Gas is again following the main scenario closely. We stayed out of the market most of the time, as the movement was a correction within the primary downtrend, which remains intact.
The wave is nearing completion. Historically, gas rarely reverses after weekends—it typically continues the previous week’s trend until Tuesday-Wednesday. However, we now expect oil to gap down at the open due to OPEC+’s decision to accelerate production increases. This creates uncertainty in gas’s reaction:
▪️ Logically, gas should rise (lower oil prices → reduced U.S. production → less associated gas → higher gas prices).
▪️ But the market might temporarily ignore this correlation and follow oil’s lead.
Current tactic: Trade with the trend (downward). Not advice or recommendation.
💬 Your thoughts?
🔄 Agree with the plan? Comment below ➡️
⚠️ Disclaimer:
My analysis is for discussion purposes, not trading advice. Trading gas with leverage and no stop-losses is like playing with fire—high risk to capital and mental health.


Ethereum: Time for the ALT COIN KING to reclaim its throne Who wants Ethereum? Nobody! But that's when the best investment opportunities present themselves. Over the past few weeks Ethereum has seen a sizeable bounce off the 0.618 fib, and the 2017 Bull Market Top at $1,420.
The trade idea is that Ethereum never finished its bear market correction, and still needs Orange Wave D & E to complete the bear market correction (Yellow Wave 4). Additionally, on the monthly time frame, Ethereum has printed a bullish monthly dragonfly doji. In my opinion, this has reduced the probability of Ethereum crashing into the abyss. Targeting at least $7,290.50 for a potential bull market top.
In the short term, Ethereum must reclaim the resistance level at $2,112 as support ASAP. Additionally, Ethereum Dominance is trading in Wyckoff Accumulation on lower time frames.

Gold's Symmetrical Triangle Near Break – Support Test Imminent!Gold ( OANDA:XAUUSD ) moved as I expected in my previous post and attacked the Support zone($3,282-$3,245) and Support lines for the second time . The question is, can Gold break the Support zone($3,282-$3,245) and Support lines or not!?
Please stay with me .
Gold is moving between Support zone($3,282-$3,245) and Resistance zone($3,386-$3,357) again . In fact, it can be said that Gold has been moving in a range for the past 5-6 days .
From a Classical Technical Analysis perspective, Gold appears to be forming a Symmetrical Triangle Pattern. A break of either line could indicate the next direction for Gold, but since the Symmetrical Triangle Pattern is a Continuation Pattern , the lower line is more likely to break .
In terms of Elliott Wave Theory analysis , it seems that we still have to wait for the next five downwaves .
------------------------------------------
Today, important U.S. data — JOLTS Job Openings and CB Consumer Confidence — will be released.
Let’s quickly review their potential impact on Gold:
JOLTS Job Openings :
If the number comes lower than expected , it signals a weakening labor market, increasing the chances of a dovish Fed → Bullish for Gold .
If the number is stronger than expected , it indicates a robust labor market, pushing the Fed to stay hawkish → Bearish for Gold .
CB Consumer Confidence :
A drop in consumer confidence reflects economic worries , driving demand for safe-haven assets like Gold → Bullish .
A rise in consumer confidence shows economic strength, reducing the appeal of Gold → Bearish .
Historical Impact :
Both indices have caused strong intraday moves in Gold recently, especially if the figures surprise the market.
Summary :
Weak JOLTS and low Confidence → Gold bullish
Strong JOLTS and high Confidence → Gold bearish
Be prepared for high volatility during the releases. Always manage your risk carefully!
------------------------------------------
I expect Gold to attack the Support zone($3,282-$3,245) and Support lines for at least the third time , and if it breaks, the next target could be $3,223 .
Note: If Gold can move above $3,393, we can expect more pumps and maybe make a new All-Time High(ATH).
Gold Analyze ( XAUUSD ), 1-hour time frame.
Be sure to follow the updated ideas.
Do not forget to put a Stop loss for your positions (For every position you want to open).
Please follow your strategy; this is just my idea, and I will gladly see your ideas in this post.
Please do not forget the ✅' like '✅ button 🙏😊 & Share it with your friends; thanks, and Trade safe.

TSLA Technical Analysis🚀 TSLA Long-Term Buy Setup (Educational Trade Idea)
I’ve entered a long position on Tesla (TSLA) at $246.57 based on a clear technical breakout from a downtrend and consolidation pattern.
✅ Target: $487.66
❌ Stop Loss: $209.36
📊 Risk-Reward Ratio: 1:6.58 — extremely favorable setup
Price action shows a textbook breakout from accumulation, followed by bullish structure. This move aligns with the Smart Money Concept — entering after accumulation, not during uncertainty.
🕒 This is a long-term swing trade, meaning it could take weeks or months to fully develop.
⚠️ Disclaimer: This is not financial advice, but an educational breakdown for learning purposes. Always manage your own risk and do your own analysis before trading.

#ETH/USDT#ETH
The price is moving within a descending channel on the 1-hour frame, adhering well to it, and is heading for a strong breakout and retest.
We are seeing a rebound from the lower boundary of the descending channel, which is support at 1815.
We have a downtrend on the RSI indicator that is about to be broken and retested, supporting the upward trend.
We are looking for stability above the 100 Moving Average.
Entry price: 1840
First target: 1860
Second target: 1876
Third target: 1890

BTC Long Setup - Manipulation Before AccumulationBTC has shown weakness in volume and retesting the ascending trendline. BTC should experience the pending retracement from the current levels, below will be my long entry:
Entry: 87727
Target: 100300
Stoploss: 82444

BABY Looks Bullish (4H)Note: Given the corrective nature of the market, only consider entering this symbol within the green zone. Move to break-even at the first target.
According to the Baby structure, this symbol appears to be aiming to remain bullish.
From the point where we placed the (A) on the chart, expansion waves have started on this symbol.
As long as the green zone is maintained, the price can move toward the targets.
A daily candle closing below the invalidation level will invalidate this analysis.
For risk management, please don't forget stop loss and capital management
Comment if you have any questions
Thank You

EUR-AUD Strong Breakout! Sell!
Hello,Traders!
EUR-AUD made a bearish
Breakout of the rising support
Line and the breakout is
Confirmed so we will be
Expecting a further bearish
Move down on Monday
Sell!
Comment and subscribe to help us grow!
Check out other forecasts below too!
Disclosure: I am part of Trade Nation's Influencer program and receive a monthly fee for using their TradingView charts in my analysis.

USDJPY Will Move Higher! Long!
Take a look at our analysis for USDJPY.
Time Frame: 12h
Current Trend: Bullish
Sentiment: Oversold (based on 7-period RSI)
Forecast: Bullish
The market is on a crucial zone of demand 144.942.
The oversold market condition in a combination with key structure gives us a relatively strong bullish signal with goal 148.284 level.
P.S
We determine oversold/overbought condition with RSI indicator.
When it drops below 30 - the market is considered to be oversold.
When it bounces above 70 - the market is considered to be overbought.
Disclosure: I am part of Trade Nation's Influencer program and receive a monthly fee for using their TradingView charts in my analysis.
Like and subscribe and comment my ideas if you enjoy them!

ZAL Trade Plan – Strong Fundamentals & High Growth PotentialCompany Overview:
ZAL is fundamentally one of the strongest companies in the market, showcasing impressive growth driven by increasing sales and expanding profit margins. The company is actively scaling its operations, which sets the stage for even greater future earnings. Given its solid financials and business expansion, ZAL holds significant potential for capital appreciation.
Growth Outlook:
With a strong earnings trajectory and business development initiatives, the stock price has the potential to generate gains of 40–70%, depending on the size of the upcoming rally.
✅ Trade Setup
Entry Options:
Breakout Entry: Buy on a confirmed breakout with closing above Rs. 17
Dip Entry: Buy between Rs. 15.20 – 14.50 (ideal accumulation zone) , CZ it will form the right Shoulder of Head and shoulder Pattern
Risk Management:
Stop-Loss: Rs. 13 (to manage downside risk)
Take-Profit Levels:
TP1: Rs. 16.50
TP2: Rs. 19.00
TP3: Rs. 22.00
TP4: Rs. 24.00
📌 Note: Follow proper risk management and position sizing based on your portfolio. Monitor price action and volume closely around the breakout level for confirmation.

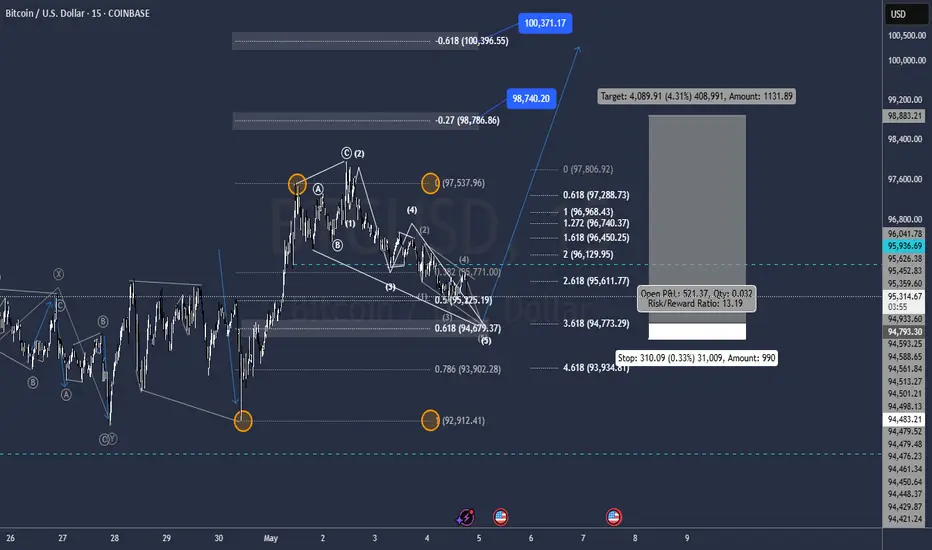
Bircoin correction should End @ 94.800Correction About to Complete Wave 5 for Expnding Flat Correction
Matching .618 Retracement and 3.618 wave 1 of C Expansion to the pip @ 94.800.
Targets @ 98.750/ 100.350 And Further
US30 Eyes 41,300: Bullish Momentum Builds for Major BreakoutTechnical Analysis: The US30 has established a strong support base at 40500, with major support at 40000 serving as a safety net. Price action shows an upward channel formation on the 4-hour chart, indicating potential trend reversal. The risk-reward ratio of 1.60 (500 points risk for 800 points potential reward) provides favorable trading conditions. Recent price action demonstrates higher lows, suggesting accumulation phase and bullish momentum building.
Sentiment Analysis: Market sentiment shows cautious optimism despite recent volatility. Institutional investors maintain bullish positions, particularly in technology and energy sectors. The AAII Investor Sentiment Survey indicates decreased bullish sentiment, which often serves as a contrarian indicator suggesting potential upside movement. Economic forecasts pointing toward a soft landing rather than hard recession support continued equity market strength.
Support and Resistance Levels: Entry zone established around 40500, supported by historical price action and recent consolidation patterns. Major support at 40000 provides clear stop loss level, limiting downside risk. Target of 41300 aligns with previous resistance zone, offering realistic profit objective before encountering major resistance at 41500. Multiple tests of support levels have created strong foundation for upward movement.
Trade Management: Entry: 40500 Stop Loss: 40000 (500 points risk) Target: 41300 (800 points reward) Risk/Reward: 1.60
Additional Considerations: Recent market correction has created oversold conditions, suggesting potential mean reversion toward higher levels. Institutional buying pressure remains strong, with increased volume on upward movements. Technical indicators suggest room for upside before reaching overbought conditions. The 2024 performance showing 12.88% gain supports continued bullish momentum.
The combination of strong technical setup, positive institutional sentiment, and clearly defined support/resistance levels presents a compelling case for longing US30 with 41300 target. The favorable risk-reward ratio and multiple confirmation factors enhance the probability of successful trade execution.

SILVER Set To Grow! BUY!
My dear subscribers,
My technical analysis for SILVER is below:
The price is coiling around a solid key level - 32.014
Bias - Bullish
Technical Indicators: Pivot Points Low anticipates a potential price reversal.
Super trend shows a clear buy, giving a perfect indicators' convergence.
Goal - 32.660
My Stop Loss - 31.682
About Used Indicators:
By the very nature of the supertrend indicator, it offers firm support and resistance levels for traders to enter and exit trades. Additionally, it also provides signals for setting stop losses
Disclosure: I am part of Trade Nation's Influencer program and receive a monthly fee for using their TradingView charts in my analysis.
———————————
WISH YOU ALL LUCK

QQQ Technical Analysis! SELL!
My dear subscribers,
This is my opinion on the QQQ next move:
The instrument tests an important psychological level 488.86
Bias - Bearish
Technical Indicators: Supper Trend gives a precise Bearish signal, while Pivot Point HL predicts price changes and potential reversals in the market.
Target - 463.87
About Used Indicators:
On the subsequent day, trading above the pivot point is thought to indicate ongoing bullish sentiment, while trading below the pivot point indicates bearish sentiment.
Disclosure: I am part of Trade Nation's Influencer program and receive a monthly fee for using their TradingView charts in my analysis.
———————————
WISH YOU ALL LUCK

APPLE Set To Grow! BUY!
My dear friends,
Please, find my technical outlook for APPLE below:
The price is coiling around a solid key level - 205.25
Bias - Bullish
Technical Indicators: Pivot Points High anticipates a potential price reversal.
Super trend shows a clear buy, giving a perfect indicators' convergence.
Goal - 208.36
About Used Indicators:
The pivot point itself is simply the average of the high, low and closing prices from the previous trading day.
Disclosure: I am part of Trade Nation's Influencer program and receive a monthly fee for using their TradingView charts in my analysis.
———————————
WISH YOU ALL LUCK
