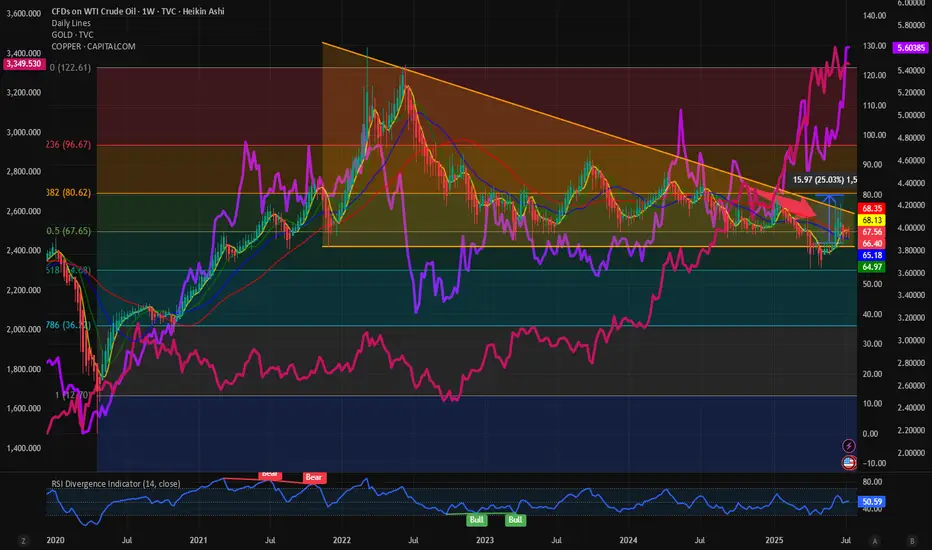
$USOIL: Will we see breakout or breakdown from this wedge? I have been watching the Commodity markets recently keenly to get direction or for market indications. AMEX:GLD , Copper and TVC:USOIL are the big 3 which determines the direction of commodity markets and hence the inflation. Inflation dictates direction of TVC:US10Y , TVC:DXY and hence the Equity markets. So, what are commodity markets telling us? With AMEX:GLD and OANDA:XCUUSD at ATH what does this mean for TVC:USOIL : TVC:USOIL Is in a bearish pattern and no sign of concrete bullish reversal on the commodity. Recently it has shown some signs of strength but still below its 0.5 Fib retracement level which is at 68 and we have time and again said that 0.318 Fib level at 80 $ might prove to be an upper resistance which will be difficult to breakout.
In the recent months whenever TVC:USOIL tries to break out of the 60 RSI sellers came back and pushed the prices down. Currently with RSI at 50 we might have some room for upside. Oil bulls can have a 20% upside in the RSI taking it to 60 which has historically proved to be a resistance. And a 20% upside in price is also possible with price hitting our 0.318 resistance level of 80%. Above that there is limited upside for $USOIL. The downward slopping wedge shown below indicates a breakout might be imminent which might take TVC:USOIL to 80 $ which is our highest target in this range bound market.
In contrast the bull run in other important commodities like AMEX:GLD and COPPER might have some legs as they are showing strength by breaking above the previous ATH. It is always a good idea to buy strength and ATH.
Verdict: TVC:USOIL remains range bound with 55 $ on lower bound and 80 on the upper bound. Commodity bulls can look at AMEX:GLD and OANDA:XCUUSD for better returns.
Xcuusd (Copper)
COPPER Top of 4-year Rising Wedge. Sell.Copper (HG1!) eventually followed the bearish break-out signal we gave on our last analysis (April 03, see chart below) and within 2 days it hit our 4.1250 Target:
Right now the price sits at the top of the 4-year Rising Wedge pattern and on the 1W time-frame it is a textbook technical sell signal.
With the 1W RSI also rejected on a Lower Highs trend-line, we are looking to aim for the 1W MA50 (blue trend-line) at least. Every Bearish Leg since the July 11 2022 Low, reached at least its 0.618 Fibonacci retracement level before rebounding again.
As a result, our Target is 4.700, which given a fair 3-month time-frame, should be at the time marginally below the 1W MA50, in line with all previous bottoms of the Rising Wedge.
-------------------------------------------------------------------------------
** Please LIKE 👍, FOLLOW ✅, SHARE 🙌 and COMMENT ✍ if you enjoy this idea! Also share your ideas and charts in the comments section below! This is best way to keep it relevant, support us, keep the content here free and allow the idea to reach as many people as possible. **
-------------------------------------------------------------------------------
💸💸💸💸💸💸
👇 👇 👇 👇 👇 👇

Buying Copper at 50% retracement.XCUUSD - Intraday - We look to Buy at 4.074 (stop at 4.034)
The 50% Fibonacci retracement is located at 4.087 from 4.237 to 3.937.
Prices have reacted from 3.936.
Daily signals are mildly bullish.
Short term momentum is bullish.
A lower correction is expected.
Our profit targets will be 4.174 and 4.194
Resistance: 4.130 / 4.150 / 4.175
Support: 4.100 / 4.070 / 4.050
Please be advised that the information presented on TradingView is provided to Vantage (‘Vantage Global Limited’, ‘we’) by a third-party provider (‘Signal Centre’). Please be reminded that you are solely responsible for the trading decisions on your account. There is a very high degree of risk involved in trading. Any information and/or content is intended entirely for research, educational and informational purposes only and does not constitute investment or consultation advice or investment strategy. The information is not tailored to the investment needs of any specific person and therefore does not involve a consideration of any of the investment objectives, financial situation or needs of any viewer that may receive it. Kindly also note that past performance is not a reliable indicator of future results. Actual results may differ materially from those anticipated in forward-looking or past performance statements. We assume no liability as to the accuracy or completeness of any of the information and/or content provided herein and the Company cannot be held responsible for any omission, mistake nor for any loss or damage including without limitation to any loss of profit which may arise from reliance on any information supplied by Signal Centre.

XCU/USD: Low-Risk Loot Opportunity!🔥 THE COPPER HEIST: XCU/USD Robbery Plan (Swing/Day Trade) 🔥
🌟 Attention, Market Robbers & Money Makers! 🌟
(Hola! Oi! Bonjour! Hallo! Marhaba!) 🤑💰💸✈️
Based on the 🔥Thief Trading Style🔥, here’s our master heist plan for the XCU/USD "The Copper" Metals Market! This is a high-probability long setup, but we must escape before the police (bears) set their trap near the red zone! 🚨📉
📌 THE HEIST BLUEPRINT
✔ Entry Strategy (Breakout or Pullback)
✔ Stop Loss (Protect Your Loot!)
✔ Target (Escape Before the Cops Arrive!)
🚀 ENTRY: TIME TO STRIKE!
"The heist is ON! Wait for the ATR breakout (5.00000) before moving!"
Option 1: Place Buy Stop orders above the Moving Average.
Option 2: Use Buy Limit orders on pullbacks (15m/30m recent swing lows).
📢 ALERT! Set a breakout alarm—don’t miss the move!
🛑 STOP LOSS: PROTECT YOUR LOOT!
"Yo, listen up! 🗣️ If you're entering on a Buy Stop, DON’T set your SL until AFTER the breakout!
📍 Thief SL Placement: Recent swing low + Moving Average (5H TF) → 4.80000
⚠️ WARNING: If you ignore this, you’re playing with fire! 🔥 (Your risk, not mine!)
🎯 TARGET: CASH OUT & ESCAPE!
🏴☠️ First Take-Profit: 5.25000 (or exit early if the market turns!)
💰 Scalpers: Only trade LONG—use trailing SL to lock in profits!
📊 MARKET STATUS: NEUTRAL (But Bullish Potential! 🐂)
Fundamentals? Check COT Reports, Macro Data, Geopolitics, News Sentiment!
🔗 Links in bio0 for full analysis! 👉🌎📰
🚨 TRADING ALERT: NEWS = VOLATILITY!
⚠️ Avoid new trades during major news!
🔒 Use Trailing SL to protect open positions!
💥 BOOST THIS HEIST PLAN!
Hit 👍 LIKE & 🔄 SHARE to strengthen our robbery squad!
🚀 More heists coming soon—stay tuned! 🤑💎
🎯 FINAL WORD:
"Take profits, treat yourself—you deserve it! 💸🏆"

Gap below… but copper’s breakout still in playCopper markets erupted higher this week following President Trump's proposal to impose a 50% tariff on copper imports. The price ripped from just above $5.20 to nearly $5.80 in a single 4-hour candle.
Now, copper could be forming a bullish flag or pennant on the 4-hour timeframe. After the vertical spike, price is consolidating in a tight, potentially downward-sloping channel between ~$5.45 and ~$5.60.
If confirmed with a clean breakout above the flag’s upper trendline - perhaps near $5.62—the next leg could project toward the previous high near $5.80
There’s also a gap below current price action, between $5.20 and $5.35, formed during the explosive move up. While gaps can act as support zones, they also tend to get revisited.

Copper Nears Breakout–Fundamentals and Technicals Both Say “Buy"Copper, often called “the metal with a PhD in economics”, is sending a clear message: we’re entering a new bullish era.
As of mid-May 2025, Copper is trading above $4.85 per pound, approaching the psychological $5.00 level — a key threshold that could trigger further upside momentum.
________________________________________
🔎 Fundamentals: A Perfect Storm of Demand and Supply Pressure
Copper is no longer just about cyclical demand — it's about structural shifts:
• 🟩 Demand is exploding thanks to:
- Accelerated electrification (EVs use up to 4x more copper than traditional cars)
- Renewable energy infrastructure (cables, turbines, transformers)
- China’s infrastructure push and global energy transition
• 🟥 Supply remains constrained:
- Inventories at multi-year lows (LME + SHFE down over 40% YoY)
- Underinvestment in mining: new copper projects take 8–10 years to develop
- Smelting disruptions in Peru and DRC
- China controls ~70% of global refining capacity — a geopolitical risk amid trade tensions
📊 Big Banks Are Bullish:
• Goldman Sachs sees $10,700/ton within 12 months
• Morgan Stanley targets $9,500/ton by end of 2025
• J.P. Morgan: "Copper is at the heart of a multi-year base metals upcycle"
________________________________________
📉 Technical Outlook: Higher Lows, Strong Rebounds, and a Breakout in Sight
From a charting perspective, Copper’s structure confirms what the fundamentals are screaming:
• After topping around $5.00 in March 2022, the price dropped sharply to just above $3.00 by mid-summer
• That area marked a strong support zone, coinciding with old resistance from 2017–2018
• A higher low at $3.50 was made in October 2023, setting the tone for a new bullish phase
• Since then, Copper has respected a clear ascending trendline
🚨 The drop in late March / early April (coinciding with the start of the Tariff Saga) brought high volatility, sending price briefly from above $5.00 to around $4.00 support. But bulls stepped in fast.
Now, price is back near $5.00, threatening a major breakout.
________________________________________
🎯 What’s Next?
If Copper breaks above the $5.00 resistance zone, we could see acceleration toward the $7.00 level — a feasible medium-term target, supported by both supply/demand dynamics and price structure.
________________________________________
📊 Trading Plan:
With fundamentals and technicals aligned, the strategy is straightforward:
Buy dips, especially toward $4.60–$4.70, and look for confirmation of breakout above $5.00 for medium-term positioning.
________________________________________
📌 Big moves need big reasons — and Copper has plenty.
This may be just the beginning of a multi-year opportunity. 🚀

Ready to Rob the Copper Market? XCU/USD Heist Plan Revealed!🌍 Hello Global Traders! 🌟
Money Makers, Risk Takers, and Market Shakers! 🤑💸✈️
Dive into our XCU/USD "Copper" Metals Market heist, crafted with the signature 🔥Thief Trading Style🔥, blending sharp technicals and deep fundamentals. Follow the strategy outlined in the TradingView chart, focusing on a long entry targeting the high-risk Yellow ATR Zone. Expect a wild ride with overbought conditions, consolidation, and potential trend reversals where bearish players lurk. 🏆💰 Celebrate your wins, traders—you’ve earned it! 💪🎉
📈 Entry: Storm the Vault!
The market’s ripe for a bullish grab! 💥 For Pullback trade place buy limit orders within the most recent 15 or 30-minute swing low/high levels. Set alerts on your chart to stay locked in. 🔔
🛑 Stop Loss: Guard Your Loot!
Set your Thief SL at the nearest swing low on the 3H timeframe for day/swing trades. Adjust based on your risk tolerance, lot size, and number of orders. Safety first! 🔒
🎯 Targets: Claim Your Prize!
🏴☠️ Short-Term Target: 5.10000
👀 Scalpers, Listen Up!
Stick to long-side scalps. Got deep pockets? Jump in now! Otherwise, join swing traders for the heist. Use trailing stop-loss to lock in gains and protect your stash. 💰
🐂 Why XCU/USD "Copper" is Hot!
The Fiber’s bullish surge is fueled by key fundamentals. Dive into Macro, COT Reports, Quantitative Analysis, Sentiment, Intermarket trends, and future targets via the linkss below for the full scoop. 👉🔗. Stay informed to stay ahead! 📰
⚠️ Trading Alert: News & Position Management
News releases can shake the market like a heist gone wrong! 🗞️ To protect your profits:
🚫 Avoid new trades during news events.
🛡️ Use trailing stops to secure running positions.
💥 Boost the Heist!
Hit the Boost Button to supercharge our Thief Trading Strategy! 💪 Every click strengthens our crew, making it easier to swipe profits daily. Join the squad, trade smart, and let’s make money rain! 🌧️💵

Super bullish on Copper! A close above the white trend line would trigger the next leg up. I do believe it can break to new ATH if it get enough momentum on the break out.
Time will tell for sure!
OANDA:XCUUSD IG:COPPER CAPITALCOM:COPPER

XCU/USD "The Copper" Metals Market Heist Plan🌟Hi! Hola! Ola! Bonjour! Hallo! Marhaba!🌟
Dear Money Makers & Robbers, 🤑 💰💸✈️
Based on 🔥Thief Trading style technical and fundamental analysis🔥, here is our master plan to heist the XCU/USD "The Copper" Metals market. Please adhere to the strategy I've outlined in the chart, which emphasizes long entry. Our aim is the high-risk Red Zone. Risky level, overbought market, consolidation, trend reversal, trap at the level where traders and bearish robbers are stronger. 🏆💸Book Profits Be wealthy and safe trade.💪🏆🎉
Entry 📈 : "The vault is wide open! Swipe the Bullish loot at any price - the heist is on!
however I advise to Place buy limit orders within a 15 or 30 minute timeframe most recent or swing, low or high level. I Highly recommended you to put alert in your chart.
Stop Loss 🛑:
Thief SL placed at the recent / nearest low level Using the 4H timeframe (9500) swing trade basis.
SL is based on your risk of the trade, lot size and how many multiple orders you have to take.
Target 🎯: 10050 (or) Escape Before the Target
🧲Scalpers, take note 👀 : only scalp on the Long side. If you have a lot of money, you can go straight away; if not, you can join swing traders and carry out the robbery plan. Use trailing SL to safeguard your money 💰.
📰🗞️Read the Fundamental, Macro Economics, COT Report, Seasonal Factors, Intermarket Analysis, Sentimental Outlook:
XCU/USD "The Copper" Metals Market is currently experiencing a bullish trend,., driven by several key factors.
⭐Fundamental Analysis⭐
Overview: Fundamental analysis of XCU/USD involves evaluating the intrinsic value of copper based on economic, industrial, and external influences. At $9.70/lb, copper is at an unusually high level, suggesting strong demand, supply constraints, or external pressures.
Economic Growth: Copper is a key industrial metal tied to global GDP growth, particularly in manufacturing, construction, and electrification (e.g., EVs, renewable energy). A price of $9.70 could reflect robust economic expansion, especially in emerging markets like China and India.
Inflation and Currency: High inflation in 2025 could weaken the USD, pushing commodity prices like copper higher. Alternatively, a strong USD might temper this rise unless offset by other factors.
Industrial Demand: Increased demand from green energy (e.g., solar, wind, EVs) and infrastructure projects could justify this price.
Supply Constraints: Disruptions in major copper-producing countries (e.g., Chile, Peru) or reduced mining output could tighten supply, driving prices up.
⭐Macroeconomic Factors⭐
Interest Rates: If the Federal Reserve maintains high rates in 2025 to combat lingering inflation, this could strengthen the USD, typically pressuring commodity prices downward. However, at $9.70, demand might outweigh this effect.
Global Growth: Strong GDP growth in China (a top copper consumer) or a global infrastructure boom (e.g., post-2024 recovery) could support high prices. Conversely, a recession would cap upside potential.
Inflation: Persistent inflation in 2025 could make copper a hedge, boosting prices. A cooling inflation trend might signal a peak.
USD Strength: A weaker USD (e.g., due to Fed rate cuts) would naturally lift XCU/USD, while a stronger USD could challenge the $9.70 level unless supply/demand dynamics dominate.
⭐Geopolitical Factors⭐
Trade Policies: Escalating U.S.-China tensions or tariffs in 2025 could disrupt copper flows, raising prices if China stockpiles or seeks alternative suppliers.
Regional Instability: Political unrest in copper-rich regions like Peru or Chile (e.g., protests, strikes) could reduce output, supporting high prices. For instance, Peru’s flat production trends (noted in prior data) might persist.
Sanctions/War: Geopolitical events, such as sanctions on Russia (a minor copper player) or conflicts affecting shipping routes (e.g., Red Sea disruptions), could increase costs and prices.
Energy Transition: Global commitments to net-zero (e.g., post-COP29 agreements) might amplify copper demand, reinforcing the $9.70 level.
⭐Supply and Demand Factors⭐
Demand: Copper’s role in electrification (EVs, grids) and construction suggests strong demand. At $9.70, industries might face cost pressures, potentially curbing consumption unless offset by growth.
Supply: Multi-month low inventories (e.g., Shanghai warehouses) and challenges in mining (e.g., declining ore grades, environmental regulations) could limit supply. A price this high implies significant tightness.
Substitution Risk: High prices might encourage substitution (e.g., aluminum in wiring), though copper’s conductivity makes this limited in key applications.
Stockpiles: LME warehouse data showing declining stocks would support $9.70; rising inventories could signal a reversal.
⭐Technical Factors⭐
Price Levels: At $9.70, XCU/USD might be testing a major resistance (e.g., a psychological $10.00 level). Historical highs (around $4.90 in 2022) suggest this is a breakout, potentially overextended.
Moving Averages: If the 50-day MA ($9.50) and 200-day MA ($9.00) are below the current price, this indicates bullish momentum. A drop below these could signal a correction.
RSI: An RSI above 70 (overbought) at $9.70 suggests a potential pullback; below 50 would indicate bearish momentum.
Support/Resistance: Support might lie at $9.00–$9.20 (former resistance turned support), with resistance at $10.00–$10.50.
⭐Sentiment Factors⭐
Market Sentiment: At $9.70, sentiment is likely bullish, driven by optimism about industrial demand and supply fears. However, over exuberance could lead to profit-taking.
X Trends: Discussions on X about unexpected commodity price spikes (akin to trending weather surprises) might reflect surprise at this level, hinting at speculative froth.
Media: Positive coverage of copper’s role in green tech could fuel bullish sentiment; negative economic outlooks might shift it bearish.
⭐Seasonal Factors⭐
Construction Cycles: Spring (March–May) typically sees higher copper demand due to construction in the Northern Hemisphere, supporting $9.70.
Chinese Demand: Post-Lunar New Year (Feb 2025) often boosts industrial activity in China, aligning with this price spike.
Historical Patterns: Copper prices can peak mid-year if supply lags seasonal demand, suggesting $9.70 might hold short-term but face pressure later.
⭐Intermarket Analysis⭐
USD Index: A declining DXY (e.g., below 100) would support higher XCU/USD; a rising DXY could cap gains.
Gold (XAU/USD): Copper often correlates with gold as an inflation hedge. If gold is also at highs (e.g., $2,900+), this reinforces bullish commodity trends.
Oil Prices: High oil prices (e.g., $90+/barrel) increase mining costs, supporting copper prices but potentially slowing industrial demand.
Equities: Strong industrial stocks (e.g., mining, EV firms) suggest copper demand; a broader market sell-off could drag prices down.
⭐Market Sentiment Analysis of All Types of Investors⭐
Retail Investors: Likely bullish at $9.70, chasing the trend via ETFs or futures, but prone to panic selling on dips.
Institutional Investors: Hedge funds and banks might be long copper, betting on supply shortages, though some could hedge if overbought signals emerge.
Industrial Users: Manufacturers (e.g., EV makers) might lock in prices via forwards, supporting the market, but high costs could prompt hedging or substitution.
Speculators: High volatility at $9.70 attracts traders; sentiment could turn bearish if momentum fades.
⭐Next Trend Move and Future Trend Prediction⭐
Short-Term: Likely a pullback to $9.20–$9.50 due to overbought conditions (RSI > 70) and profit-taking. Target: $9.30.
Medium-Term:
If supply remains tight and demand grows (e.g., China’s 5% growth goal), prices could test $10.00–$10.50. Target: $10.20.
Long-Term:
Sustained electrification trends might push prices to $11.00+, but economic slowdowns or substitution could cap at $9.00. Target: $10.50 (bullish) or $8.50 (bearish).
⭐Overall Summary Outlook⭐
Current Stance: At $9.70 on March 12, 2025, XCU/USD is in a Long/Bullish phase short-term, driven by strong demand, supply constraints, and a weaker USD. However, the extreme price suggests a Short/Bearish correction is imminent medium-term due to overbought signals and potential demand softening.
Bullish Case: Continued supply disruptions (e.g., Peru/Chile strikes), robust Chinese growth, and green tech demand could push prices toward $10.50–$11.00 long-term.
Bearish Case: Economic slowdown, USD strength, or inventory buildup could trigger a decline to $8.50–$9.00 within 6–12 months.
Recommendation: Hold long positions short-term but prepare for a correction. Watch $9.50 support and $10.00 resistance for trend confirmation.
📌Keep in mind that these factors can change rapidly, and it's essential to stay up-to-date with market developments and adjust your analysis accordingly.
⚠️Trading Alert : News Releases and Position Management 📰 🗞️ 🚫🚏
As a reminder, news releases can have a significant impact on market prices and volatility. To minimize potential losses and protect your running positions,
we recommend the following:
Avoid taking new trades during news releases
Use trailing stop-loss orders to protect your running positions and lock in profits
💖Supporting our robbery plan 💥Hit the Boost Button💥 will enable us to effortlessly make and steal money 💰💵. Boost the strength of our robbery team. Every day in this market make money with ease by using the Thief Trading Style.🏆💪🤝❤️🎉🚀
I'll see you soon with another heist plan, so stay tuned 🤑🐱👤🤗🤩

GOLD SILVER PLATINUM COPPER: Metals Are Bullish! Wait For Buys!This is a FUTURES market outlook for the Metals, for the week of March 24-28th.
In this video, we will analyze the following markets:
GC | Gold
SIL | Silver
PL | Platinum
HG | Copper
The USD continues its bearish ways this upcoming weak. It's currency counterparts will likely see some upside this week. Especially the JPY.
Patience and an ear to the news will be the best way to approach the equity markets. The same would also apply to news sensitive commodity markets like US OIL, Gold and Silver.
Enjoy!
May profits be upon you.
Leave any questions or comments in the comment section.
I appreciate any feedback from my viewers!
Like and/or subscribe if you want more accurate analysis.
Thank you so much!
Disclaimer:
I do not provide personal investment advice and I am not a qualified licensed investment advisor.
All information found here, including any ideas, opinions, views, predictions, forecasts, commentaries, suggestions, expressed or implied herein, are for informational, entertainment or educational purposes only and should not be construed as personal investment advice. While the information provided is believed to be accurate, it may include errors or inaccuracies.
I will not and cannot be held liable for any actions you take as a result of anything you read here.
Conduct your own due diligence, or consult a licensed financial advisor or broker before making any and all investment decisions. Any investments, trades, speculations, or decisions made on the basis of any information found on this channel, expressed or implied herein, are committed at your own risk, financial or otherwise.

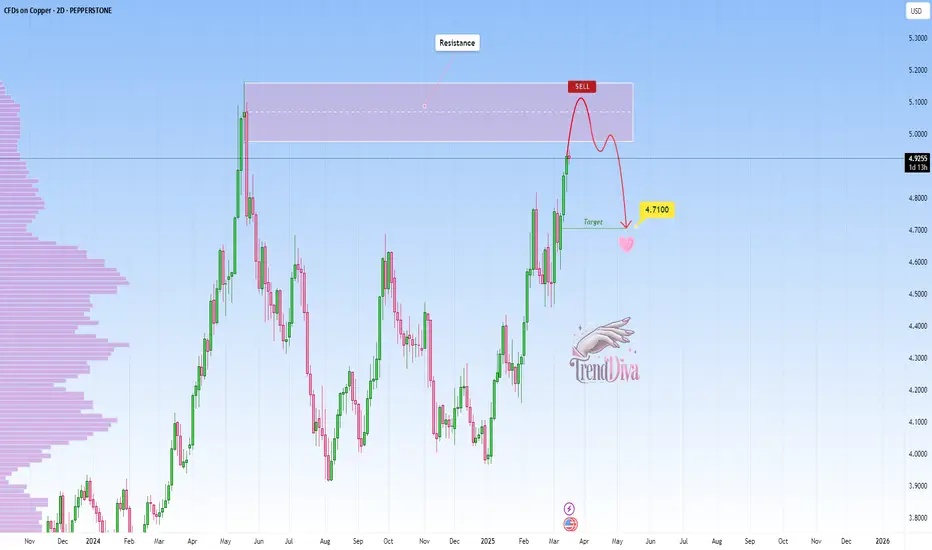
COPPER Approaching Key Resistance — Potential Sell SetupPEPPERSTONE:COPPER is approaching a significant resistance zone, highlighted by previous price reactions and strong selling interest. This area has previously acted as a key supply zone, increasing the likelihood of a bearish reversal if sellers step in.
The current market structure suggests that if the price confirms resistance within this zone, we could see a pullback toward the 4.7100 level, a logical target based on previous price behavior and current market structure. However, a clear breakout above this resistance could challenge the bearish outlook and open the door for further upside. It's a pivotal area where price action will likely provide clearer clues on the next direction.
Just my take on support and resistance zones—not financial advice. Always confirm your setups and trade with solid risk management.
Best of luck!
XCU/USD "The Copper vs US Dollar" Metal Market Heist Plan🌟Hi! Hola! Ola! Bonjour! Hallo!🌟
Dear Money Makers & Robbers, 🤑 💰
Based on 🔥Thief Trading style technical and fundamental analysis🔥, here is our master plan to heist the XCU/USD "The Copper vs US Dollar" Metal market. Please adhere to the strategy I've outlined in the chart, which emphasizes long entry. Our aim is the high-risk Red Zone. Risky level, overbought market, consolidation, trend reversal, trap at the level where traders and bearish robbers are stronger. Be wealthy and safe trade.💪🏆🎉
Entry 📈 : You can enter a Bull trade after the market pullback,
however I advise placing Buy limit orders within a 15 or 30 minute timeframe. Entry from the most recent or closest low or high level should be in retest.
Stop Loss 🛑: Using the 4H period, the recent / nearest low or high level.
Goal 🎯: 9500.00 (or) Escape Before the Target
Scalpers, take note 👀 : only scalp on the Long side. If you have a lot of money, you can go straight away; if not, you can join swing traders and carry out the robbery plan. Use trailing SL to safeguard your money 💰.
Warning⚠️ : Our heist strategy is incompatible with Fundamental Analysis news 📰 🗞️. We'll wreck our plan by smashing the Stop Loss 🚫🚏. Avoid entering the market right after the news release.
Fundamental Outlook 📰🗞️
The XCU/USD (Copper) is expected to move in a bullish direction.
REASONS FOR BULLISH TREND:
Increasing Demand: The demand for copper is expected to increase due to the growing demand for electric vehicles, renewable energy systems, and other industrial applications.
Supply Constraints: The supply of copper is expected to be constrained due to production disruptions, mine closures, and declining ore grades.
China's Economic Growth: China's economic growth is expected to continue, which will drive up the demand for copper and other industrial metals.
Infrastructure Spending: The US and other countries are expected to increase their infrastructure spending, which will drive up the demand for copper and other construction materials.
Low Inventory Levels: The inventory levels of copper are currently low, which will lead to an increase in prices as demand increases.
Strong Export Demand: The export demand for copper is expected to remain strong, driven by demand from countries such as China, India, and South Korea.
Production Costs: The production costs for copper are expected to increase due to higher costs for inputs such as energy, labor, and equipment.
Government Policies: The government policies in countries such as Chile and Peru are expected to support the copper mining industry, which will lead to an increase in production and higher prices.
UPCOMING FUNDAMENTAL ANALYSIS:
US GDP Growth: The upcoming US GDP growth report is expected to show a strong economy, which could support copper demand and prices.
China's Economic Data: China's economic data, including GDP growth and industrial production, is expected to show a recovery, which could support copper demand and prices.
Copper Inventories: The upcoming copper inventory report is expected to show a decline in inventories, which could support copper prices.
Mining Production: The upcoming mining production report is expected to show a decline in production, which could support copper prices.
MARKET SENTIMENT:
Bullish Sentiment: 60%
Bearish Sentiment: 30%
Neutral Sentiment: 10%
Please note that this is a general analysis and not personalized investment advice. It's essential to consider your own risk tolerance and market analysis before making any investment decisions.
Keep in mind that these factors can change rapidly, and it's essential to stay up-to-date with market developments and adjust your analysis accordingly.
💖Supporting our robbery plan will enable us to effortlessly make and steal money 💰💵 Tell your friends, Colleagues and family to follow, like, and share. Boost the strength of our robbery team. Every day in this market make money with ease by using the Thief Trading Style.🏆💪🤝❤️🎉🚀
I'll see you soon with another heist plan, so stay tuned 🫂

COPPER | XCUUSD | HG1! Weekly Forecast: Bearish to the Lows!There is significant Sell Side Liquidity at the lows of this market. This will draw price to it.
Look for price to potentially trade into and drop from the Weekly -FVG.
Should be some significant opportunities this coming week.
Enjoy!
May profits be upon you.
Leave any questions or comments in the comment section.
I appreciate any feedback from my viewers!
Like and/or subscribe if you want more accurate analysis.
Thank you so much!
Disclaimer:
I do not provide personal investment advice and I am not a qualified licensed investment advisor.
All information found here, including any ideas, opinions, views, predictions, forecasts, commentaries, suggestions, expressed or implied herein, are for informational, entertainment or educational purposes only and should not be construed as personal investment advice. While the information provided is believed to be accurate, it may include errors or inaccuracies.
I will not and cannot be held liable for any actions you take as a result of anything you read here.
Conduct your own due diligence, or consult a licensed financial advisor or broker before making any and all investment decisions. Any investments, trades, speculations, or decisions made on the basis of any information found on this channel, expressed or implied herein, are committed at your own risk, financial or otherwise.

XCU / USD "COPPER" Market Heist Plan on Bullish SideHello!! My Dear Robbers / Money Makers & Losers, 🤑 💰
This is our master plan to Heist XCU / USD "COPPER" Market based on Thief Trading style Technical Analysis.. kindly please follow the plan I have mentioned in the chart focus on Long entry. Our target is Red Zone that is High risk Dangerous level, market is overbought / Consolidation / Trend Reversal / Trap at the level Bearish Robbers / Traders gain the strength. Be safe and be careful and Be rich.
Entry 📈 : Can be taken Anywhere, What I suggest you to Place Buy Limit Orders in 15mins Timeframe Recent / Nearest Low Point take entry should be in pullback.
Stop Loss 🛑 : Recent Swing Low using 2H timeframe
Attention for Scalpers : Focus to scalp only on Long side, If you've got a lot of money you can get out right away otherwise you can join with a swing trade robbers and continue the heist plan, Use Trailing SL to protect our money 💰.
Warning : Fundamental Analysis news 📰 🗞️ comes against our robbery plan. our plan will be ruined smash the Stop Loss 🚫🚏. Don't Enter the market at the news update.
Loot and escape on the target 🎯 Swing Traders Plz Book the partial sum of money and wait for next breakout of dynamic level / Order block, Once it is cleared we can continue our heist plan to next new target.
💖Support our Robbery plan we can easily make money & take money 💰💵 Follow, Like & Share with your friends and Lovers. Make our Robbery Team Very Strong Join Ur hands with US. Loot Everything in this market everyday make money easily with Thief Trading Style.
Stay tuned with me and see you again with another Heist Plan..... 🫂

XCU/USD "COPPER" Market Money Heist Plan on Bullish SideHallo! My Dear Robbers / Money Makers & Losers, 🤑 💰
This is our master plan to Heist XCU/USD "COPPER" Market Market based on Thief Trading style Technical Analysis.. kindly please follow the plan I have mentioned in the chart focus on Long entry. Our target is Red Zone that is High risk Dangerous level, market is overbought / Consolidation / Trend Reversal / Trap at the level Bearish Robbers / Traders gain the strength. Be safe and be careful and Be rich.
Entry 📈 : Can be taken Anywhere, What I suggest you to Place Buy Limit Orders in 15mins Timeframe Recent / Nearest Low Point take entry in pullback.
Stop Loss 🛑 : Recent Swing Low using 1H timeframe
Attention for Scalpers : Focus to scalp only on Long side, If you've got a lot of money you can get out right away otherwise you can join with a swing trade robbers and continue the heist plan, Use Trailing SL to protect our money 💰.
Warning : Fundamental Analysis news 📰 🗞️ comes against our robbery plan. our plan will be ruined smash the Stop Loss 🚫🚏. Don't Enter the market at the news update.
Loot and escape on the target 🎯 Swing Traders Plz Book the partial sum of money and wait for next breakout of dynamic level / Order block, Once it is cleared we can continue our heist plan to next new target.
💖Support our Robbery plan we can easily make money & take money 💰💵 Follow, Like & Share with your friends and Lovers. Make our Robbery Team Very Strong Join Ur hands with US. Loot Everything in this market everyday make money easily with Thief Trading Style.
Stay tuned with me and see you again with another Heist Plan..... 🫂

COPPER 📊 #XCUUSD
⏱ TIME: 1D
📝Technically and fundamentally, it is a very good place and the position has little risk
⭕️risk: low
📍The initial buying market around: 3.98
📌TP1: 4.086 $
📌TP2: 4.175 $
📌TP3: 4.298 $
📌TP4: 4.408 $
⛔️SL: 3.86 $
❌These analyzes are just to give a better perspective for you dear ones
Do not base on buying and selling❌

COPPER signaling the start of rate cuts? Potential danger ahead.Copper (HG1!) completed two straight red months following May's High at the top of the 3-year Rising Wedge pattern. Last time the commodity formed this pattern was back from May 2006 to September 2008. In fact the recent May 2024 Higher High resembles that of May 2008, whose rejection broke the Rising Wedge downwards.
As you can see, during both patterns, the US10Y (orange trend-line) stopped rising and turned sideways on Lower Highs, while the U.S. Interest Rate had peaked and started falling.
What 2006 - 2008 suggests, is that possible rate cuts may be ahead of us, pragmatically the markets have already priced this to a large percentage in September. But at the same time, it highlights the danger of a market-wide collapse, as the first month after the September 2007 rate cut, the stock markets peaked and the U.S. Housing Crisis begun.
What could be different this time and avert a new financial crisis of such proportions is that the stock markets haven't shown any signs of correcting yet. As a result, potential rate cuts may have a mostly positive bullish continuation effect as post July 2019.
What do you think will happen next? Bullish continuation or new Bear Market?
-------------------------------------------------------------------------------
** Please LIKE 👍, FOLLOW ✅, SHARE 🙌 and COMMENT ✍ if you enjoy this idea! Also share your ideas and charts in the comments section below! This is best way to keep it relevant, support us, keep the content here free and allow the idea to reach as many people as possible. **
-------------------------------------------------------------------------------
💸💸💸💸💸💸
👇 👇 👇 👇 👇 👇

Copper Prices on the Rise - Do Your Research Before You T
Copper prices have recently reached a 14-month high, driven in part by China's economic improvement. This could be a potential trading opportunity, but it's important to be well-informed before making any decisions.
Copper is a key economic indicator, and its demand is expected to rise. However, the market can be volatile.
Here are some resources to help you make informed decisions:
• Copper price charts and analysis
• Information on copper trading risks
Remember, successful trading requires research, understanding your risk tolerance, and aligning your strategy with your goals

XCUUSD ( COPPER / USD ) Commodities Analysis 29/08/2022Fundamental Analysis:
as of now we can see the global inflation has rise sky rocket and the worlds economy is in a huge bobble which soon will explode and a catastrophic crisis may occur, ultimately most of the manufacturing and development plants which are dependent on the base commodities such as Copper and gold may face some market crises and demand may plummet to a very critically low levels, consequently a lots of the retail and small entities producer and manufacturers will hit the bottom line and bankruptcies if their exposure is not hedged or planned their business strategies accordingly for these days.
one of the main reason for this incident can be the changing of the world order and power pole transformation from west to the middle east and far east, Russia's conflicts with Europe and china's with south china's sea and Taiwan.
food shortage and probably real state collapse could be predicted and can be a good cause of such a market fall.
energy crisis and fuel price jump can be another good reason to decrease the equity and profit margin in the manufacturing and production segments.
Technical Analysis:
There exist a bearish Divergence of Price and MACD followed with some market fall from its ATH which means bullish trend Reversal and we are facing more falls and a bearish Market, using Fibonacci Retracement levels we have defined some Target Levels which are having confluences with different cycle Fib Levels.
we have defined some Resistance levels using Fibonacci and Price Action.
we may have some Bullish price correction on the way of the bearish trend.
There are total of 4 targets defined using the confluences of Different Fibonacci and Price action levels and they can be considered as strong support levels if not Broken sharply

Copper remains positive.XCUUSD - 24h expiry - We look to Buy at 3.851 (stop at 3.811)
Our short term bias remains positive.
The sequence for trading is higher highs and lows.
A lower correction is expected.
We look to buy dips.
50 4hour EMA is at 3.846.
Our profit targets will be 3.951 and 3.971
Resistance: 3.900 / 3.914 / 3.930
Support: 3.875 / 3.860 / 3.835
Please be advised that the information presented on TradingView is provided to Vantage (‘Vantage Global Limited’, ‘we’) by a third-party provider (‘Signal Centre’). Please be reminded that you are solely responsible for the trading decisions on your account. There is a very high degree of risk involved in trading. Any information and/or content is intended entirely for research, educational and informational purposes only and does not constitute investment or consultation advice or investment strategy. The information is not tailored to the investment needs of any specific person and therefore does not involve a consideration of any of the investment objectives, financial situation or needs of any viewer that may receive it. Kindly also note that past performance is not a reliable indicator of future results. Actual results may differ materially from those anticipated in forward-looking or past performance statements. We assume no liability as to the accuracy or completeness of any of the information and/or content provided herein and the Company cannot be held responsible for any omission, mistake nor for any loss or damage including without limitation to any loss of profit which may arise from reliance on any information supplied by Signal Centre.

COPPER Supply And Demand Short Trade Idea-Trend = uptrend
-Price reacting off of supply
-Price reacting off of resistance
-Any shorts will be counter-trend
and requires some sort of confirmation +
smaller risk + quicker trade management.

XCUUSD - Copper Demands On The Decline?Analysis:
Looking at the technicals on Copper we can see a clear downwards trend. Price is forming lower lows and lower highs which confirms that we are in a downwards trend. Price has also been respecting a downwards trendline which again shows us that we are in a downwards trend. We're currently sat at an area that we're interested in as price has held this area multiple times in the past so we expect that it will again. To give us more confidence with this setup, at our area we also have the 50% fib retracement level which we suspect bears will be wanting to hold and push price to the downside which favours our idea. We've also got the downwards trendline close by which if price reaches we'd expect to hold and to further help push price to the downside as bears will be waiting at this area. Fundamentally the USD is gaining a lot of strength in recent times and it continues to, until we see this change we are bullish on the USD, so this goes with our idea. Copper demands have decreased recently meaning that Copper prices will decrease. Comparing the decreasing demand for Copper against the strengthening USD it's clear to see that we want to be shorting this pair which is why we have a short bias.
Please feel free to leave any comments you have and like this idea if you agree with us. Any feedback or comments will be read. We appreciate it all.
Stay Safe - JPI
Disclaimer:
This does not constitute as financial advise. We are not responsible for any monetary loss that you endure. Trading is hard to be profitable with and we take losses just like everyone else does to. Our ideas won't always be correct which is why we urge you to always do your own analysis first before entering into the market but please feel free to use our analysis to assist you with yours.

Will Copper find sellers at previous support?XCUUSD - 24he expiry - We look to Sell at 3.828 (stop at 3.868)
Our bespoke support of 3.820 has been clearly broken.
Our short term bias remains negative.
Previous support, now becomes resistance at 3.820.
Preferred trade is to sell into rallies.
We look for a temporary move higher. A lower correction is expected.
Our profit targets will be 3.728 and 3.708
Resistance: 3.744 / 3.770 / 3.820
Support: 3.700 / 3.671 / 3.640
Please be advised that the information presented on TradingView is provided to Vantage (‘Vantage Global Limited’, ‘we’) by a third-party provider (‘Signal Centre’). Please be reminded that you are solely responsible for the trading decisions on your account. There is a very high degree of risk involved in trading. Any information and/or content is intended entirely for research, educational and informational purposes only and does not constitute investment or consultation advice or investment strategy. The information is not tailored to the investment needs of any specific person and therefore does not involve a consideration of any of the investment objectives, financial situation or needs of any viewer that may receive it. Kindly also note that past performance is not a reliable indicator of future results. Actual results may differ materially from those anticipated in forward-looking or past performance statements. We assume no liability as to the accuracy or completeness of any of the information and/or content provided herein and the Company cannot be held responsible for any omission, mistake nor for any loss or damage including without limitation to any loss of profit which may arise from reliance on any information supplied by Signal Centre.

Copper - Weakest metal- pt.2As per previous post, , we are shorting copper from 413, since we believe wave B as been completed at 435, creating a bearish wolfe wave pattern, and a wave C to the downside is beginning to unfold.
Our stop loss is on entry and the tp is at the wolfe wave target line at 364.
