quantized pin bar indicator with ATRAbstract
This script computes the strength of pin bars.
This script uses the corrent and the previous two bars to compute the strength of pin bars.
The strength of pin bars can be also comared with average true range, so we can evaluate those pin bars are strong or weak.
Introduction
Pin bar is a popular price action trading strategy.
It is based on quick price rejection.
Most of existing pin bar scripts only determine if a bar is a pin bar or not.
However, evaluating the strength of pin bars is important.
If price rejection is too weak, it is difficult to trigger trend reversal.
If a pin bar is too strong, we may enter the trade too late and cannot have good profit.
In this script, it provides a method to compute to strength of pin bars.
After the strength of pin bars are quantized, they can compare with average true range, price range and trend strength, which can help us to determine where are worthy for us to open trades.
Computation
Bullish hammer : current low is lower than ( previous high or current open ) and current close.
Bearish gravestone : current high is higher than ( previous low or current open ) and current close.
Bullish engulfing and harami : ( current low or previous low ) is lower than ( previous 2nd high or previous open ) and current close.
Bearish engulfing and harami : ( current high or previous high ) is higher than ( previous 2nd low or previous open ) and current close.
Parameters
Smoothing : the type of computing average.
Length of ATR : determines the number of true ranges for computing average true range.
ATR multiplier line : the threshould that a pin bar is strong enough. For example, if this value is 0.5, it means a pin bar with 0.5*atr or more is considered a strong pin bar.
one direction pinbar : set to 1 if you want the strength of bullish pin bars and bearish pin bars are cancelled. Set to 0 if you want to keep both strength of bullish pin bars and bearish pin bars; in this case, you may need to change the plot style to make both strength visible.
Trading Suggestions
Evaluate the strength of trend against pin bars. After all, a single reverse pin bar may be too weak to reverse the trend.
Timeframe : if atr is higher than 4*spread, the timeframe is high enough. However, if strong pin bars appear too frequent or price range is too small, going to higher fimeframe may be more safe.
Entry and exit : according to personal flavors.
Conclusion
The strength of pin bars can be quantized.
With this indicator, we can find more potential pin bars which human eyes and binary pattern detectors were leaked.
In my opinion, 0.5*atr is the most suitable streng of a pin bar for my trade entry but I still need to consider the direction of the trend.
You are welcome to share your settings and related trading strategy.
References
Most of related knowledge can be searched from the internet.
I cannot say the exact references because they may violate the rules of Tradingview.
ATR

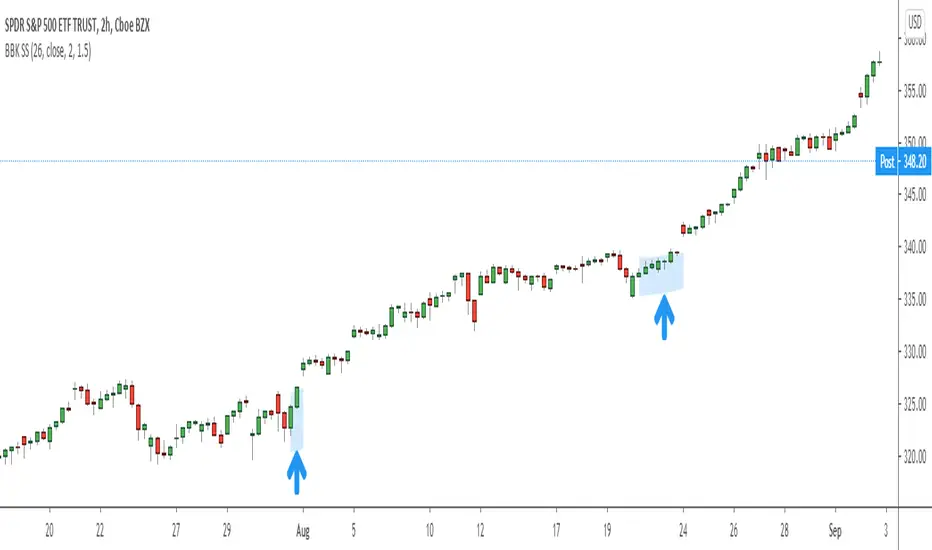
BB Keltner Squeeze Signal 1.0Made this to signal when the criteria is met for a "Bollinger Band + Keltner Channel Squeeze" signal. This is when one or both of the Bollinger Bands come inside the Keltner Channel. When this happens the bars are highlighted. The idea of this script is to clean up charts as much as possible.
Bollinger Bands are measures of standard deviation from a simple moving average. This is the distance that price travels as a whole over time. Keltner Channels are a measure of ATR from an exponential moving average. This is the average range of individual bars.
Both indicators measure volatility and when they contract indicate that price is consolidation. A very tight consolidation can often be a prelude to an expansion of volatility and price movement. It can be a signal for a potential breakout or confirmation one will be successful.
The actual Bollinger Bands and Keltner Channels are turned off by default but can be turned on in the script settings. I also use 26 as the default length but it can be changed.
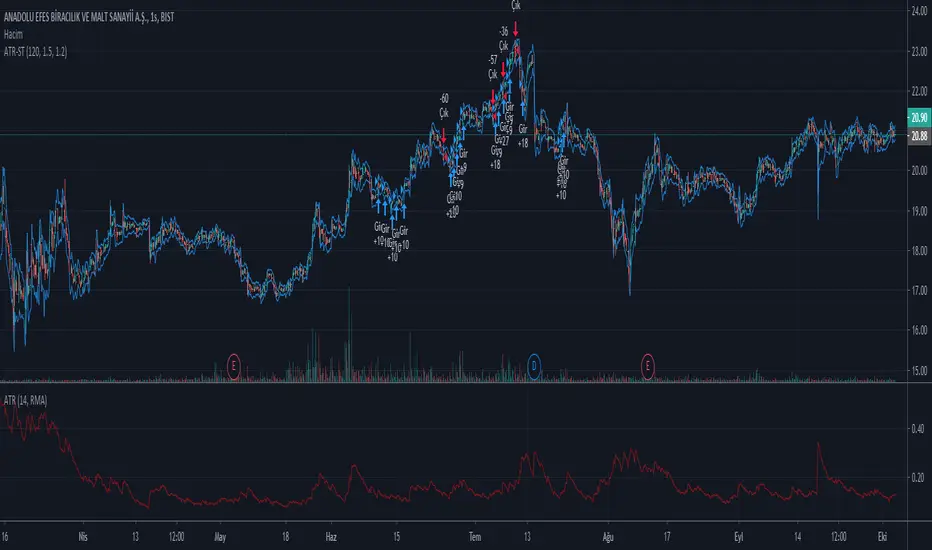
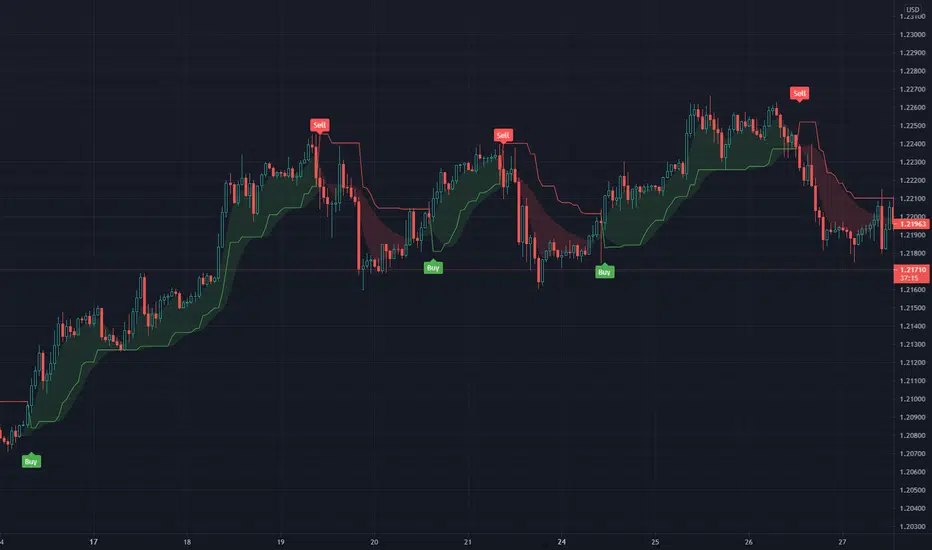
Profit Maximizer PMax Strategy - Long-ShortI developed a different strategy perspective for the Profit Maximizer PMax indicator prepared by Kıvanç Özbilgiç.
When you come to the settings section;
- You will see 2 options as Straregy Type. You can test the price and pmax intersections as different strategies.
- I added the Long-Short option for spot traders to calculate the profitability rate correctly. Spot traders should not choose this option.
Here you can set alarms on the original indicator with the parameters you find successful.
Türkçe:
Kıvanç Özbilgiç tarafından hazırlanan Profit Maximizer PMax indikatör için farklı bir strateji bakış açısı geliştirdim.
Ayarlar bölümüne geldiğinizde;
- Straregy Type olarak 2 seçenek göreceksiniz. Fiyat kesişimi ve pmax kesişimlerini, farklı stratejiler olarak test edebilirsiniz.
- Spot işlem yapanlar için karlılık oranını doğru hesaplayabilmeleri için Long-Short seçeneği ekledim. Spot işlem yapanların bu seçeneği seçmemeleri gerekmektedir.
Burada başarılı bulduğunuz parametreler ile orijinal indikatör üzerinde alarmlar kurabilirsiniz.

Daily Average True RangeIf you want to get an idea if the current range (low to high) is extended or not?
This script should help you to get an idea relative to the ATR.
Further comments you find in the script.
Feel free to modify upon your needs.
Jonas
NB: Due to issues around the "security" function, the recommended patch of Trading View was implemented.

ATR Daily LevelsPlots the daily ATR on the chart as upper and lower levels.
It can be use to adapt your trading in high and low periods of market volatility, determine reasonable target or take profit, entry at likely mean reversion, stop loss beyond normal flows etc...
More on the script behavior:
- Daily ATR upper/lower levels are applied on the current day low/high;
- The ATR value is defined by the last D1 bar;
- Shows up to D1 timeframe;
- Configuration for the indicator's period (default: 20 period ATR);
- Configuration for plotting the indicator on the the x axis with an offset/at begining of the day (default: offset);

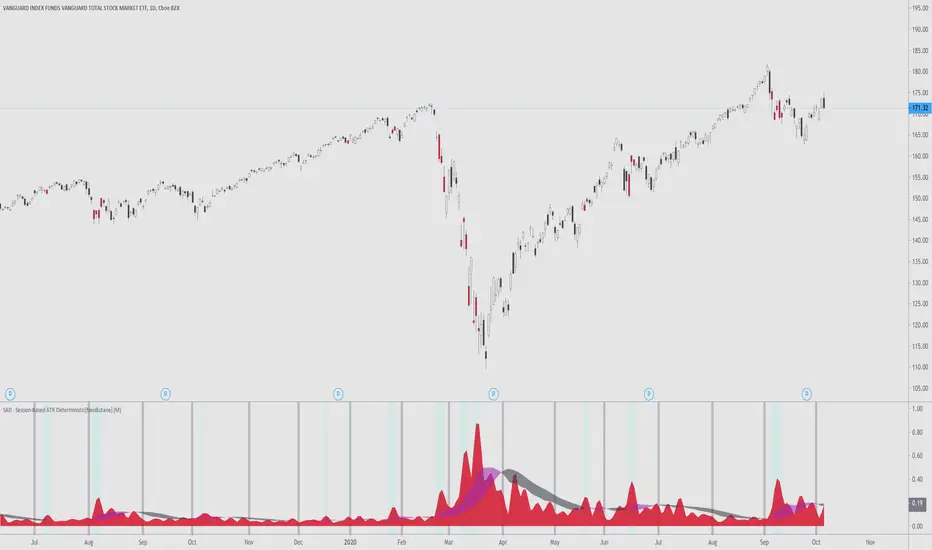
SAD - Session-Based ATR Deterministic[NeoButane]SAD - ATR with a utility tune-up.
Similar to ATR, SAD finds the true range of an asset. Unlike ATR, which is a rolling indicator, SAD is session based, simliar to VWAP. This gives it a great advantage over a regular ATR, where one must determine if their ATR level is statistically significant or not. SAD makes it easy for you to analyze statistical anomalies without having to pull out a calculator.
By breaking up ATR in sessions, it is able to be determined when price has moved an abnormal amount in a session deterministically. Noise is removed by a moving average filter, the weighted moving average. This was chosen over the EMA?SMA because an EMA would be to quick to change and the SMA would be too slow.
The ribbon's colors, purple, is active when volatility is rising. It is black when volatility is falling. You can see that this is directionally neutral.
Options to configure:
Timeframe
Ribbon dipslay
Session break display
[*}Bar coloring
Common examples of usage:
If you want to use this indicator, add it to your favorites and you can find it there.
ATR Stop Buy StrategyThis strategy trial is let you to giving sell and buy orders with ATR (average true range) and an coefficent for them. it is my first strategy work, needs to be upgraded. USE IT WITH YOUR OWN RISK. IT IS NOT EVEN GUARANTEED TO WORK.
2 Candles Inside ATR2 agitated candles falling inside ATR range, awaiting possibly a big move.
Buy / Sell signals at combined high / low can be used as order with other as stop loss.
Counter trade, when this minimal stop loss is hit, is also as useful. However, wait till the SL candle closes, before opening position on the other side.
Works quite well on 15 mins chart, with settings of ATR duration 25 and multiplier 0.6. These settings are configurable, so feel free.

Realtime ATR Based TP-SL by KAANCThe indicator indicating ATR-based Stop Loss and Take Profit values, which I made inspired by the videos of Okan Yorgancı.
You can set the SL ATR value and TP ATR value from the settings.
----
Okan Yorgancı'nın videolarından esinlenerek yaptığım ATR tabanlı Stop Loss ve Take Profit değerlerini belirten indikatör.
Ayarlardan SL ATR değeri ve TP ATR değerini belirleyebilirsiniz.

ATR Stop Loss IndicatorIt’s very simple – all it does is calculate your stop loss with trailing stop price.
How It Works
Blue is the current ATR (pips).
Green is your trailing stop-loss price for Long
Red is your trailing stop-loss price for Short .
Settings
ATR Length:
Your ATR Length
Multiplier:
ATR multiplier.
For example, if you want to use a 2x ATR stop, set to 2.
ATR color zones with volume radar [LM]Hello Guys,
I would like to introduce you the ATR color zones with volume radar indicator. It's a fork of @GlobalMarketSignals "GMS: Mr. Yen's Color Zone" shout-out to him.
I have enriched it -> that zones are calculated based on the ATR and percentages as described below and volume radar on candle bars. You can select from which timeframe color zones are calculated.
Zones:
white line is the previous period close
red zone = +/- 20% ATR of previous period
yellow zone = +/- 40% ATR of previous period
green zone = +/- 60% ATR of previous period
blue zone = +/- 100% ATR of previous period
Volume radar:
lime = above volume MA average multiplied by multiplier up bar
maroon = above volume MA average multiplied by multiplier down bar
black = volume is decreasing but is not below half of volume MA
navy = volume is decreasing and is below half of volume MA
markers are shown when volume is increasing two consecutive candle in row in direction of the candle
Any suggestions are welcomed

Ichimoku Kinko Hyo Strategy+ EMA + 3ATRThis trading strategy uses combination of the Ichimoku Kinko Hyo system with Fibonacci numbers based 13/21/55 exponential moving average ( EMA ) crossover, giving good results in various trending assets !
Also has the Trend-following indicator combining SuperTrend with Chiku breakout from Ichimoku is added in order to confirm trend pattern.
The Ichimoku Kinko Hyo system includes five kinds of signal, of which this strategy uses the most recent of ones i.e. Tenkan Sen / Kijun Sen Cross and price crosses the Kijun Sen. As the Chikou Span, Senkou Span A and Senkou Span B are shifted into the past/future.
The Tenkan Sen, also known as the Turning or Conversion line, is a moving average of the highest high and lowest low over the last 9 periods in this strategy.
The Kijun Sen, also known as the Standard or Base line, is a moving average of the highest high and lowest low over the last 26 periods in this strategy.
The Chikou Span, also known as the Lagging line, is the closing price plotted 26 periods behind in this strategy.
The Senkou Span A, also known as the 1st leading line, is a moving average of the Tenkan Sen and Kijun Sen and is plotted 26 periods ahead in this strategy.
The Senkou Span B, also known as the 2nd leading line, is a moving average of the highest high and lowest low over the last 52 trading days is plotted 26 periods ahead in this strategy.
EMA is quicker to react to the current market price is because EMA gives more importance to the most recent data points. This helps the trader to take quicker trading decisions. Just used the laws of nature for EMA numbers: taken from Fibonacci sequence numbers 13/21/55
A SuperTrend employs ATR values to calculate the indicator values. The SuperTrend indicator combined with Chiku breakout from Ichimoku and plotted. The indicator line changes its color between green and red based on the price momentum in the underlying.
Multi Time Frame - Trend AnalysisMuti Time Frame - Trend Analysis
How does it work ? Price movements over range of period is to compute the trend forward.
This script used SuperTrend (ST) , ATR and RSI to determine the trend and direction so that a buy sell decision can be made
To Indicate the strength of the trendline , RSI is computed over multiple timeframes and then used to in sync with SuperTrend to help determine the direction
The user can customise the RSI strength validation. So one the Super Trend and ATR Levels are matched , the RSI is validated before giving a BUY/SELL suggestion
Best Time Frames to use : Upto 15/30 Mins if using RSI based logic , user can use higher timeframe if the goal is to identify the trend and the use lower time frame to determine Buy/Sell
Where to use
Trend Indicator using Multi Time Frame Analysis to suggest a long or a short
The main use of this indicator is quick scalping and Intra-day trading.
The Indicator shows the option to show the Trend Zone and Buy/Sell Signals which the use can on or off
How to use
User Choices : To avoid false positives we have introduced a double check using RSI ,
it is defaulted to 60/ 40 - the users are free to change it as per their preferences
The system will not suggest a trade when the the counter in beyond the RSI limits
Stop Loss - That should be done by following ones risk appetite , Ideally the open/close of the previous candle should be the stop loss for the buy/sell
but everyone has their own Risk Management Strategies based on the capital deployed.
Disclaimer : There could be scenarios when the candle is shown as a long or short and then the candle turns into opposite direction red/green .
In such scenarios , Please refer to the just preceding candle and if this candle is moving into positive direction (forming green candle) only then buy ,
Similarly Sell/Short only if this candle is forming a red candle
How to get access
Please click on the link / email in the signature or send me a private message to get access
Feedback
Please click on the link/email in the signature or send me a private message for suggestions/feedbacks
ATR + PSAR Trailing Stop (Expo)This ATR + PSAR Trailing Stop indicator is unique. It comes with new ways of calculating ATR and PSAR to enhance performance and accuracy as well as give clarity in trends. The indicator can be used standalone or as a part of your current trading strategy.
ATR + PSAR Trailing Stop (Expo) is a trailing stop indicator that combines ATR and PSAR to enhance the calculation of the trailing stop. This indicator works well in all types of markets, for example, in a trading range or in a trending market, etc.
The user can choose between the following ATR Settings:
Quick ATR
Adaptive ATR
Follow the price closely - ATR
Standard ATR
Trend ATR
The user can enable Trend ATR which displays the overall market structure. If the Trend ATR line is above the price we have a negative market structure, and if the Trend ATR line is below the price we have a positive market structure.
Real-time
No repainting
Works on any market and in any timeframe
HOW TO USE
- Use the ATR + PSAR Trailing Stop as a stop-loss.
- Use the indicator for taking a position when price crosses the ATR trailing line or taking a position when price crosses the PSAR circles.
- Use the indicator to identify the current market structure and trend.
The indicator can be used standalone or as a part of your current trading strategy.
INDICATOR IN ACTION
1-hour chart
I hope you find this indicator useful , and please comment or contact me if you like the script or have any questions/suggestions for future improvements. Thanks!
I will continually work on this indicator, so please share your experience and feedback as it will enable me to make even better improvements. Thanks to everyone that has already contacted me regarding my scripts. Your feedback is valuable for future developments!
-----------------
Disclaimer
Copyright by Zeiierman.
The information contained in my scripts/indicators/ideas does not constitute financial advice or a solicitation to buy or sell any securities of any type. I will not accept liability for any loss or damage, including without limitation any loss of profit, which may arise directly or indirectly from the use of or reliance on such information.
All investments involve risk, and the past performance of a security, industry, sector, market, financial product, trading strategy, or individual’s trading does not guarantee future results or returns. Investors are fully responsible for any investment decisions they make. Such decisions should be based solely on an evaluation of their financial circumstances, investment objectives, risk tolerance, and liquidity needs.
My scripts/indicators/ideas are only for educational purposes!
ACCESS THE INDICATOR
• Contact me on TradingView or use the links below
CC - ATP (Auto-Trendline Projection)I created this script with a simple goal in mind: Automatically plot trend-lines for a given interval with a resolution that fits the period chosen.
To accomplish this I used a combination of the following:
Ichimoku Spans and Ichimoku Span Width.
ATR and standard deviation from the ATR of the Ichimoku width.
Rolling MACD with directional RSI for coloration based on acceleration.
I then combined all of these pieces of data into a single label and line plotter, so that you can see the assumed trend-lines for the current period based on the interval selected. It attempts to avoid using look-ahead logic by resolving using security, and plotting based on the suggested methodologies.
Inputs:
n (this must be the smallest number). - This is usually 7,14 or 26 depending on the resolution you're going for.
m (must be m > n and m < o). - This is usually something close to 14,26 or 52.
o (must be o > m and o < p). - This is usually something close to 26,52 or 180.
p (must be p > o). - This is usually just o * 2 or 52, 180 or 360.
Show historical data - Keeps some of the lagging trend-lines at intervals of m, o and p.
Precision - The decimal precision to round to, useful if you need this for BTC or penny stocks.
Common Inputs I use:
n=7, m=14, o=26, p=52
n=14, m=26, o=52, p=180
n=26, m=52, o=180, p=360
You can use any numbers, but roughly you want:
m = n*2, o = m*2, p = o*2.
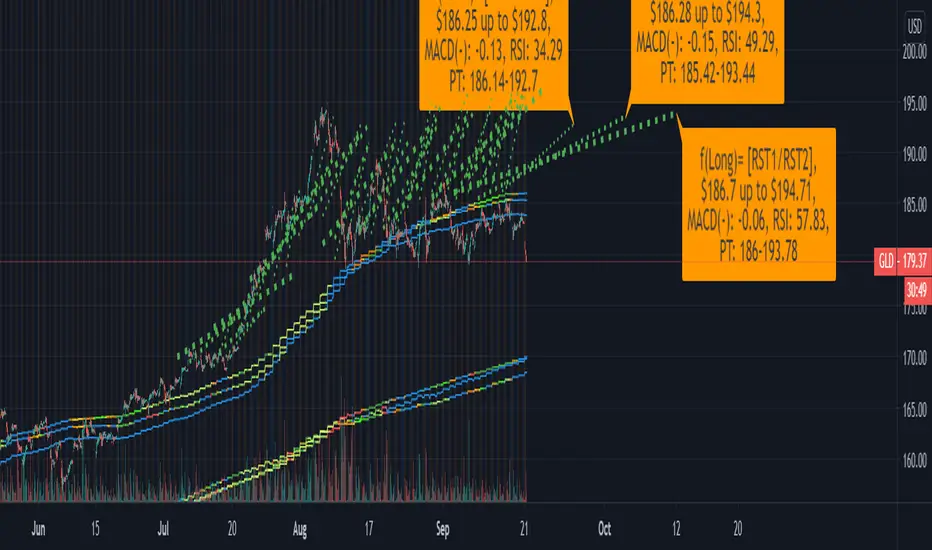
The labels contain the following information:
Expected Support/Resistance levels
The first level is assumed to be heading to the second level.
For instance, if you have S1 down to R2, that means a support is likely to become a resist.
If you have, instead, R1 up to R2 that means the resistance is moving up, but is still resist.
S1 down to S2 is similar in that it means the support level is moving lower but is still sup.
R1 up to S2 is the one that you want to look for as it indicates potential swings.
More-overly, R1-->S2 or S1-->R1 indicate pivotal moments.
MACD / RSI for the given period.
Pretty simple, it's given to the number of decimal places offered by the inputs.
Price Targets.
If it's above the price target area, that means the swing already probably happened.
If it's in the price target area, you're at a pivotal moment; it could go up or down.
If you're below the price target area, watch for catalysts that force price target entry.
WARNING:
Please note, all of this is trend analysis and can be completely demolished in an instant by a catalyst. If there is a huge retracement event, you MUST WAIT A MINIMUM OF THE INPUT PERIOD OF TIME FOR THE STOCK TO SETTLE. If you have a retracement within n-m periods for instance, the short data will be inaccurate. If you have a retracement from m-o the mid data may be inaccurate until it triggers retracement. Same with o-p on the long level. The higher numbers you use, the less reactive the script, but the more historical data it will consume. For instance high numbers may be good for amazon, so you have less reaction to big dips, as you are not afraid because it is a strong company. While this is good on strong companies, it is suicidal for unknown ones.
DISCLAIMER:
I do NOT state anywhere that the data provided by this indicator is valid, forward looking, or guaranteed. If you make a trade based on this indicator I am in no way responsible for the outcome. All trades should be backed by personal due diligence and not rely directly on the indicators of others, as they may contain unfound bugs, incorrect math or look-ahead logic that is potentially dangerous. One final disclaimer, I am a programmer at heart, and am new to this field of study. While I have found a group of supportive friends, do realize I have been at this for less time than most others, more notably I started on 8/16/2020. Please shower me with constructive criticism and other thoughts you have.
Please take this script and view it as a learning experience not a tool for money as of this moment, if you have further questions about me or my scripts, please feel free to message me.
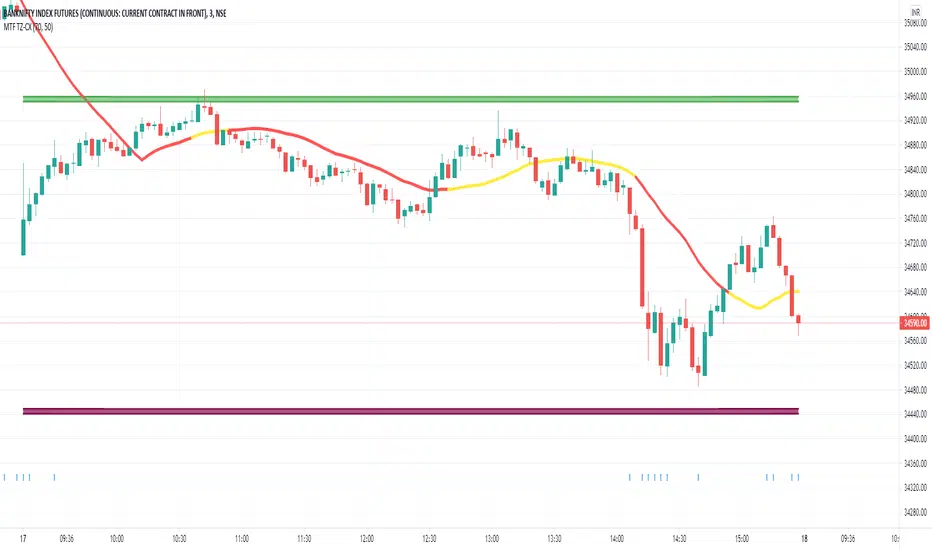
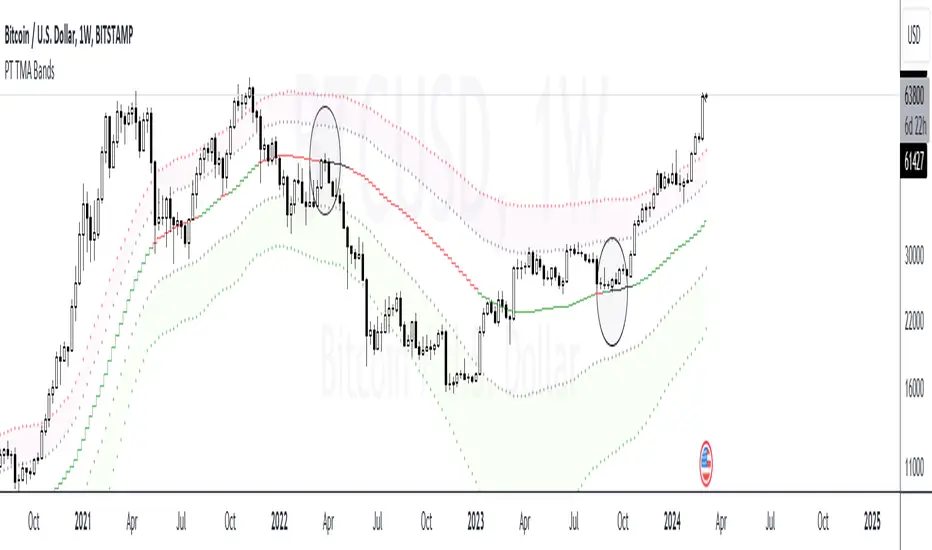
PT TMA BandsVersion 1.0 of our TMA Bands is a visual of areas of interest. The purpose of this indicator is to determine where the price will likely bounce or reject. When an asset is ranging, it very well respects the neutral (middle) zone. The highest RR trade setups are when the price goes from one end of the bands to another.
The bands included are of an ATR multiplier based on multiple moving averages. Each moving average has a unique feature that offers a high probability reaction when price gravitates towards it. We have color-coordinated the bands into three zones. The Main zone being the middle area where the asset tends to play ping pong & range, Top zone, which offers the best RR for shorts & the bottom zone, which provides the best RR for longs.
Strategy:
When scalping or swinging, always look for shorts close to the red zone as possible with a stop loss above the red band. When longing, always look for longs close to the green zone area with a stop loss below the green band. Anything in orange is a neutral zone, which will confirm the asset is more than likely ranging. I don’t advise taking trades in that zone unless you have solid risk management. When playing the macros, H12+ always look for price to find support at the orange (middle) band before deciding on a shift in trend. If the asset breaks down from the orange (middle) band, you usually get a retest of that band before further downside. Also, something to consider, if you punt longs at the green zone, you want to target the orange (middle) band. If you punt shorts at the red zone, you want to target the orange (middle) band. I usually take 70% off at the middle band & let the rest run if ultimately end up in the opposite zone.
This Oscillator is best with the buy/sell signals we provide. It offers extra confluence with stop loss & targets. I enjoy using it on all time frames for swinging & scalping. It is included as part of the library. Just message us for access!
Daily Average True RangeThis script should give you a quick idea how far your stock has moved intraday compared to the ATR.
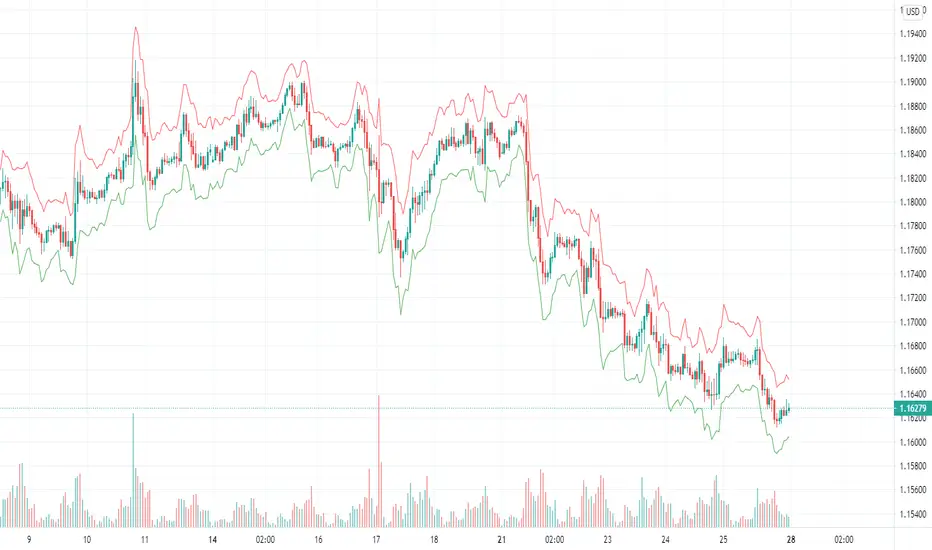
Rolling ATR Channel (Expo)Rolling ATR Channel (Expo) is a sophisticated indicator that identifies the underlying trend as well as identifies ATR based trading ranges. In a trending market, the price will be within the Upper or Lower band. If the market is in a trading range , the price will bounce between the upper and lower ATR zones, until the price breaks through and creates a new trend. The user will no longer have to guess in which state the market is in, the indicator displays it clearly.
So, the indicator displays real-time Range (ATR based) support and resistance zones as well as if the market is in a trend.
If you know the current market state, you have the ability to choose the most applicable market strategy.
Real-time
No repainting
Works on any market and in any timeframe
HOW TO USE
- Use the indicator to identify trading range support and resistance zones.
- Use the indicator to identify when the price breaks through the trading range.
- Use the indicator to identify if the market is in a trend.
INDICATOR IN ACTION
4 Hour chart
I hope you find this indicator useful , and please comment or contact me if you like the script or have any questions/suggestions for future improvements. Thanks!
I will continually work on this indicator, so please share your experience and feedback as it will enable me to make even better improvements. Thanks to everyone that has already contacted me regarding my scripts. Your feedback is valuable for future developments!
-----------------
Disclaimer
Copyright by Zeiierman.
The information contained in my scripts/indicators/ideas does not constitute financial advice or a solicitation to buy or sell any securities of any type. I will not accept liability for any loss or damage, including without limitation any loss of profit, which may arise directly or indirectly from the use of or reliance on such information.
All investments involve risk, and the past performance of a security, industry, sector, market, financial product, trading strategy, or individual’s trading does not guarantee future results or returns. Investors are fully responsible for any investment decisions they make. Such decisions should be based solely on an evaluation of their financial circumstances, investment objectives, risk tolerance, and liquidity needs.
My scripts/indicators/ideas are only for educational purposes!
-----------------
ACCESS THE INDICATOR
• Contact me on TradingView or use the links below


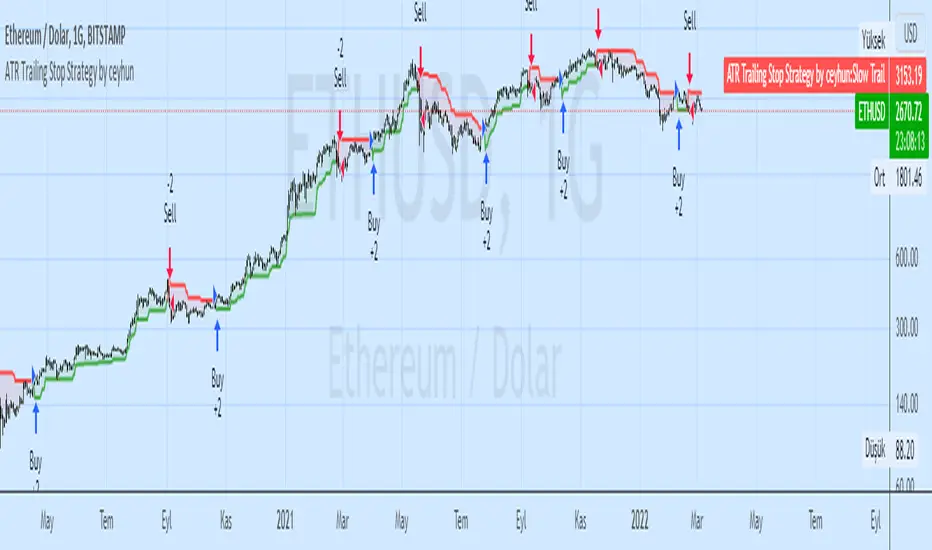
ATR Trailing Stop Strategy by ceyhunSame coding only coloring and strategy version added
//Barcolor
Green = Trail1 > Trail2 and close > Trail2 and low > Trail2
Blue = Trail1 > Trail2 and close > Trail2 and low < Trail2
Red = Trail2 > Trail1 and close < Trail2 and high < Trail2
Yellow = Trail2 > Trail1 and close < Trail2 and high > Trail2
//It gives White color where there is deterioration.
Let's not use InfoPanel in strategy, it would be wrong as it signals the next day.
ATR Trailing Stoploss StrategyI am sharing the strategy version of the indicator used before. It is very simple to use.
These are the settings I use, you can change, test and use as you wish.
Atr Period 5
Highest High Period 10
Multiplier 2.5
It can generate more signals in shorter time frames.
The success rate will be higher in longer time frames.

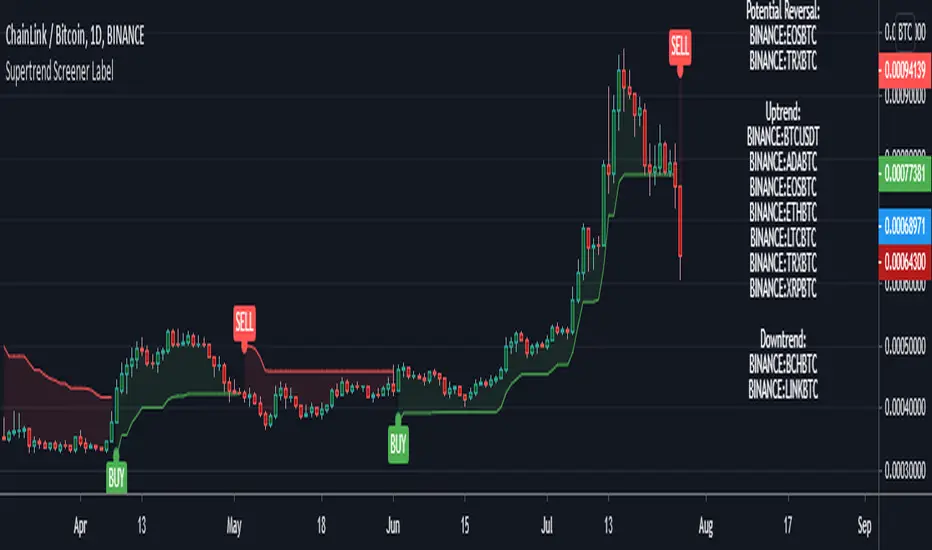
Supertrend Screener LABELThis screens for Supertrend reversal's in 10 different securities. The main logic for the screener is taken from "Simple Custom Screener in Pinescript" by QuantNomad with his permission. If the label color is not visible due to the text in it being white colored, then choose a different color from settings. Also added a simple supertrend to it.
Terminology explanation:
Confirmed Reversal: Supertrend reversal that happened in the last bar and cannot be repainted.
Potential Reversal: Supertrend reversal that might happen in the current bar but can also not happen depending upon the timeframe closing price.
Uptrend/Downtrend : Shows all the tickers that are either currently in uptrend or downtrend.
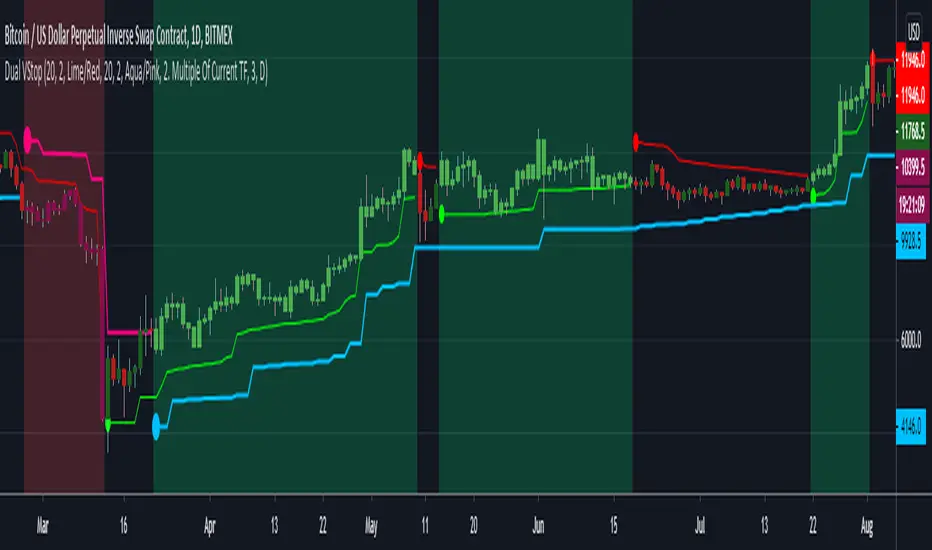
Dual Volatility StopThis merges Volatility Stop & its MTF version both published by u/TradingView . Background is colored green or red when both the current timeframe Vstop and higher timeframe Vstop point in same direction. Aim is to take the standard Vstop script which differentiates market from only uptrend/downtrend to uptrend/downtrend/sideways. There is a tradeoff with this, that there is no need for the Vstop to be always in a position which reduces trade time & frees up capital. However this leads to situations where it takes slightly more time to catch on to a trend after a reversal.
Green Background = Buy
Red Background = Sell
No Background = Flat
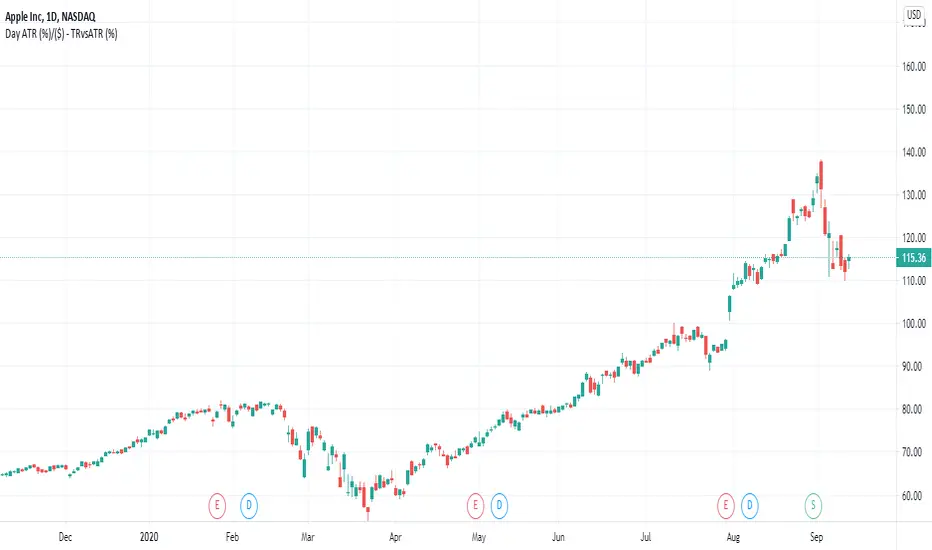
Average True Range %This is a modification to the Built-In Average True Range Indicator that uses the last close to calculate the range as a percentage.
