ApocalipseCreato da MONTEFORTE. indicatore che sfrutta la logica smart money con entrate sniper. alto winrate
Bands and Channels

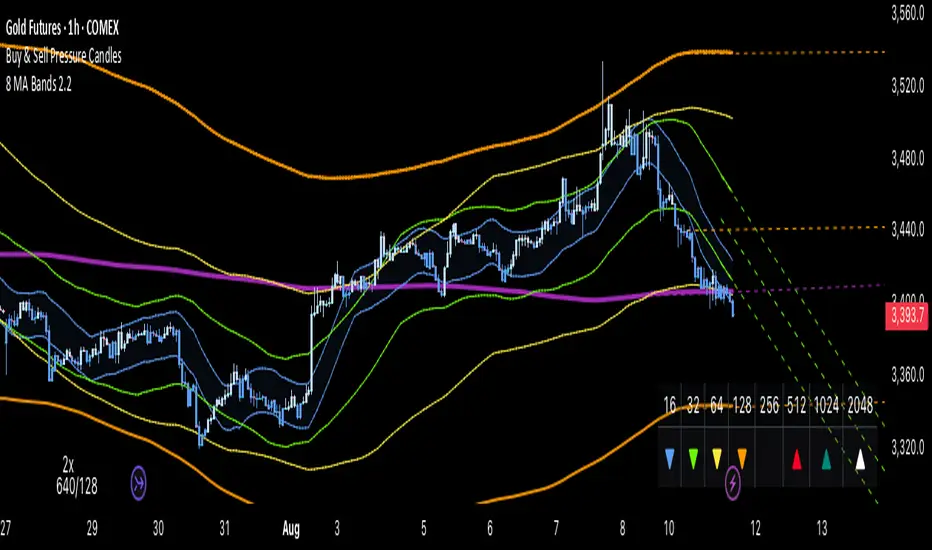
ONE RING 8 MA Bands with RaysCycle analysis tool ...
MAs: Eight moving averages (MA1–MA8) with customizable lengths, types (RMA, WMA, EMA, SMA), and offsets
Bands: Upper/lower bands for each MA, calculated based on final_pctX (Percentage mode) or final_ptsX (Points mode), scaled by multiplier
Rays: Forward-projected lines for bands, with customizable start points, styles (Solid, Dashed, Dotted), and lengths (up to 500 bars)
Band Choices
Manual: Uses individual inputs for band offsets
Uniform: Sets all offsets to base_pct (e.g., 0.1%) or base_pts (e.g., 0.1 points)
Linear: Scales linearly (e.g., base_pct * 1, base_pct * 2, base_pct * 3 ..., base_pct * 8)
Exponential: Scales exponentially (e.g., base_pct * 1, base_pct * 2, base_pct * 4, base_pct * 8 ..., base_pct * 128)
ATR-Based: Offsets are derived from the Average True Range (ATR), scaled by a linear factor. Dynamic bands that adapt to market conditions, useful for breakout or mean-reversion strategies. (final_pct1 = base_pct * atr, final_pct2 = base_pct * atr * 2, ..., final_pct8 = base_pct * atr * 8)
Geometric: Offsets follow a geometric progression (e.g., base_pct * r^0, base_pct * r^1, base_pct * r^2, ..., where r is a ratio like 1.5) This is less aggressive than Exponential (which uses powers of 2) and provides a smoother progression.
Example: If base_pct = 0.1, r = 1.5, then final_pct1 = 0.1%, final_pct2 = 0.15%, final_pct3 = 0.225%, ..., final_pct8 ≈ 1.71%
Harmonic: Offsets are based on harmonic flavored ratios. final_pctX = base_pct * X / (9 - X), final_ptsX = base_pts * X / (9 - X) for X = 1 to 8 This creates a harmonic-like progression where offsets increase non-linearly, ensuring MA8 bands are wider than MA1 bands, and avoids duplicating the Linear choice above.
Ex. offsets for base_pct = 0.1: MA1: ±0.0125% (0.1 * 1/8), MA2: ±0.0286% (0.1 * 2/7), MA3: ±0.05% (0.1 * 3/6), MA4: ±0.08% (0.1 * 4/5), MA5: ±0.125% (0.1 * 5/4), MA6: ±0.2% (0.1 * 6/3), MA7: ±0.35% (0.1 * 7/2), MA8: ±0.8% (0.1 * 8/1)
Square Root: Offsets grow with the square root of the band index (e.g., base_pct * sqrt(1), base_pct * sqrt(2), ..., base_pct * sqrt(8)). This creates a gradual widening, less aggressive than Linear or Exponential. Set final_pct1 = base_pct * sqrt(1), final_pct2 = base_pct * sqrt(2), ..., final_pct8 = base_pct * sqrt(8).
Example: If base_pct = 0.1, then final_pct1 = 0.1%, final_pct2 ≈ 0.141%, final_pct3 ≈ 0.173%, ..., final_pct8 ≈ 0.283%.
Fibonacci: Uses Fibonacci ratios (e.g., base_pct * 1, base_pct * 1.618, base_pct * 2.618
Percentage vs. Points Toggle:
In Percentage mode, bands are calculated as ma * (1 ± (final_pct / 100) * multiplier)
In Points mode, bands are calculated as ma ± final_pts * multiplier, where final_pts is in price units.
Threshold Setting for Slope:
Threshold setting for determining when the slope would be significant enough to call it a change in direction. Can check efficiency by setting MA1 to color on slope temporarily
Arrow table: Shows slope direction of 8 MAs using an Up or Down triangle, or shows Flat condition if no triangle.
AV - Bollinger BandsThis is a version of Bollinger Bands which shows the upslope and down slopes of the bands for easy identification of the slope

AutoRange-MVMAUTO RANGE BASED TRADING STRATEGY IT WILL BASED ON RANGE TRADING , the prices remains in the range for 70% of time that is the idea to trade and avoid trending market for range that is the basic idea

MACD dong pha 2 cap do W/DInstructions for use:
_ Green area: Weekly and Daily MACD are both in the Positive zone
_ Red area: Weekly and Daily MACD are both in the Negative zone

Adaptive ATR LimitsThis script plots adaptive ATR limits for intraday trading. It is intended for equities. It is not tested for other securities like futures, crypto, etc, though it may work for these too. It works for both regular trading hours and extended trading hours.
The limit lines (top and bottom) are always exactly 1 ATR/ADR apart. This is a key feature of the indicator.
The main mode is ATR, which includes overnight gaps and pre- and post-market movements. This also means the previous day close is considered to part of the current days range (which aligns with the definition of ATR). There is also an ADR mode, which uses the average range the price moves within regular hours only and is not affected by prices outside of these. Other than that, they work the same (including ATR/ADR length option and smoothing).
When in ADR mode, it treats premarket as a separate session from the regular/post-market and resets the session range at the regular market open. This is so it can plot the limits in the regular/post-market hours without being affected by the pre-market range. This is necessary since the daily ADR includes only regular market moves and due to the way the limits adapt.
It tries to plot the most sensible ATR limits based on the current daily ATR, in order to provide a visual target for how far a price could/should move intraday. In order to do this, it uses two methods to calculate limits, i) based on the mid-point of the current session range, and ii) based on the currently established range and current relative price position within that range.
The session starts using the first method. As more of the ATR is covered in the session, it transitions over of the second method. Once (if) the full ATR is covered within the session, it will have completely transitioned to the second method and will only use that for the rest of the session. In between these states, a weighted average of the two methods is used depending on the amount of the ATR the session has covered.
To explain the effect, as an example, imagine that the price is approaching the full ATR range on the high side. The indicator will have almost fully transitioned to the second (relative) method. The lower ATR limit will now be anchored to the daily low as the price hits the upper ATR limit. If the price goes beyond the upper ATR, the lower ATR limit will stay anchored to the daily low, and the upper limit will stay anchored to 1 ATR above the lower limit. This allows you to see how far the price is going beyond the upper ATR limit. If the price then returns and backs off the upper ATR limit, the lower ATR limit will un-anchor from the daily low (it will actually rise since the daily ATR range has been exceeded so the lower ATR limit needs to come up since the actual daily range can't fit into the ATR range anymore). The overall effect is to give you the best visual indication where the price is in relation to a possible upper ATR-based target. Reverse this example for when price low approaches the ATR range on the low side.
There is also a "basic mode" which simply plots 1 ATR/ADR above/below the session low/high. When using ADR, the session resets at the end of the pre-market.
The ATR length (averaging period) can be set (number of days), as well as a visual smoothing of the ATR limits using EMA.

HL2 Moving Average with BandsThis indicator is designed to assist traders in identifying potential trade entries and exits for S&P 500 (ES) and Nasdaq-100 (NQ) futures. It calculates a Simple Moving Average (SMA) based on the HL2 value (average of high and low prices) of the current candle over a user-defined lookback period (default: 200 periods). The indicator plots this SMA as a blue line, providing a smoothed reference for price trends.
Additionally, it includes upper and lower bands calculated as a percentage (default: 0.5%) above and below the SMA, plotted as green and red lines, respectively. These bands act as dynamic thresholds to identify overbought or oversold conditions. The indicator generates trade signals based on price action relative to these bands:
Long Entry: A green upward triangle is plotted below the candle when the close crosses above the upper band, signaling a potential buy.
Close Long: A red square is plotted above the candle when the close crosses back below the upper band, indicating an exit for the long position.
Short Entry: A red downward triangle is plotted above the candle when the close crosses below the lower band, signaling a potential sell.
Close Short: A green square is plotted below the candle when the close crosses back above the lower band, indicating an exit for the short position.
The script is customizable, allowing users to adjust the SMA length and band percentage to suit their trading style or market conditions. It is plotted as an overlay on the price chart for easy integration with other technical analysis tools.
Recommended Time Frame and Settings for Trading S&P 500 and Nasdaq-100 Futures
Based on research and market dynamics for S&P 500 (ES) and Nasdaq-100 (NQ) futures, the 5-minute chart is recommended as the optimal time frame for day trading with this indicator. This time frame strikes a balance between capturing intraday trends and filtering out excessive noise, which is critical for futures trading due to their high volatility and leverage. The 5-minute chart aligns well with periods of high liquidity and volatility, such as the U.S. market open (9:30 AM–11:00 AM EST) and the afternoon session (2:00 PM–4:00 PM EST), when institutional traders are most active.
Why 5-minute? It allows traders to react to short-term price movements while avoiding the rapid fluctuations of 1-minute charts, which can be prone to false signals in choppy markets. It also provides enough data points to make the SMA and bands meaningful without the lag associated with longer time frames like 15-minute or hourly charts.
Recommended Settings
SMA Length: Set to 200 periods. This longer lookback period smooths the HL2 data, reducing noise and providing a reliable trend reference for the 5-minute chart. A 200-period SMA helps identify significant trend shifts without being overly sensitive to minor price fluctuations.
Band Percentage: 0.5% is more suitable for the volatility of ES and NQ futures on a 5-minute chart, as it generates fewer but higher-probability signals. Wider bands (e.g., 1%) may miss short-term opportunities, while narrower bands (e.g., 0.1%) may produce excessive false signals.
Trading Session Recommendations
Futures markets for ES and NQ are open nearly 24 hours (Sunday 6:00 PM EST to Friday 5:00 PM EST, with a daily break from 4:00 PM–5:00 PM EST), but not all hours are equally optimal due to varying liquidity and volatility. The best times to trade with this indicator are:
U.S. Market Open (9:30 AM–11:00 AM EST): This period is characterized by high volume and volatility, driven by the opening of U.S. equity markets and economic data releases (e.g., 8:30 AM EST reports like CPI or GDP). The indicator’s signals are more reliable during this window due to strong order flow and price momentum.
Afternoon Session (2:00 PM–4:00 PM EST): After the lunchtime lull, volume picks up as institutional traders return, and news or FOMC announcements often drive price action. The indicator can capture breakout moves as prices test the upper or lower bands.
Pre-Market (7:30 AM–9:30 AM EST): For traders comfortable with lower liquidity, this period can offer opportunities, especially around 8:30 AM EST economic releases. However, use tighter risk management due to wider spreads and potential volatility spikes.
Additional Tips
Avoid Low-Volume Periods: Steer clear of trading during low-liquidity hours, such as the overnight session (11:00 PM–3:00 AM EST), when spreads widen and price movements can be erratic, leading to false signals from the indicator.
Combine with Other Tools: Enhance the indicator’s effectiveness by pairing it with support/resistance levels, Fibonacci retracements, or volume analysis to confirm signals. For example, a long entry signal above the upper band is stronger if it coincides with a breakout above a key resistance level.
Risk Management: Given the leverage in futures (e.g., Micro E-mini contracts require ~$1,200 margin for ES), use tight stop-losses (e.g., below the lower band for longs or above the upper band for shorts) to manage risk. Aim for a risk-reward ratio of at least 1:2.
Test Settings: Backtest the indicator on a demo account to optimize the SMA length and band percentage for your specific trading style and risk tolerance. Micro E-mini contracts (MES for S&P 500, MNQ for Nasdaq-100) are ideal for testing due to their lower capital requirements.
Why These Settings and Time Frame?
The 5-minute chart with a 200-period SMA and 0.5% bands is tailored for the volatility and liquidity of ES and NQ futures during peak trading hours. The longer SMA period ensures the indicator captures meaningful trends, while the 0.5% bands are tight enough to signal actionable breakouts but wide enough to avoid excessive whipsaws. Trading during high-volume sessions maximizes the likelihood of valid signals, as institutional participation drives clearer price action.
By focusing on these settings and time frames, traders can leverage the indicator to capitalize on the dynamic price movements of S&P 500 and Nasdaq-100 futures while managing the inherent risks of these markets.

Uptrend Filter: Price > 50 & 200 MA + Upward SlopeThis indicator is designed to help traders instantly identify strong uptrend conditions based on two simple yet powerful criteria:
Price is above both the 50-day and 200-day moving averages
Both moving averages are sloping upward (positive momentum)
When both conditions are met, the indicator plots a green “UP” label below the candle, signaling a valid uptrend setup. This filter is ideal for asset selection in strategy-building, portfolio rotation, or trend-following systems.
🧠 Why it works:
The 50-day MA reflects medium-term momentum.
The 200-day MA represents the long-term trend.
When both are aligned and sloping upward, it confirms strong market structure and trend health.
🧰 Best used for:
Token screening (e.g., filtering altcoins)
Momentum-based entries
Trend confirmation
Risk filtering in strategy backtesting

VWAP with Smart Bands v4## VWAP with Smart Bands v4
**Overview:**
This indicator provides a comprehensive Volume Weighted Average Price (VWAP) analysis tool, enhanced with multiple standard deviation bands, adaptive percentage-based tolerance zones, and optional stop-loss visualization lines. It's designed for intraday analysis, helping traders identify potential areas of support, resistance, mean reversion, and manage risk visually.
**Core Components:**
* **VWAP (Volume Weighted Average Price):** The core line, calculated fresh each day (or selected period), representing the average price weighted by volume. It acts as a benchmark for the current session's price action.
* **Standard Deviation Bands:** Plotted above and below the VWAP, these bands measure volatility and the expected range of price movement based on standard deviation calculations from the VWAP.
**Features & Options:**
* **VWAP Line:**
* `Color VWAP based on Close`: (Default: ON) Toggles dynamic coloring. When ON, the VWAP line turns bullish (green) if the closing price is above it and bearish (red) if below. When OFF, it uses a single default color (yellow).
Trade bounce and reclaim setup of the VWAP line.
* **Deviation Bands:**
* **Band 1:** (Default: ON, Dev 1.0) Typically represents 1 standard deviation (~68% of price action).
* **Band 2:** (Default: ON, Dev 2.0) Typically represents 2 standard deviations (~95% of price action).
* **Band 3:** (Default: OFF, Dev 3.0) Typically represents 3 standard deviations (~99.7% of price action), but can be set to any custom value (e.g., 1.5, 2.5) for flexibility.
* Each band can be toggled on/off independently.
Trade bounce and reclaim setup of these bands.
* **Tolerance Bands:** (Adaptive Percentage Based)
* Provides finer zones around the VWAP and Deviation Bands (1 & 2).
* Instead of fixed point values, the tolerance is set as a *percentage* of the line it surrounds (VWAP, Upper/Lower Band 1, Upper/Lower Band 2). This makes the tolerance zones automatically adapt to market volatility and price levels.
* `Tolerance % VWAP`: (Default: 0.1%, OFF) Adds +/- tolerance lines around the VWAP.
* `Tolerance % 1`: (Default: 0.1%, ON) Adds +/- tolerance lines around Band 1.
* `Tolerance % 2`: (Default: 0.1%, OFF) Adds +/- tolerance lines around Band 2.
These will help to make consistent decisions if trade setup is valid or not.
* **Stop-Loss (SL) Visualization Bands:** (Default: OFF)
* Optional step-lines to help visualize potential stop-loss placement areas relative to VWAP, Band 1, or Band 2.
* `SL % VWAP`: Defines SL lines as a percentage +/- from the VWAP value.
* `SL % Band 1 / Band 2`: Defines SL lines based on a percentage modification of the band's *deviation* from VWAP.
* `SL Position Band 1 / Band 2`: Choose whether the SL lines appear "Inside" (closer to VWAP), "Outside" (further from VWAP), or "Both" relative to the original deviation band.
* Plotted as dim yellow step-lines by default.
This will help to define stoploss distance and keeping it consistent.
* **Visual Settings:**
* `Fill between Price and VWAP`: (Default: OFF) Optionally fills the area between the closing price and the VWAP line with bullish/bearish colors.


FVG Overlap Zone (4H ∩ Daily) with Touch Hammerhis script is designed to help smart money / ICT-style traders identify high-probability trade zones formed by the overlap of 4-hour and Daily Fair Value Gaps (FVGs).
It then alerts the trader when price touches these overlap zones, showing a 🔨 hammer icon to visually mark them for live trades or backtesting.

SaiNetra Bot v2.0 – Universal AI ML StrategySaiNetra v2.0 – Universal AI + ML Trading Bot
This invite-only script is a sacred fusion of AI logic and divine inspiration, guided by the blessings of Bhagawan Sri Sathya Sai Baba.
SaiNetra is designed for precision entries using adaptive AI, Renko logic, and multi-timeframe analysis.
Built for Nifty, BankNifty, Silver, and XAUUSD — this bot identifies institutional-grade trade zones while integrating Swamy’s dharmic protection at every step.
🛡️ Designed by Dr. Ravindranath G as part of the Sai Sankalpam project.
🌍 Available only to seekers ready to walk the spiritual path of conscious trading.
— With Love & Surrender, Dr. Ravindranath G 🌺

Essential EMAs (50/100/200) — Clean & Focused by Koenigsegg⚡ Essential EMAs (50/100/200) — Clean & Focused by Koenigsegg
A no-noise, high-impact EMA trio designed for clarity and precision. This script lays down the 50, 100, and 200 EMAs in a sleek, focused format — perfect for traders who rely on structure, trend, and execution without chart clutter.
Simple. Effective. Intentional.
🔑 Key Features
📏 Plots 50, 100, and 200 EMAs with distinct colors
🧼 Designed for clean, distraction-free charts
🧠 Uses ta.ema() for efficient calculations
ta.ema()
🎨 Thoughtfully styled: green (50), purple (100), red (200)
⚙️ Lightweight and fast — optimized for all timeframes
🎯 Purpose
This script delivers the three most respected EMAs in trading — the 50, 100, and 200 — for structural awareness, trend confirmation, and entry/exit precision.
Whether you’re swing trading, day trading, or simply tracking price relative to long-term moving averages, this tool keeps your perspective grounded and your charts clean.
⚠️ Disclaimer
This script is for educational and informational purposes only. It does not constitute financial advice. Always perform your own analysis and trade responsibly.


xAlgo Bands Signal📈 xAlgo Bands Signal – Advanced Market Insights for Traders
xAlgo Bands Signal is for traders seeking structured, visually intuitive market analysis.
It highlights potential trade zones, detects price momentum shifts, and helps you stay aligned with prevailing market conditions – all in one streamlined view.
This script was designed to support decision-making through clean visual cues and adaptive logic, suitable for multiple asset classes and timeframes.
🌐 Key Features:
Clear zone-based visual structure
Long/Short signal markers based on internal logic
Real-time metrics panel for market context
Designed to complement your existing trading strategies
🔒 Access is currently unlimited to all users.
⚠️ Disclaimer: This script is provided for educational and informational purposes only. It does not constitute financial advice or a recommendation to buy or sell any asset. Use at your own discretion.

6 Dynamic EMAs by Koenigsegg🚀 6 Dynamic EMAs by Koenigsegg
Take control of your chart with ultimate flexibility. This tool gives you 6 customizable EMAs across any timeframe, helping you read the market like a pro, whether you're scalping seconds or swinging days. Built for precision, designed for dominance.
The combinations? Endless. Mix and match any EMA lengths and timeframes for tailored confluence — exactly how elite traders operate.
🔑 Key Features
✅ 6 Fully Customizable EMAs
⏳ Multi-Timeframe Support (from seconds to months)
🎨 Custom Colors & Thickness for each EMA
🚨 Built-in Cross Alerts for instant trade signals
🧠 Clean, efficient logic using request.security()
🔁 Dynamically toggle EMAs on/off
⚙️ Lightweight for smooth chart performance
🧩 Endless combo potential — confluence on your terms
🎯 Purpose
This indicator was built to give traders a clear, responsive, and multi-timeframe edge using dynamic Exponential Moving Averages. Whether you're trend-following, identifying momentum shifts, or building a confluence system — these 6 EMAs are here to align with your strategy and style.
💡 Pro Tip
Instead of cluttering your chart with multiple EMA indicators, this script consolidates all into one sleek tool. You can toggle off bands you don't currently need, like running only the 12/21 EMAs on your active chart timeframe, while adding the 12/21 EMAs from a higher timeframe to guide trade decisions.
With this setup, you're not just reacting — you're orchestrating your trades with intention.
⚠️ Disclaimer
This script is for educational and informational purposes only. It does not constitute financial advice. Always do your own research and trade responsibly. Past performance does not guarantee future results.

EM Visible Range Volume Profilevar string tt1 = 'VP amplitude. nAdaptively adjusts based on the number of candlesticks visible on the chart. nnWidthnVP Amplitude (width) of the histogram. nn%, range in steps of 5'
var string tt2 = the number of columns in the 'VP histogram. nnNumber of columns in the gridnVP histogram. nnRange in 5' steps
var string tt3 = 'Combined calculation of the volume ratio. nnDeltanThe ratio of buyers and sellers is judged in a combined way. '
var string tt6 = 'Count VP by selected timeframe.' nISO mode: Isolation calculations are performed during the HTF cycle. nnVP is calculated based on the selected time period. nISO: Calculated independently in the HTF cycle. '
var string tt7 = 'Palette: Total Volume, Buying Volume, Selling Volume, HTF Bar. nnPalette: Overall Volume, Buying Volume, Selling Volume, High Time Frame Bars. '
var string tt9 = 'Extra: A grid of moving averages built with periods of the number of central hexagons. nnAdditional feature: ᴇᴍ CHN-RMA — Moving average grid with the number of central hexagons for periods. nn© EulerMethod'
Added trading signal alert text
var string tt10 = 'VP edge zone trading signal. nGo short on the upper edge of the VP and long on the lower edge. nnPercentage of marginal areanDefine the percentage range of upper and lower marginal regions '

EMA Clouds mit VWAPs (Trendfilter)EMA Clouds with VWAPs (Trend Filter)
This indicator combines Exponential Moving Averages (EMAs) with Volume Weighted Average Prices (VWAPs) for the month and year to determine the current market trend and provide key support and resistance zones for potential entry points.
Key Features:
Fast and slow EMA Clouds to identify market trends.
Monthly and Yearly VWAPs to support trend analysis and identify significant support and resistance zones.
Trend Filter: Long trades are executed when the price is above the slow EMA (bullish trend), and short trades are executed when the price is below the slow EMA (bearish trend).
How it Works:
EMAs serve as the primary trend filter to determine if the market is in an uptrend or downtrend.
VWAPs for the month and year help analyze long-term price movements.
The trend filter identifies the market direction and signals potential entry and exit points.
Customization:
You can adjust the timeframes for the VWAPs and EMAs, as well as the line thickness for the plots.
The display options for the VWAPs and EMAs can be toggled on or off as needed.

Color Coded EMAThis updated EMA indicator provides a visual indication of momentum and potential reversal zones based on price action relative to the moving average.
When the closing price is above the EMA, the plot turns green
When the closing price is below the EMA, the plot turns red

Stratégie GBPUSD Montréal (8h-17h) AmélioréeDescription
This indicator is designed to identify trading opportunities on the GBPUSD pair during Montreal market hours (UTC-4). It uses a combination of morning range analysis, H1 trend identification, and Fair Value Gap (FVG) detection to generate reliable buy and sell signals.
Key Features
1. Session and Range Analysis
Defines a customizable trading session (default: 8am-5pm Montreal time)
Captures the morning price range (default: 3am-8am Montreal time)
Generates signals when price breaks above/below the morning range during the active session
2. Advanced Filters
H1 Trend Analysis: Confirms signals in the direction of the hourly trend
Fair Value Gaps (FVG): Detects market inefficiency zones to improve entry quality
Volume Filter: Option to confirm movements with significant volume
Volatility Filter: Avoids signals during periods of excessive volatility
Moving Average Filter: Option to confirm signals with the direction of a moving average
3. Clear Visualization
Displays the morning range with customizable dashed lines
Marks buy/sell signals with colored triangles
Signals confirmed by FVG are highlighted with an additional circle
Displays previous day levels (high/low) for reference
Information table showing session hours, current time, and morning range values
Setup and Parameters
The indicator is fully customizable with several parameter groups:
Trading Session
Opening and closing hours (Montreal time)
Configurable UTC offset
Morning Range
Start and end times for morning range capture
Filters
Option to enable/disable volume filter
Minimum relative volume required
Option to use Fair Value Gaps
Option to filter by moving average
Moving average period
Visual Parameters
Option to display previous day levels
Customizable colors for range, buy/sell signals, and levels
Size of FVG signals
Trading Strategy
This indicator implements a breakout strategy based on the morning price range:
The indicator captures the high and low prices during the morning hours (3am-8am Montreal time)
During the active trading session (8am-5pm), it looks for price breakouts above the morning high or below the morning low
Buy signals are generated when price closes above the morning high during the session, with H1 upward trend confirmation
Sell signals are generated when price closes below the morning low during the session, with H1 downward trend confirmation
Additional filters improve signal quality and reduce false breakouts
Best Usage
Best used on GBPUSD pair during Montreal trading hours
Works well on timeframes from 5 minutes to 1 hour
Can be combined with other technical indicators for confirmation
Set up alerts for buy and sell signals for real-time notifications
This indicator helps traders capitalize on the specific price action patterns that develop during Montreal market hours on the GBPUSD pair, with a focus on identifying high-probability breakout opportunities with multiple confirmation factors.

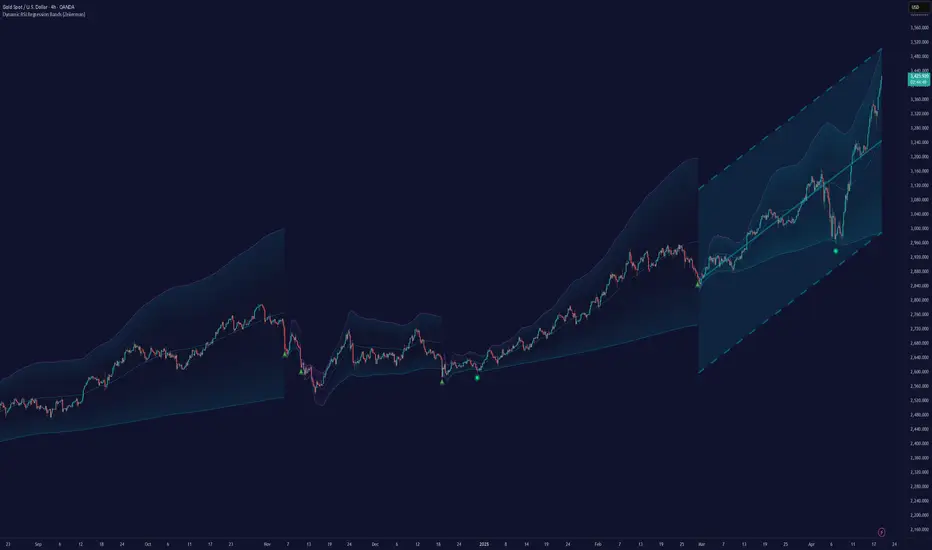
Dynamic RSI Regression Bands (Zeiierman)█ Overview
The Dynamic RSI Regression Bands (Zeiierman) is a regression channel tool that dynamically resets based on RSI overbought and oversold conditions. It adapts to trend shifts in real time, creating a highly responsive regression framework that visualizes market sentiment and directional momentum with every RSI-triggered event.
Unlike static regression models, this indicator recalibrates its slope and deviation bands only after the RSI crosses predefined thresholds, helping traders pinpoint new phases of momentum, exhaustion, or reversal.
You’re not just measuring the trend — you’re tracking when and where the trend deserves to be re-evaluated.
█ The Assumption:
"A major momentum shift (RSI crossing OB/OS) signals a potential regime change, and thus, the trend model should be recalibrated from that point."
Instead of using a fixed-length regression (which assumes trend relevance over a static window), this script resets the regression calculation every time RSI crosses into extreme territory. The underlying idea is that extreme RSI levels often represent emotional peaks in market behavior and are statistically likely to be followed by a new price structure.
█ How It Works
⚪ RSI-Based Channel Reset
RSI is monitored continuously
If RSI crosses above the Overbought level, the indicator resets and starts a new regression channel
If RSI crosses below the Oversold level, the same reset logic applies
These events act as “anchor points” for dynamic trend analysis
⚪ Regression Channel Logic
A custom linear regression is calculated from the RSI reset point forward
The lookback grows with each bar after the reset, up to a user-defined max
Regression lines are drawn from the reset point to the current bar
⚪ Standard Deviation Bands
Upper and lower bands are plotted around the regression line using the standard deviation
These serve as dynamic volatility envelopes, great for spotting breakouts or reversals
⚪ Rejection Markers
If price hits the upper/lower band and then closes back inside it, a rejection marker is plotted
Helps visualize failed breakouts and areas of absorption or reversal pressure
█ How to Use
⚪ Detect Trend Shifts
Use the RSI resets to identify when the trend might be starting fresh.
⚪ Watch the Bands for Volatility Extremes
Use the outer bands as soft areas of potential reversal or momentum breakout.
⚪ Spot Rejections for Potential Entry Signals
If price moves outside a band but then quickly returns inside, it often means the breakout failed, and price may reverse.
█ Settings Explained
RSI Length – How many bars RSI uses. Shorter = faster.
OB / OS Levels – Crossing these triggers a regression reset.
Base Regression Length – Max number of bars regression can use post-reset.
StdDev Multiplier – Controls band width from the regression line.
Min Bars After Reset – Ensures channel doesn’t form immediately; waits for structure.
Show Reset Markers – Triangles mark where RSI crossed OB/OS.
Show Rejection Markers – Circles mark where the price rejected the channel edge.
-----------------
Disclaimer
The content provided in my scripts, indicators, ideas, algorithms, and systems is for educational and informational purposes only. It does not constitute financial advice, investment recommendations, or a solicitation to buy or sell any financial instruments. I will not accept liability for any loss or damage, including without limitation any loss of profit, which may arise directly or indirectly from the use of or reliance on such information.
All investments involve risk, and the past performance of a security, industry, sector, market, financial product, trading strategy, backtest, or individual's trading does not guarantee future results or returns. Investors are fully responsible for any investment decisions they make. Such decisions should be based solely on an evaluation of their financial circumstances, investment objectives, risk tolerance, and liquidity needs.
Daily ATR BandsATR Finder – Volatility Scanner for Smarter Trade Setups
The ATR Finder is a precision tool designed to help traders quickly identify high-volatility assets using the Average True Range (ATR) – a key metric in assessing market momentum and potential breakout zones. By automatically scanning and highlighting tickers or candles with elevated ATR values relative to their recent historical range, this indicator helps you filter for setups that are more likely to experience significant price moves.
Whether you're a day trader seeking intraday momentum or a swing trader looking for setups with strong follow-through potential, the ATR Finder cuts through the noise and visually signals which assets are "on the move." It can be paired with other indicators or price action tools to create a high-conviction trading strategy focused on volatility expansion.
Key Features:
Dynamic ATR Calculation over a user-defined period
Visual Alerts or Color-Coding for above-threshold volatility spikes
Supports Multiple Timeframes for both short- and long-term volatility analysis
Great for spotting breakout opportunities, gap continuations, or trend reversals
Use the ATR Finder to stay ahead of price action and build a watchlist that moves with purpose. Perfect for scalpers, breakout traders, and anyone who respects the power of volatility.

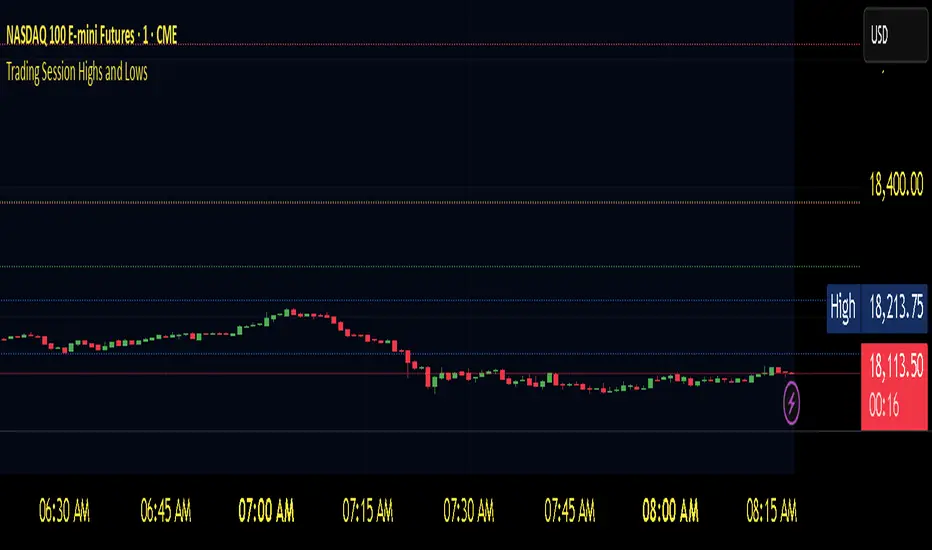
Trading Session Highs and LowsTrading Session Highs and Lows
This script provides an intuitive way to visualize key market levels from major trading sessions: Asia, London, New York, and New York Close. By automatically plotting the high and low of each session, it helps traders quickly identify important price levels that could impact market behavior.
Features include:
Session Marking: The script marks the high and low for each major session (Asia, London, New York, and New York Close).
Customizable Lines and Labels: You can adjust the line style, width, and color for each session’s high/low markers. The session name (e.g., "London", "New York") and the PDH/PDL (Prior Day High and Low) are also shown to give clear context.
Real-Time Updates: The levels are updated in real-time to reflect the current price action, helping you gauge price movement throughout the trading day.
Customizable Indicators: Easily adjust the visibility of the different sessions and the labels to focus on the session that matters most to your trading strategy.
This tool is designed to help day traders spot important levels for potential breakouts or reversals, making it easier to base your trading decisions on well-established price points. Ideal for scalpers, swing traders, and anyone who trades across multiple sessions.
MACD & Stochastic AlertThis code detects if the following combination has occured in the chart
if MACD has crossed over MACD Signal in the last 4 candles
and
whether the Fast Stochastic K% has exited the channel 80 & 23
Then you can set an alert based on the function call.
