Square of Nine Planetary Time ProgressionThis indicator enables users to plot future planetary projections in alignment with Square of Nine progression.
Description:
The Square of Nine Planetary Time Progression Indicator is a time-based market forecasting tool that integrates W.D. Gann’s Square of Nine principles with planetary time intervals. By mapping planetary cycles onto a geometric framework, this indicator may help traders identify potential market turning points with precision, aligning planetary time with Square of Nine progression.
It provides the ability to use geo or helio planetary positions, including the Moon, making it applicable for both long-term and intraday market timing.
Unlike traditional planetary cycle tools that rely on zodiacal aspects, this indicator focuses on planetary time intervals and their geometric relationships within the Square of Nine to forecast potential future key points in the market.
How to Use:
1. Select a Significant High or Low on any time frame
This reference point serves as the starting measurement for planetary time calculations, from which planetary time degrees will accumulate . Each subsequent projection reflects the cumulative solar or planetary degrees from this initial pivot, establishing a structured sequence of time-based market intervals.
2. Align the Degree Interval with the Next Market Swing:
Set the degree interval to align with the next major market swing from the intial point set in step 1.
The planetary time between these two points establishes the base time measurement for further calculations.
3. The script generates Square of Nine rotational increments, where the base measurement serves as the cornerstone for all future progressions/planetary time projections. As the script continues rotating around the Square of Nine, it produces the following sequence:
360° (Full Cycle) – The next full rotation from the base measurement.
180° (Half Cycle) – The midpoint between full cycles.
90° Increment from the Base Measurement – The first step in the Square of Nine progression.
90° Increment from 180° – The next step in the sequence, leading toward the full cycle.
Each of these increments builds upon the initial planetary time measurement, accumulating degrees through a structured Square of Nine progression, ensuring that future time projections align geometrically with the starting swing measurement.
Example Calculation:
Selecting the Base Measurement:
When the indicator is loaded, lets say the user selects a significant low as the starting point for the calculation.
Next, the user sets the input of the degree interval to align with the next major swing from that significant low.
Suppose the measured swing from the starting point occurs at 145 solar degrees—this becomes the base planetary time measurement.
Applying the Square of Nine Rotational Increments:
The script takes 145° and maps it onto the Square of Nine.
From 145° , the script projects future planetary degrees intervals based on the progression of 90-degree increments around the Square of Nine structure.
Generating Key Rotational Points:
Starting from 145° on the Square of Nine, we apply successive 90° increments:
151° (First 90° increment)
157°
163°
169° (180° opposition point)
176°
183°
190°
197° (Full 360° cycle rotation on the Square of Nine) and the rotation continues onto the next rung on the square of nine.
Plotting Future Projection Intervals:
The indicator plots these calculated degree intervals as future timing markers on the chart.
The opposition (180°) and full 360° cycle rotations are visually labelled using the conjunction (☌) and opposition (☍) symbols.
These symbols do not represent planetary aspects (as in traditional astrology) but instead mark geometric aspects derived from the Square of Nine.
These projected dates may help traders forecasting key market points in time. No repaint.
This indicator is inspired by the works of W.D. Gann and Patrick Mikula and is powered by AstroLib, developed by @BarefootJoey
Intraday example:
You can see that we're on the 4-hour chart using the Moon, with our initial measurement spanning 37 lunar degrees from high to low. The Square of Nine time projections are calculated in planetary degrees and plotted on the chart, forecasting future timing intervals.
Cycles

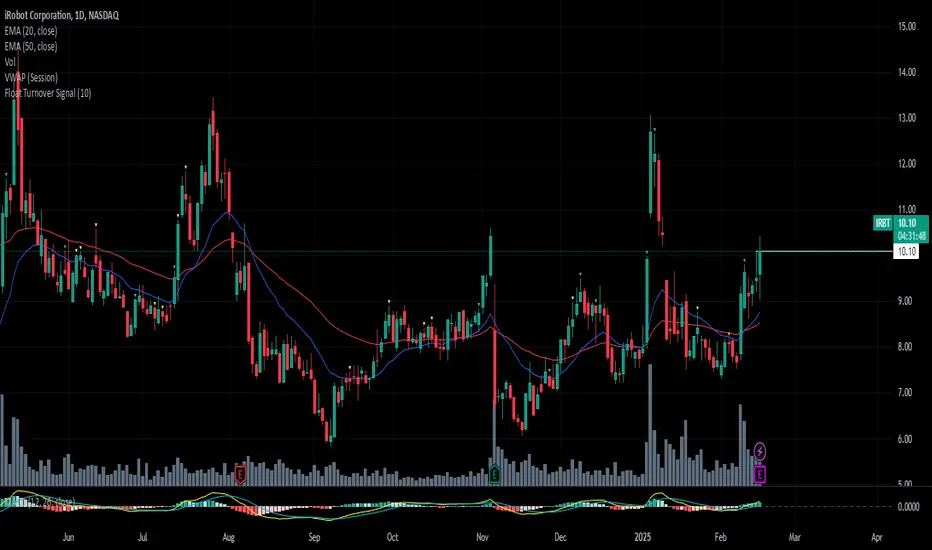
Float Turnover Signal
The *Float Turnover Signal* indicator helps traders analyze the relationship between price changes and trading volume relative to the stock's free float. It generates signals based on turnover ratios, providing insights into liquidity-driven price movements.
**How It Works**
- The indicator calculates the **percentage change** in closing price from two days ago to the previous day.
- It retrieves the **free float** (the number of publicly available shares) from TradingView.
- It then calculates the **turnover percentage**, which represents the previous day's trading volume as a percentage of the free float.
- The **turnover ratio** is derived by dividing the price change percentage by the turnover percentage.
- Based on this ratio, the indicator generates **color-coded signals**:
- 🟢 **Green Signal** – Indicates a balanced turnover ratio (0.8 to 1.2), suggesting a stable price-volume relationship.
- 🟡 **Yellow Signal** – Indicates a near-optimal but not perfect ratio (0.6-0.8 or 1.2-1.5), suggesting caution.
**Customization & Features**
✅ **Adjustable Signal Display** – Users can choose how many recent bars will display signals using the `"Number of Bars to Display Signal"` setting.
✅ **Works on Any Timeframe** – The indicator adapts to different chart resolutions.
✅ **Helps Identify Volume-Driven Moves** – Ideal for spotting potential breakouts, liquidity shifts, and confirming price action validity.
RoGr75 - Global Exchange Open/Close SignalsGlobal Exchange Open/Close Signals Indicator
This indicator helps traders track market hours for major global exchanges (NYSE, LSE, TSE, HKEX, and ASX) with these key features:
• Real-time Status Dashboard: Shows which exchanges are currently open/closed with an easy-to-read color-coded display (Green = Open, Red = Closed)
• Visual Market Open/Close Signals: Displays gradient background lines when your selected exchange opens (green) or closes (red)
• Timezone Adjustment: Easily adapt the indicator to your local timezone using the UTC offset setting
Supported Exchanges and Trading Hours (UTC):
• NYSE: 13:30 - 20:00 (9:30 AM - 4:00 PM ET)
• LSE: 08:00 - 16:30 (8:00 AM - 4:30 PM London)
• TSE: 00:00 - 06:30 (9:00 AM - 3:30 PM Tokyo)
• HKEX: 01:30 - 08:00 (9:30 AM - 4:00 PM HK)
• ASX: 00:00 - 06:00 (10:00 AM - 4:00 PM Sydney)
Settings:
• Select Exchange: Choose which exchange to monitor for open/close signals
• Show Dashboard: Toggle the exchange status dashboard on/off
• User Timezone Offset: Adjust the display to your local timezone (in UTC)
Use Cases:
• Monitor multiple exchange hours simultaneously
• Get visual alerts for market opens and closes
• Coordinate trading across different time zones
• Plan entries and exits around market hours
• Manage global trading portfolios effectively
Note: The indicator handles timezone conversions and markets crossing midnight automatically. Times are based on standard trading sessions and may not reflect holidays or special trading hours.

Time Based StatisticsThis indicator is a complex time-based statistics tool for analyzing intraday trading patterns. Here's a comprehensive breakdown:
1. **Session Management**
- Tracks trading sessions from 18:00 to 16:59 next day (using New York time)
- Separates analysis by weekdays (Monday through Friday)
- Resets statistics at week's end
2. **High/Low Time Tracking**
- Records when daily highs and lows occur for each day
- Maintains historical arrays of high/low times for pattern analysis
- Tracks high/low patterns in three main time periods:
- Evening/Overnight (18:00-23:59)
- Early Morning (00:00-09:59)
- Market Hours (10:00-16:59)
3. **Probability Calculations**
The indicator calculates several probabilities:
a) **Hold Probability**
- Calculates likelihood current high/low will remain day's high/low
- Counts how many historical highs/lows occurred in remaining hours
- Returns percentage based on historical patterns
b) **Most Frequent Times**
- Identifies which times most frequently produce highs/lows
- Tracks both primary and secondary (next highest) probable times
- Maintains historical counts of highs/lows by hour
4. **Pattern Analysis**
- Filters historical times based on current time
- Helps predict potential future high/low times
- Adjusts analysis based on time of day
5. **Data Display**
Shows statistics in a table including:
- Days of data analyzed
- Current day's high/low times
- Most frequent times for today's highs/lows
- Probability of current high/low holding
- Historical patterns for current hour
6. **Historical Data Management**
- Stores daily high/low data at week's end
- Maintains separate arrays for each day of the week
- Uses this historical data for pattern analysis
The indicator helps traders by:
- Understanding when highs/lows typically occur
- Assessing probability of new highs/lows
- Identifying historically significant time periods
- Providing statistical basis for timing decisions

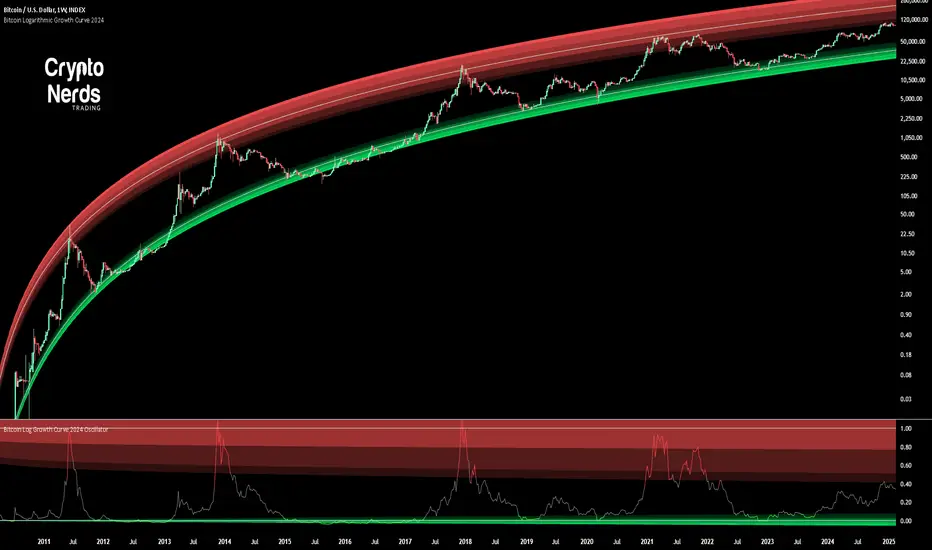
Bitcoin Log Growth Curve OscillatorThis script presents the oscillator version of the Bitcoin Logarithmic Growth Curve 2024 indicator, offering a new perspective on Bitcoin’s long-term price trajectory.
By transforming the original logarithmic growth curve into an oscillator, this version provides a normalized view of price movements within a fixed range, making it easier to identify overbought and oversold conditions.
For a comprehensive explanation of the mathematical derivation, underlying concepts, and overall development of the Bitcoin Logarithmic Growth Curve, we encourage you to explore our primary script, Bitcoin Logarithmic Growth Curve 2024, available here . This foundational script details the regression-based approach used to model Bitcoin’s long-term price evolution.
Normalization Process
The core principle behind this oscillator lies in the normalization of Bitcoin’s price relative to the upper and lower regression boundaries. By applying Min-Max Normalization, we effectively scale the price into a bounded range, facilitating clearer trend analysis. The normalization follows the formula:
normalized price = (upper regresionline − lower regressionline) / (price − lower regressionline)
This transformation ensures that price movements are always mapped within a fixed range, preventing distortions caused by Bitcoin’s exponential long-term growth. Furthermore, this normalization technique has been applied to each of the confidence interval lines, allowing for a structured and systematic approach to analyzing Bitcoin’s historical and projected price behavior.
By representing the logarithmic growth curve in oscillator form, this indicator helps traders and analysts more effectively gauge Bitcoin’s position within its long-term growth trajectory while identifying potential opportunities based on historical price tendencies.
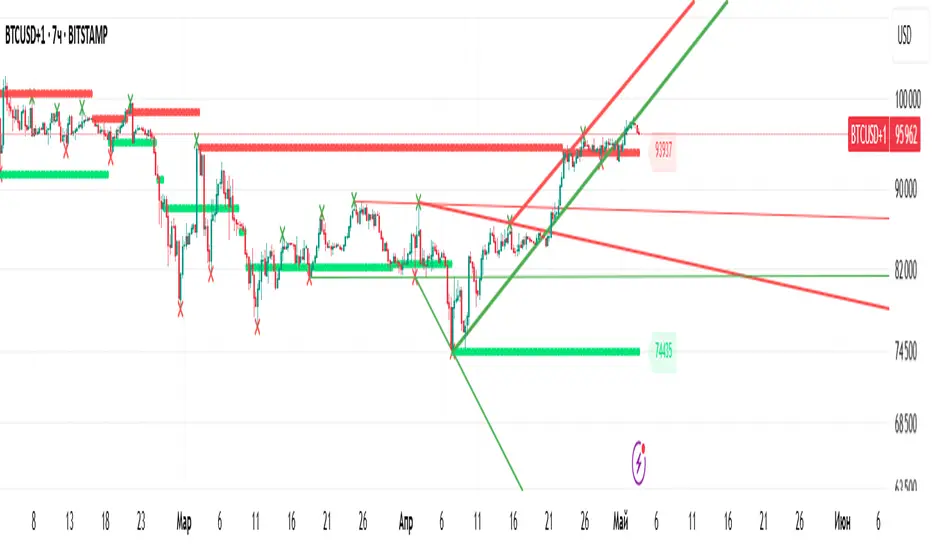
Smart Trend Tracker Name: Smart Trend Tracker
Description:
The Smart Trend Tracker indicator is designed to analyze market cycles and identify key trend reversal points. It automatically marks support and resistance levels based on price dynamics, helping traders better navigate market structure.
Application:
Trend Analysis: The indicator helps determine when a trend may be nearing a reversal, which is useful for making entry or exit decisions.
Support and Resistance Levels: Automatically marks key levels, simplifying chart analysis.
Reversal Signals: Provides visual signals for potential reversal points, which can be used for counter-trend trading strategies.
How It Works:
Candlestick Sequence Analysis: The indicator tracks the number of consecutive candles in one direction (up or down). If the price continues to move N bars in a row in one direction, the system records this as an impulse phase.
Trend Exhaustion Detection: After a series of directional bars, the market may reach an overbought or oversold point. If the price continues to move in the same direction but with weakening momentum, the indicator records a possible trend slowdown.
Chart Display: The indicator marks potential reversal points with numbers or special markers. It can also display support and resistance levels based on key cycle points.
Settings:
Cycle Length: The number of bars after which the possibility of a reversal is assessed.
Trend Sensitivity: A parameter that adjusts sensitivity to trend movements.
Dynamic Levels: Setting for displaying key levels.
Название: Smart Trend Tracker
Описание:
Индикатор Smart Trend Tracker предназначен для анализа рыночных циклов и выявления ключевых точек разворота тренда. Он автоматически размечает уровни поддержки и сопротивления, основываясь на динамике цены, что помогает трейдерам лучше ориентироваться в структуре рынка.
Применение:
Анализ трендов: Индикатор помогает определить моменты, когда тренд может быть близок к развороту, что полезно для принятия решений о входе или выходе из позиции.
Определение уровней поддержки и сопротивления: Автоматически размечает ключевые уровни, что упрощает анализ графика.
Сигналы разворота: Индикатор предоставляет визуальные сигналы о возможных точках разворота, что может быть использовано для стратегий, основанных на контртрендовой торговле.
Как работает:
Анализ последовательности свечей: Индикатор отслеживает количество последовательных свечей в одном направлении (вверх или вниз). Если цена продолжает движение N баров подряд в одном направлении, система фиксирует это как импульсную фазу.
Выявление истощения тренда: После серии направленных баров рынок может достичь точки перегрева. Если цена продолжает двигаться в том же направлении, но с ослаблением импульса, индикатор фиксирует возможное замедление тренда.
Отображение на графике: Индикатор отмечает точки потенциального разворота номерами или специальными маркерами. Также возможен вывод уровней поддержки и сопротивления, основанных на ключевых точках цикла.
Настройки:
Длина цикла (Cycle Length): Количество баров, после которых оценивается возможность разворота.
Фильтрация тренда (Trend Sensitivity): Параметр, регулирующий чувствительность к трендовым движениям.
Уровни поддержки/сопротивления (Dynamic Levels): Настройка для отображения ключевых уровней.
Buy on VolumeThis script has several weaknesses:
1. **Overly Simplistic Logic** – The buy signal is based on just two conditions (DEMA crossing above a Lorentzian Line and a volume spike), which may not be robust enough for real trading conditions.
2. **Lack of Sell Signals** – The script only focuses on buy signals without any exit strategy, making it incomplete for practical trading.
3. **Volume Confirmation May Be Unreliable** – The threshold for volume confirmation (50% above average) is arbitrary and may produce frequent false positives or fail in low-liquidity conditions.
4. **No Risk Management** – There is no stop-loss, take-profit, or risk-adjustment mechanism, making it unsuitable for serious trading.
5. **Potential for Late Entries** – The reliance on moving averages (DEMA) can introduce lag, causing buy signals to appear late after a price move has already occurred.
6. **Limited Adaptability** – The fixed parameter settings (e.g., DEMA period of 6, Lorentzian length of 21) may not work across different market conditions or assets.
7. **No Consideration for Market Trends** – The script does not account for broader market trends, which could lead to poor entries in bearish conditions.
8. **Visual Clutter** – The plotted signals and indicators might create unnecessary chart noise, making it difficult to analyze price action effectively.
9. **Alert Spam Potential** – Without additional filtering conditions, the script may trigger frequent buy alerts, leading to signal fatigue.

Full Moon and New Moon IndicatorThe Full Moon & New Moon Indicator is a custom Pine Script indicator which marks Full Moon (Pournami) and New Moon (Amavasya) events on the price chart. This indicator helps traders who incorporate lunar cycles into their market analysis, as certain traders believe these cycles influence market sentiment and price action. The current script is added for the year 2024 and 2025 and the dates are considered as per the Telugu calendar.
Features
✅ Identifies and labels Full Moon & New Moon days on the chart for the year 2024 and 2025
How it Works!
On a Full Moon day, it places a yellow label ("Pournami") above the corresponding candle.
On a New Moon day, it places a blue label ("Amavasya") above the corresponding candle.
Example Usage
When a Full Moon label appears, check for potential trend reversals or high volatility.
When a New Moon label appears, watch for market consolidation or a shift in sentiment.
Combine with candlestick patterns, support/resistance, or momentum indicators for a stronger trading setup.
🚀 Add this indicator to your TradingView chart and explore the market’s reaction to lunar cycles! 🌕

US 20Y Treasury YieldWhat This Indicator Does
This Pine Script creates a custom indicator for TradingView that displays the US 20-Year Treasury Yield (US20Y) on your chart. Here's what it does step by step:
1. What Is the US 20-Year Treasury Yield?
The US 20-Year Treasury Yield is a financial metric that shows the interest rate (or yield) investors earn when they buy US government bonds that mature in 20 years. It’s an important indicator of the economy and can influence other markets like stocks, bonds, and currencies.
2. How Does the Indicator Work?
The indicator fetches the latest data for the US 20-Year Treasury Yield from TradingView's database.
It then plots this data in a separate pane below your main chart, so you can easily monitor the yield without cluttering your price chart.
3. What Does the Indicator Show?
A blue line is drawn in the separate pane, showing the movement of the US 20-Year Treasury Yield over time.
A gray dashed line is added at the 4.0% level as a reference point. You can use this line to quickly see when the yield is above or below 4.0%.
5. Why Use This Indicator?
Monitor Economic Trends : The US 20-Year Treasury Yield is a key economic indicator. By plotting it on your chart, you can stay informed about changes in interest rates and their potential impact on other markets.

[COG]StochRSI Zenith📊 StochRSI Zenith
This indicator combines the traditional Stochastic RSI with enhanced visualization features and multi-timeframe analysis capabilities. It's designed to provide traders with a comprehensive view of market conditions through various technical components.
🔑 Key Features:
• Advanced StochRSI Implementation
- Customizable RSI and Stochastic calculation periods
- Multiple moving average type options (SMA, EMA, SMMA, LWMA)
- Adjustable signal line parameters
• Visual Enhancement System
- Dynamic wave effect visualization
- Energy field display for momentum visualization
- Customizable color schemes for bullish and bearish signals
- Adaptive transparency settings
• Multi-Timeframe Analysis
- Higher timeframe confirmation
- Synchronized market structure analysis
- Cross-timeframe signal validation
• Divergence Detection
- Automated bullish and bearish divergence identification
- Customizable lookback period
- Clear visual signals for confirmed divergences
• Signal Generation Framework
- Price action confirmation
- SMA-based trend filtering
- Multiple confirmation levels for reduced noise
- Clear entry signals with customizable display options
📈 Technical Components:
1. Core Oscillator
- Base calculation: 13-period RSI (adjustable)
- Stochastic calculation: 8-period (adjustable)
- Signal lines: 5,3 smoothing (adjustable)
2. Visual Systems
- Wave effect with three layers of visualization
- Energy field display with dynamic intensity
- Reference bands at 20/30/50/70/80 levels
3. Confirmation Mechanisms
- SMA trend filter
- Higher timeframe alignment
- Price action validation
- Divergence confirmation
⚙️ Customization Options:
• Visual Parameters
- Wave effect intensity and speed
- Energy field sensitivity
- Color schemes for bullish/bearish signals
- Signal display preferences
• Technical Parameters
- All core calculation periods
- Moving average types
- Divergence detection settings
- Signal confirmation criteria
• Display Settings
- Chart and indicator signal placement
- SMA line visualization
- Background highlighting options
- Label positioning and size
🔍 Technical Implementation:
The indicator combines several advanced techniques to generate signals. Here are key components with code examples:
1. Core StochRSI Calculation:
// Base RSI calculation
rsi = ta.rsi(close, rsi_length)
// StochRSI transformation
stochRSI = ((ta.highest(rsi, stoch_length) - ta.lowest(rsi, stoch_length)) != 0) ?
(100 * (rsi - ta.lowest(rsi, stoch_length))) /
(ta.highest(rsi, stoch_length) - ta.lowest(rsi, stoch_length)) : 0
2. Signal Generation System:
// Core signal conditions
crossover_buy = crossOver(sk, sd, cross_threshold)
valid_buy_zone = sk < 30 and sd < 30
price_within_sma_bands = close <= sma_high and close >= sma_low
// Enhanced signal generation
if crossover_buy and valid_buy_zone and price_within_sma_bands and htf_allows_long
if is_bullish_candle
long_signal := true
else
awaiting_bull_confirmation := true
3. Multi-Timeframe Analysis:
= request.security(syminfo.tickerid, mtf_period,
)
The HTF filter looks at a higher timeframe (default: 4H) to confirm the trend
It only allows:
Long trades when the higher timeframe is bullish
Short trades when the higher timeframe is bearish
📈 Trading Application Guide:
1. Signal Identification
• Oversold Opportunities (< 30 level)
- Look for bullish crosses of K-line above D-line
- Confirm with higher timeframe alignment
- Wait for price action confirmation (bullish candle)
• Overbought Conditions (> 70 level)
- Watch for bearish crosses of K-line below D-line
- Verify higher timeframe condition
- Confirm with bearish price action
2. Divergence Trading
• Bullish Divergence
- Price makes lower lows while indicator makes higher lows
- Most effective when occurring in oversold territory
- Use with support levels for entry timing
• Bearish Divergence
- Price makes higher highs while indicator shows lower highs
- Most reliable in overbought conditions
- Combine with resistance levels
3. Wave Effect Analysis
• Strong Waves
- Multiple wave lines moving in same direction indicate momentum
- Wider wave spread suggests increased volatility
- Use for trend strength confirmation
• Energy Field
- Higher intensity in trading zones suggests stronger moves
- Use for momentum confirmation
- Watch for energy field convergence with price action
The energy field is like a heat map that shows momentum strength
It gets stronger (more visible) when:
Price is in oversold (<30) or overbought (>70) zones
The indicator lines are moving apart quickly
A strong signal is forming
Think of it as a "strength meter" - the more visible the energy field, the stronger the potential move
4. Risk Management Integration
• Entry Confirmation
- Wait for all signal components to align
- Use higher timeframe for trend direction
- Confirm with price action and SMA positions
• Stop Loss Placement
- Consider placing stops beyond recent swing points
- Use ATR for dynamic stop calculation
- Account for market volatility
5. Position Management
• Partial Profit Taking
- Consider scaling out at overbought/oversold levels
- Use wave effect intensity for exit timing
- Monitor energy field for momentum shifts
• Trade Duration
- Short-term: Use primary signals in trading zones
- Swing trades: Focus on divergence signals
- Position trades: Utilize higher timeframe signals
⚠️ Important Usage Notes:
• Avoid:
- Trading against strong trends
- Relying solely on single signals
- Ignoring higher timeframe context
- Over-leveraging based on signals
Remember: This tool is designed to assist in analysis but should never be used as the sole decision-maker for trades. Always maintain proper risk management and combine with other forms of analysis.

[SHORT ONLY] 10 Bar Low Pullback█ STRATEGY DESCRIPTION
The "10 Bar Low Pullback" strategy is a contrarian short trading system designed to capture pullbacks after a new 10‐bar low is made. it identifies a potential short opportunity when the current bar’s low breaks below the lowest low of the previous 10 bars, provided that the bar exhibits strong internal momentum as measured by its IBS value. An optional trend filter further refines entries by requiring that the close is below a 200-period EMA.
█ WHAT IS INTERNAL BAR STRENGTH (IBS)?
Internal Bar Strength (IBS) measures where the closing price falls within the high-low range of a bar. It is calculated as:
ibs = (close - low) / (high - low)
- Low IBS (≤ 0.2): Indicates the close is near the bar's low, suggesting oversold conditions.
- High IBS (≥ 0.8): Indicates the close is near the bar's high, suggesting overbought conditions.
█ SIGNAL GENERATION
1. SHORT ENTRY
A Short Signal is triggered when:
The current bar’s low is below the lowest low of the past X bars (default: 10).
The bar’s IBS is greater than the specified threshold (default: 0.85).
The signal occurs within the defined trading window (between Start Time and End Time).
If the EMA Filter is enabled, the close must be below the 200-period EMA.
2. EXIT CONDITION
An exit Signal is generated when the current close falls below the previous bar’s low (close < low ), indicating a potential bearish reversal and prompting the strategy to close its short position.
█ ADDITIONAL SETTINGS
Lookback Period: Defines the number of bars (default is 10) over which the lowest low is calculated.
IBS Threshold: Sets the minimum required IBS value (default is 0.85) to qualify as a pullback.
Trading Window: Trades are only executed between the user-defined Start Time and End Time.
EMA Filter (Optional): When enabled, short entries are only considered if the current close is below the 200-period EMA, with the EMA period being adjustable (default is 200).
█ PERFORMANCE OVERVIEW
Designed for shorting opportunities, this strategy aims to capture pullbacks following an aggressive 10-bar low break.
It leverages a combination of a lookback low and IBS measurement to identify overextended bullish moves that may revert.
The optional EMA filter helps confirm a bearish market environment by ensuring the price remains under the trend line.
Suitable for use on various assets, including stocks and ETFs, on daily or similar timeframes.
Backtesting and parameter optimization are recommended to tailor the strategy to specific market conditions.

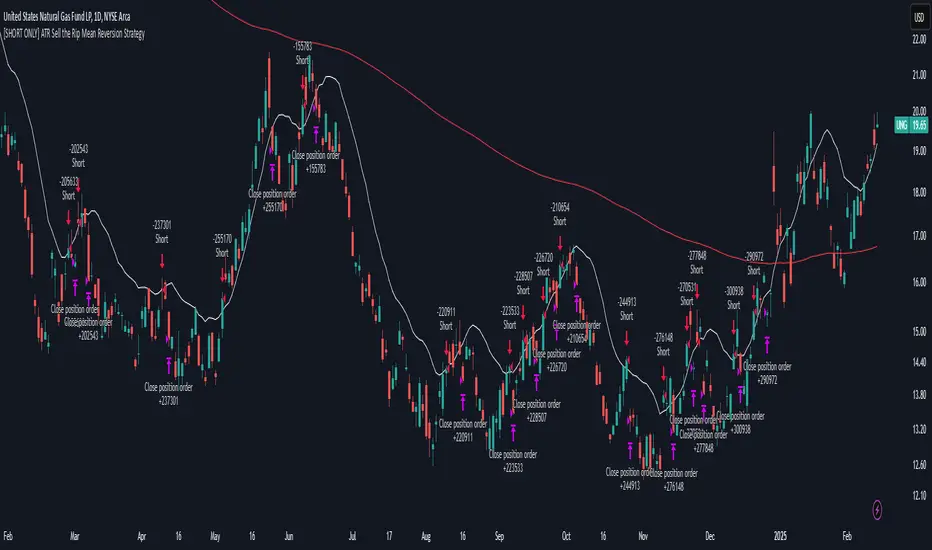
[SHORT ONLY] ATR Sell the Rip Mean Reversion Strategy█ STRATEGY DESCRIPTION
The "ATR Sell the Rip Mean Reversion Strategy" is a contrarian system that targets overextended price moves on stocks and ETFs. It calculates an ATR‐based trigger level to identify shorting opportunities. When the current close exceeds this smoothed ATR trigger, and if the close is below a 200-period EMA (if enabled), the strategy initiates a short entry, aiming to profit from an anticipated corrective pullback.
█ HOW IS THE ATR SIGNAL BAND CALCULATED?
This strategy computes an ATR-based signal trigger as follows:
Calculate the ATR
The strategy computes the Average True Range (ATR) using a configurable period provided by the user:
atrValue = ta.atr(atrPeriod)
Determine the Threshold
Multiply the ATR by a predefined multiplier and add it to the current close:
atrThreshold = close + atrValue * atrMultInput
Smooth the Threshold
Apply a Simple Moving Average over a specified period to smooth out the threshold, reducing noise:
signalTrigger = ta.sma(atrThreshold, smoothPeriodInput)
█ SIGNAL GENERATION
1. SHORT ENTRY
A Short Signal is triggered when:
The current close is above the smoothed ATR signal trigger.
The trade occurs within the specified trading window (between Start Time and End Time).
If the EMA filter is enabled, the close must also be below the 200-period EMA.
2. EXIT CONDITION
An exit Signal is generated when the current close falls below the previous bar’s low (close < low ), indicating a potential bearish reversal and prompting the strategy to close its short position.
█ ADDITIONAL SETTINGS
ATR Period: The period used to calculate the ATR, allowing for adaptability to different volatility conditions (default is 20).
ATR Multiplier: The multiplier applied to the ATR to determine the raw threshold (default is 1.0).
Smoothing Period: The period over which the raw ATR threshold is smoothed using an SMA (default is 10).
Start Time and End Time: Defines the time window during which trades are allowed.
EMA Filter (Optional): When enabled, short entries are only executed if the current close is below the 200-period EMA, confirming a bearish trend.
█ PERFORMANCE OVERVIEW
This strategy is designed for use on the Daily timeframe, targeting stocks and ETFs by capitalizing on overextended price moves.
It utilizes a dynamic, ATR-based trigger to identify when prices have potentially peaked, setting the stage for a mean reversion short entry.
The optional EMA filter helps align trades with broader market trends, potentially reducing false signals.
Backtesting is recommended to fine-tune the ATR multiplier, smoothing period, and EMA settings to match the volatility and behavior of specific markets.
[SHORT ONLY] Consecutive Bars Above MA Strategy█ STRATEGY DESCRIPTION
The "Consecutive Bars Above MA Strategy" is a contrarian trading system aimed at exploiting overextended bullish moves in stocks and ETFs. It monitors the number of consecutive bars that close above a chosen short-term moving average (which can be either a Simple Moving Average or an Exponential Moving Average). Once the count reaches a preset threshold and the current bar’s close exceeds the previous bar’s high within a designated trading window, a short entry is initiated. An optional EMA filter further refines entries by requiring that the current close is below the 200-period EMA, helping to ensure that trades are taken in a bearish environment.
█ HOW ARE THE CONSECUTIVE BULLISH COUNTS CALCULATED?
The strategy utilizes a counter variable, `bullCount`, to track consecutive bullish bars based on their relation to the short-term moving average. Here’s how the count is determined:
Initialize the Counter
The counter is initialized at the start:
var int bullCount = na
Bullish Bar Detection
For each bar, if the close is above the selected moving average (either SMA or EMA, based on user input), the counter is incremented:
bullCount := close > signalMa ? (na(bullCount) ? 1 : bullCount + 1) : 0
Reset on Non-Bullish Condition
If the close does not exceed the moving average, the counter resets to zero, indicating a break in the consecutive bullish streak.
█ SIGNAL GENERATION
1. SHORT ENTRY
A short signal is generated when:
The number of consecutive bullish bars (i.e., bars closing above the short-term MA) meets or exceeds the defined threshold (default: 3).
The current bar’s close is higher than the previous bar’s high.
The signal occurs within the specified trading window (between Start Time and End Time).
Additionally, if the EMA filter is enabled, the entry is only executed when the current close is below the 200-period EMA.
2. EXIT CONDITION
An exit signal is triggered when the current close falls below the previous bar’s low, prompting the strategy to close the short position.
█ ADDITIONAL SETTINGS
Threshold: The number of consecutive bullish bars required to trigger a short entry (default is 3).
Trading Window: The Start Time and End Time inputs define when the strategy is active.
Moving Average Settings: Choose between SMA and EMA, and set the MA length (default is 5), which is used to assess each bar’s bullish condition.
EMA Filter (Optional): When enabled, this filter requires that the current close is below the 200-period EMA, supporting entries in a downtrend.
█ PERFORMANCE OVERVIEW
This strategy is designed for stocks and ETFs and can be applied across various timeframes.
It seeks to capture mean reversion by shorting after a series of bullish bars suggests an overextended move.
The approach employs a contrarian short entry by waiting for a breakout (close > previous high) following consecutive bullish bars.
The adjustable moving average settings and optional EMA filter allow for further optimization based on market conditions.
Comprehensive backtesting is recommended to fine-tune the threshold, moving average parameters, and filter settings for optimal performance.

[SHORT ONLY] Consecutive Close>High[1] Mean Reversion Strategy█ STRATEGY DESCRIPTION
The "Consecutive Close > High " Mean Reversion Strategy is a contrarian daily trading system for stocks and ETFs. It identifies potential shorting opportunities by counting consecutive days where the closing price exceeds the previous day's high. When this consecutive day count reaches a predetermined threshold, and if the close is below a 200-period EMA (if enabled), a short entry is triggered, anticipating a corrective pullback.
█ HOW ARE THE CONSECUTIVE BULLISH COUNTS CALCULATED?
The strategy uses a counter variable called `bullCount` to track how many consecutive bars meet a bullish condition. Here’s a breakdown of the process:
Initialize the Counter
var int bullCount = 0
Bullish Bar Detection
Every time the close exceeds the previous bar's high, increment the counter:
if close > high
bullCount += 1
Reset on Bearish Bar
When there is a clear bearish reversal, the counter is reset to zero:
if close < low
bullCount := 0
█ SIGNAL GENERATION
1. SHORT ENTRY
A Short Signal is triggered when:
The count of consecutive bullish closes (where close > high ) reaches or exceeds the defined threshold (default: 3).
The signal occurs within the specified trading window (between Start Time and End Time).
2. EXIT CONDITION
An exit Signal is generated when the current close falls below the previous bar’s low (close < low ), prompting the strategy to exit the position.
█ ADDITIONAL SETTINGS
Threshold: The number of consecutive bullish closes required to trigger a short entry (default is 3).
Start Time and End Time: The time window during which the strategy is allowed to execute trades.
EMA Filter (Optional): When enabled, short entries are only triggered if the current close is below the 200-period EMA.
█ PERFORMANCE OVERVIEW
This strategy is designed for Stocks and ETFs on the Daily timeframe and targets overextended bullish moves.
It aims to capture mean reversion by entering short after a series of consecutive bullish closes.
Further optimization is possible with additional filters (e.g., EMA, volume, or volatility).
Backtesting should be used to fine-tune the threshold and filter settings for specific market conditions.

[SHORT ONLY] Internal Bar Strength (IBS) Mean Reversion Strategy█ STRATEGY DESCRIPTION
The "Internal Bar Strength (IBS) Strategy" is a mean-reversion strategy designed to identify trading opportunities based on the closing price's position within the daily price range. It enters a short position when the IBS indicates overbought conditions and exits when the IBS reaches oversold levels. This strategy is Short-Only and was designed to be used on the Daily timeframe for Stocks and ETFs.
█ WHAT IS INTERNAL BAR STRENGTH (IBS)?
Internal Bar Strength (IBS) measures where the closing price falls within the high-low range of a bar. It is calculated as:
IBS = (Close - Low) / (High - Low)
- Low IBS (≤ 0.2) : Indicates the close is near the bar's low, suggesting oversold conditions.
- High IBS (≥ 0.8) : Indicates the close is near the bar's high, suggesting overbought conditions.
█ SIGNAL GENERATION
1. SHORT ENTRY
A Short Signal is triggered when:
The IBS value rises to or above the Upper Threshold (default: 0.9).
The Closing price is greater than the previous bars High (close>high ).
The signal occurs within the specified time window (between `Start Time` and `End Time`).
2. EXIT CONDITION
An exit Signal is generated when the IBS value drops to or below the Lower Threshold (default: 0.3). This prompts the strategy to exit the position.
█ ADDITIONAL SETTINGS
Upper Threshold: The IBS level at which the strategy enters trades. Default is 0.9.
Lower Threshold: The IBS level at which the strategy exits short positions. Default is 0.3.
Start Time and End Time: The time window during which the strategy is allowed to execute trades.
█ PERFORMANCE OVERVIEW
This strategy is designed for Stocks and ETFs markets and performs best when prices frequently revert to the mean.
The strategy can be optimized further using additional conditions such as using volume or volatility filters.
It is sensitive to extreme IBS values, which help identify potential reversals.
Backtesting results should be analyzed to optimize the Upper/Lower Thresholds for specific instruments and market conditions.

IPO Date ScreenerThis script, the IPO Date Screener, allows traders to visually identify stocks that are relatively new, based on the number of bars (days) since their IPO. The user can set a custom threshold for the number of days (bars) after the IPO, and the script will highlight new stocks that fall below that threshold.
Key Features:
Customizable IPO Days Threshold: Set the threshold for considering a stock as "new." Since Pine screener limits number bars to 500, it will work for stocks having trading days below 500 since IPO which almost 2 years.
Column Days since IPO: Sort this column from low to high to see newest to oldest STOCK with 500 days of trading.
Since a watchlist is limited to 1000 stocks, use this pines script to screen stocks within the watch list having trading days below 500 or user can select lower number of days from settings.
This is not helpful to add on chart, this is to use on pine screener as utility.

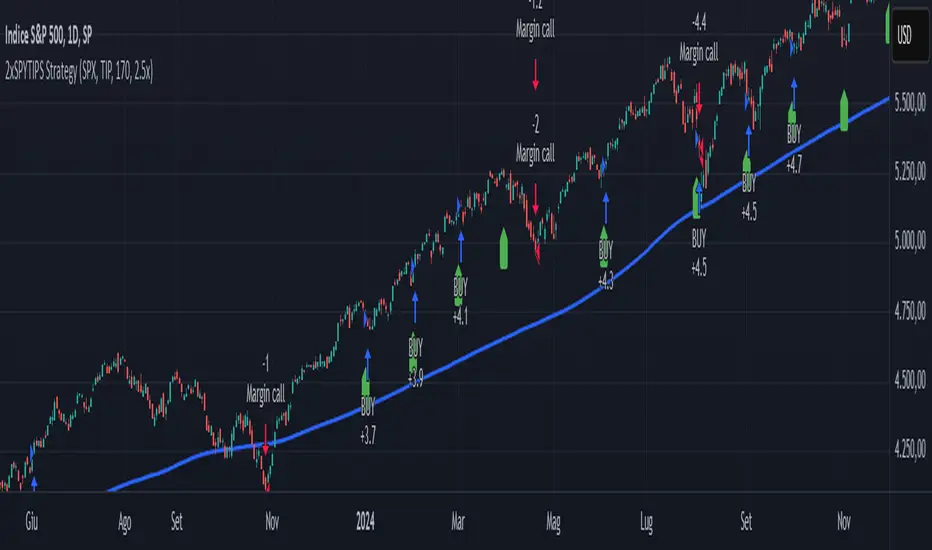
2xSPYTIPS Strategy by Fra public versionThis is a test strategy with S&P500, open source so everyone can suggest everything, I'm open to any advice.
Rules of the "2xSPYTIPS" Strategy :
This trading strategy is designed to operate on the S&P 500 index and the TIPS ETF. Here’s how it works:
1. Buy Conditions ("BUY"):
- The S&P 500 must be above its **200-day simple moving average (SMA 200)**.
- This condition is checked at the **end of each month**.
2. Position Management:
- If leverage is enabled (**2x leverage**), the purchase quantity is increased based on a configurable percentage.
3. Take Profit:
- A **Take Profit** is set at a fixed percentage above the entry price.
4. Visualization & Alerts:
- The **SMA 200** for both S&P 500 and TIPS is plotted on the chart.
- A **BUY signal** appears visually and an alert is triggered.
What This Strategy Does NOT Do
- It does not use a **Stop Loss** or **Trailing Stop**.
- It does not directly manage position exits except through Take Profit.
Full Cycle Valuation | QuantumResearchQuantumResearch Full Cycle Valuation Indicator for BTC only!
The Full Cycle Valuation indicator is an advanced on-chain valuation model that synthesizes multiple fundamental Bitcoin metrics into a single, normalized score.
By leveraging Power Law Corridor, Pi Cycle Top, Crosby Ratio, MVRV Z-Score, SOPR Z-Score, NUPL Z-Score, BAERM, and other key valuation signals, this tool provides traders and investors with an intuitive way to assess Bitcoin’s market cycle positioning and identify potential overbought or undervalued conditions. 🚀📊
1. Overview
This indicator helps users:
Identify Market Cycles – Uses a blend of statistical and fundamental models to determine whether Bitcoin is undervalued or overvalued.🔄
Normalize On-Chain & Valuation Metrics – Standardizes multiple valuation indicators through Z-score transformation for clearer insights📉📈
Assess Risk & Reward – Generates an Average Valuation Z-score, offering a high-level overview of current market positioning. ⚖️
Customize Visual Preferences – Dynamic color-coded signals, background fills, and table-based valuation metrics enhance usability. 🎨
2. How It Works
A. Power Law Corridor
The Power Law Model provides a long-term price corridor for Bitcoin based on a logarithmic regression formula. 🔢
The indicator evaluates where the current price sits relative to the Power Law Support & Resistance levels. 📊
Normalized Z-score Calculation: A standardized metric indicating overvaluation or undervaluation. 🎯
B. Pi Cycle Top
Uses the 111-day and 350-day moving averages to identify cyclical market peaks. 🔺
Generates a Z-score that measures deviation from historical overbought conditions. ⚠️
C. Crosby Ratio
Measures market momentum by analyzing Heikin-Ashi candle trends and ATR-based volatility. 📊
Provides a weekly trend strength score that is normalized into a Z-score. 📈
D. MVRV Z-Score
Compares Bitcoin's Market Cap to Realized Cap to assess whether price is above or below fair value. 💰
The higher the MVRV Z-score, the more overvalued Bitcoin is; lower scores indicate undervaluation. 🔻
E. SOPR Z-Score
Spent Output Profit Ratio (SOPR) measures profit-taking behavior in the market. 💵
SOPR is smoothed and standardized to filter out noise and highlight macro trends. 📊
F. NUPL Z-Score
Net Unrealized Profit/Loss (NUPL) calculates the proportion of coins held in profit versus loss. 📉📈
High Z-score values indicate speculative euphoria, while low values suggest capitulation. ⚠️
G. BAERM (Bitcoin AR Model)
BAERM is a statistical model that incorporates Bitcoin's supply, halvings, and historical growth trends to estimate fair value. 📉
This model is adjusted with a damping function to remove excess noise. 🎛️
H. Composite Full Cycle Z-Score
The indicator calculates a weighted average Z-score across all valuation models to generate a final Full Cycle Valuation Score. 📊
The score is used to define five distinct market states:
Very Undervalued (-3 to -2 Z-score): Ideal accumulation zone. 🟢
Undervalued (-2 to -1.5 Z-score): Accumulate Bitcoin at a discount. 🔵
Neutral (-1.5 to +1.5 Z-score): Fair market conditions. ⚪
Overheated (+1.5 to +2 Z-score): Potential distribution phase. 🟠
Very Overheated (>2 Z-score): High risk of market tops. 🔴
3. Visual Representation
This indicator offers multiple dynamic visual elements to improve clarity and ease of use:
Color-Coded Background Fill
Green Background – Indicates undervalued market conditions (Accumulation). 🟢
Blue Background – Signals overheated conditions (Distribution). 🔵
Table Display for Z-Scores
Displays each individual valuation model’s Z-score in a compact, color-coded format. 📊
The final average Z-score is highlighted, along with a corresponding market action recommendation. 🎯
4. Customization & Parameters
Traders and analysts can fine-tune the Full Cycle Valuation indicator to match their specific strategies:
On-Chain Valuation Metrics MVRV, SOPR, and NUPL Z-score lengths can be adjusted for different market perspectives.
Market Cycle Models Power Law Corridor: Adjustable regression parameters to modify long-term projections.
Pi Cycle & Crosby Ratio: Customizable smoothing lengths.
Threshold Adjustments Modify overvaluation and undervaluation thresholds to fine-tune signal sensitivity.
Visual Settings
Valuation Mode: Allows traders to switch between default mode and valuation-focused color themes. 🎨
5. Trading Applications
This indicator is not just for trading—it serves as a powerful macro analysis tool:
Long-Term Investing – Helps Bitcoin investors identify key accumulation and distribution phases. 📈
Market Timing – Guides traders in recognizing overbought and oversold conditions based on fundamental valuation. ⏳
Risk Management – Provides a systematic way to assess whether Bitcoin is fundamentally cheap or expensive. ⚠️
Cyclical Trend Analysis – Helps long-term investors compare past market cycles and spot repeating patterns. 🔄
6. Final Thoughts
The Full Cycle Valuation Indicator is a comprehensive macro valuation tool that combines multiple on-chain, statistical, and fundamental models into one easy-to-interpret score.
Whether you are a long-term investor looking to time Bitcoin cycles or a trader searching for additional confluence, this tool offers invaluable insights.
Important Disclaimer: No indicator can predict future price action with certainty. Always perform additional research and use proper risk management when making investment decisions. ⚠️📊

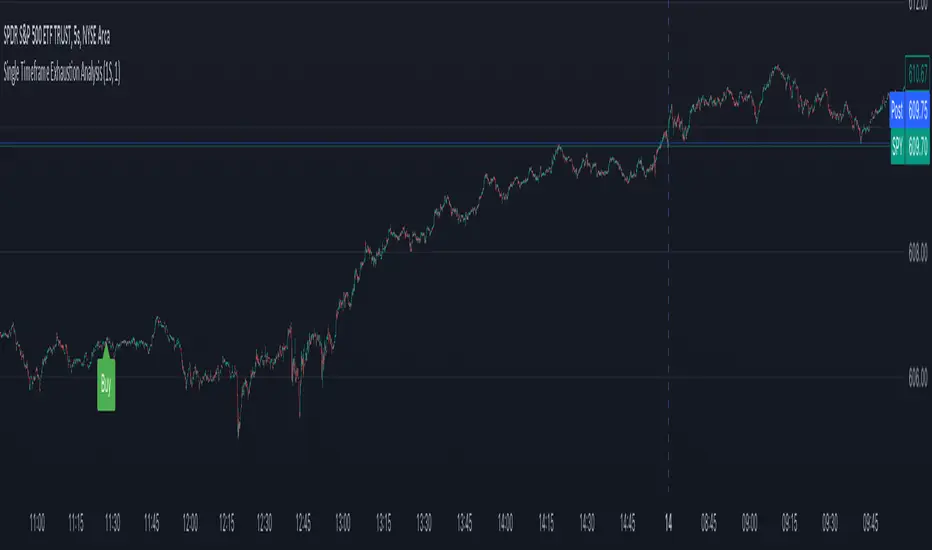
Exhaustion Analysis - Bullish and Bearish Exhaustion Points Single Timeframe Exhaustion Analysis is an advanced Pine Script trading tool meticulously designed to provide traders with granular insights into market exhaustion and potential reversals by leveraging data from a single lower timeframe.
This script utilizes the request.security_lower_tf() function to pull high, low, close, and volume data from a user-specified lower timeframe, ensuring that the analysis is rooted in detailed, intraday price action rather than broader, less responsive data points.
At the heart of this indicator is a multi-faceted approach to market analysis, employing several key metrics that evaluate market efficiency, directional volume imbalances, and volume-to-price relationships.
The script calculates price efficiency as the relative movement of price compared to traded volume, offering a measure of how efficiently the market is absorbing buy and sell orders.
Directional imbalance is assessed by examining the dominance between buy-side and sell-side volumes, while volume-to-price ratios provide insight into the intensity of trading activity relative to price fluctuations.
Each of these metrics is computed across the entire range of lower timeframe data, generating individual values that are then aggregated and normalized.This normalization process ensures that no single metric dominates the analysis, instead creating a balanced composite view of market conditions.
The script’s normalization method scales these metrics into proportional ratios, allowing for consistent comparison across varying market states and ensuring adaptability in dynamic trading environments.
To enhance its detection capabilities, the indicator incorporates a multi-layered composite scoring system.
Three distinct composite scores are derived, each placing different emphasis on various market metrics, ranging from price efficiency and directional imbalance to volume dynamics and rate-of-change acceleration.These composite scores are then combined into a final composite score, which serves as the foundation for the script’s exhaustion and reversal detection logic.The script identifies exhaustion by comparing the final composite score against a historical percentile-based threshold, dynamically calculated over an extensive lookback period.
When market conditions reflect extreme exhaustion—either due to rapid price movements, volume surges, or directional imbalances—the script flags potential reversal zones.These exhaustion flags are visually represented as histogram plots, providing clear, real-time indicators of emerging market fatigue.
In addition to exhaustion detection, the indicator assesses potential directional reversals by integrating volatility-based range calculations.Utilizing a rolling average of price ranges, the script detects instances where the market breaks beyond typical price boundaries, signaling possible trend reversals.
Buy signals are generated when the price breaks above the previous high plus an adaptive range during periods of exhaustion, while sell signals occur when the price drops below the previous low minus the adaptive range under similar exhausted conditions.
To enhance usability, the script visually presents its analysis through multiple plots, including histogram representations of exhaustion flags, upward and downward reversal indicators, and the continuously updating final composite score.
Labels are dynamically added to the chart, marking buy and sell opportunities, ensuring that traders have clear, actionable insights at their fingertips.This script stands out for its meticulous use of lower timeframe data, comprehensive market metrics, and dynamic exhaustion detection, making it a valuable tool for traders looking to identify high-probability reversal points with precision and confidence.
Blockchain Fundamentals: Liquidity Cycle MomentumLiquidity Cycle Momentum Indicator
Overview:
This indicator analyzes global liquidity trends by calculating a unique Liquidity Index and measuring its year-over-year (YoY) percentage change. It then applies a momentum oscillator to the YoY change, providing insights into the cyclical momentum of liquidity. The indicator incorporates a limited historical data workaround to ensure accurate calculations even when the chart’s history is short.
Features Breakdown:
1. Limited Historical Data Workaround
Function: The limit(length) function adjusts the lookback period when there isn’t enough historical data (i.e., near the beginning of the chart), ensuring that calculations do not break due to insufficient data.
2. Global Liquidity Calculation
Data Sources:
TVC:CN10Y (10-year yield from China)
TVC:DXY (US Dollar Index)
ECONOMICS:USCBBS (US Central Bank Balance Sheet)
FRED:JPNASSETS (Japanese assets)
ECONOMICS:CNCBBS (Chinese Central Bank Balance Sheet)
FRED:ECBASSETSW (ECB assets)
Calculation Methodology:
A ratio is computed (cn10y / dxy) to adjust for currency influences.
The Liquidity Index is then derived by multiplying this ratio with the sum of the other liquidity components.
3. Year-over-Year (YoY) Percent Change
Computation:
The indicator determines the number of bars that approximately represent one year.
It then compares the current Liquidity Index to its value one year ago, calculating the YoY percentage change.
4. Momentum Oscillator on YoY Change
Oscillator Components:
1. Calculated using the Chande Momentum Oscillator (CMO) applied to the YoY percent change with a user-defined momentum length.
2. A weighted moving average (WMA) that smooths the momentum signal.
3. Overbought and Oversold zones
Signal Generation:
Buy Signal: Triggered when the momentum crosses upward from an oversold condition, suggesting a potential upward shift in liquidity momentum.
Sell Signal: Triggered when crosses below an overbought condition, indicating potential downward momentum.
State Management:
The indicator maintains a state variable to avoid repeated signals, ensuring that a new buy or sell signal is only generated when there’s a clear change in momentum.
5. Visual Presentation and Alerts
Plots:
The oscillator value and signalline are plotted for visual analysis.
Overbought and oversold levels are marked with dashed horizontal lines.
Signal Markers:
Buy and sell signals are marked with green and maroon circles, respectively.
Background Coloration:
Optionally, the chart’s background bars are colored (yellow for buy signals and fuchsia for sell signals) to enhance visual cues when signals are triggered.
Conclusion
In summary, the Liquidity Cycle Momentum Indicator provides a robust framework to analyze liquidity trends by combining global liquidity data, YoY changes, and momentum oscillation. This makes it an effective tool for traders and analysts looking to identify cyclical shifts in liquidity conditions and potential turning points in the market.

ICT First Presented FVG - NY Open [LuckyAlgo]
This indicator identifies the first Fair Value Gap (FVG) that occurs during the New York trading session, combined with NY session opening price levels. It's an essential tool for traders who follow ICT concepts and focus on the NY trading session.
ICT refers to this as the First Presented FVG, while other traders may call it the 9:30 FVG.
This indicator is best for the 1 minute timeframe, while 5 minute also works.
Detects and marks the first FVG of the NY session
Displays both bullish (green) and bearish (red) FVGs with customizable transparency
Shows the NY session opening price with clear labels
Includes optional vertical line at 9:30 AM NY open
Maintains clean chart visibility with adjustable maximum display days
Includes session date and time labels for easy reference
The indicator helps traders identify potential reversal zones and continuation opportunities by combining two powerful concepts: Fair Value Gaps and NY session opening price. This makes it particularly valuable for day traders and swing traders who want to capitalize on institutional order flow patterns during the most liquid trading session.
You can customize the indicator's appearance, including FVG box colors, time range display, and whether to show the NY open markers. This flexibility allows you to integrate it seamlessly with your existing trading setup.

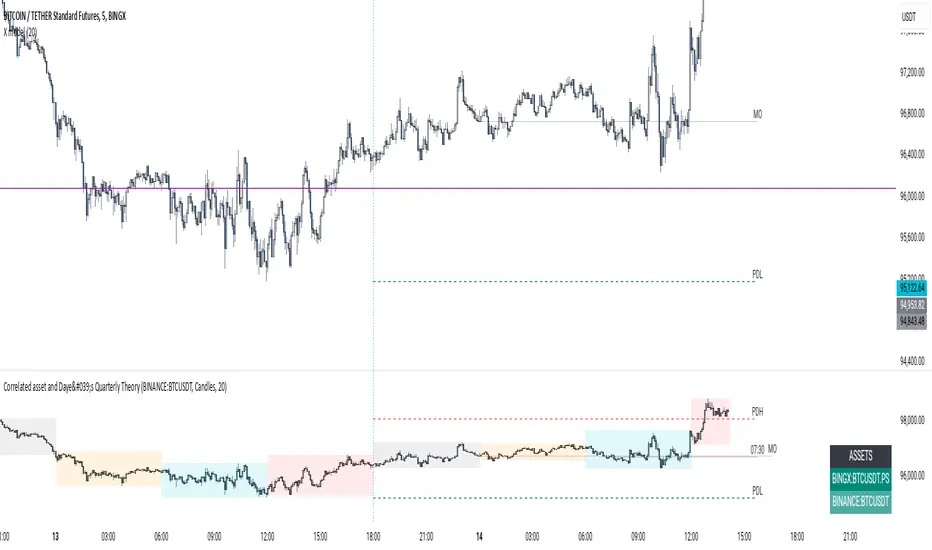
Correlated asset and Daye's Quarterly TheoryThis indicator is based on the Quarterly Theory concepts from Daye. You can find him mainly on X as traderdaye.
It works on a new panel and the quarters will be drawn over the chart of the correlated that you set on its settings.
You can use every asset to compare with the main one to make easier to find divergences between days, sessions and 90 minutes cycles.
In different timeframes, the indicator could show more or less information about quarters, but will always show the compared asset one. This is due to limitations of the candles start (for example, the Session's Q2 open won't be shown on an hourly chart because it starts after 30 minutes of candle's open).
What can this indicator do for you?
- Show the correlated asset chart.
- Show daily, session and 90 minutes cycle boxes.
- Show Midnight and every session's Q2 open.
- Make easier for the trained eye to determine if the model is AMDX or XAMD, find PO3, turtle soups, SMT divergences, etc.
Do you have any suggestion? Please, leave it on the comments. I'll try to improve this indicator regularly.
Dynamic Momentum Shift Detector [Invesmate]Dynamic Momentum Shift Detector
Overview
The Dynamic Momentum Shift Detector is an advanced trend-following and momentum-based indicator designed to help traders identify high-probability trading opportunities. It combines RSI-based momentum detection, Supertrend confirmation, and EMA sentiment tracking to provide reliable buy and sell signals.
This indicator is useful for traders who rely on price action and momentum shifts to make informed trading decisions. The goal is to capture early trend reversals while filtering false signals using multiple confirmations.
Key Features & Unique Aspects
RSI (2-Period) for Momentum Detection
Uses an extremely short 2-period RSI to detect overbought (75) and oversold (25) conditions.
Buy Signal: RSI crosses above 25 and price is above the Supertrend line.
Sell Signal: RSI crosses below 75 and price is below the Supertrend line.
Supertrend for Trend Confirmation
A Supertrend (ATR 20, Factor 2) is used to validate the overall market trend.
Prevents false breakouts by ensuring buy signals occur above the Supertrend line and sell signals occur below it.
21-EMA Sentiment Filter
A 21-period Exponential Moving Average (EMA) acts as a market sentiment indicator.
Background color changes for quick visual cues:
Green Fill: Price is above EMA (bullish sentiment).
Red Fill: Price is below EMA (bearish sentiment).
Refined Buy/Sell Confirmation Criteria
To eliminate weak signals, additional price action conditions are applied:
Buy Confirmation: Higher high, bullish close, and strong candle body (>40% of range).
Sell Confirmation: Lower low, bearish close, and strong candle body (>40% of range).
Persistent Buy/Sell Levels
Displays persistent buy and sell levels (green/red dots) on the chart.
These remain active until invalidated by price action.
Bull & Bear Momentum (RSI-8 for Strong Reversals)
Bull M (Green Triangle): RSI (8) crosses above 72 with a strong bullish candle (>60% body).
Bear M (Red Triangle): RSI (8) crosses below 27 with a strong bearish candle (>60% body).
How to Use the Indicator
Buy Setup:
✅ Look for a green "Bull R" signal when:
RSI crosses above 25.
Price is above Supertrend & EMA 21.
Additional confirmation from bullish candle structure.
Sell Setup:
✅ Look for a red "Bear R" signal when:
RSI crosses below 75.
Price is below Supertrend & EMA 21.
Additional confirmation from bearish candle structure.
Observation Signals:
⚠️ "Obs Buy" (Orange Label) → Possible buy setup, but missing confirmation.
⚠️ "Obs Sell" (Orange Label) → Possible sell setup, but missing confirmation.
Momentum Reversal Markers (Strong Buy/Sell Signals)
🔺 "Bull M" (Green Triangle) → Strong bullish momentum shift detected.
🔻 "Bear M" (Red Triangle) → Strong bearish momentum shift detected.
Why This Indicator is Unique & Valuable
✔ Combines multiple indicators (RSI, Supertrend, EMA) with a structured approach.
✔ Avoids false signals by requiring confirmation from price action.
✔ Provides persistent support/resistance levels to track active trades.
✔ Visually clean and easy to use with minimal chart clutter.
This indicator is suitable for swing traders, intraday traders, and positional traders who want high-probability setups with clear trend direction.

Fourier Oscillator Suite [SeerQuant]| Fourier Oscillator Suite |
WHY THE FOURIER TRANSFORM?
The Discrete Fourier Transform (DFT) extracts dominant cyclical patterns from market price data. Fourier analysis allows for the decomposition of price movements into frequency components, distinguishing trend-driven behaviour from noise and identifying oscillatory cycles within the market. This approach is effective in detecting dominant cycles in data, filtering out random fluctuations, and providing insights into price behaviour beyond conventional indicators.
This indicator applies a Fourier transform to the selected price source, converting it into a frequency-based signal. Instead of directly working with raw price data, the transformed signal acts as a smoothed and cycle-adjusted input for multiple technical indicators, enhancing their ability to adapt to market conditions dynamically.
Once the Fourier transform is applied, the extracted signal is processed through a suite of technical indicators, which are then normalized and aggregated into a single, actionable metric.
FEATURES AND BENEFITS
✅ Multi-Factor Aggregation:
By blending volatility, momentum, and volume-based oscillators, this indicator provides a comprehensive view of market conditions.
✅ Enhanced Signal Clarity:
Fourier transformation filters noise, revealing more reliable trading signals.
✅ Adaptive Market Sensitivity:
Unlike static oscillators, the Fourier-enhanced input dynamically adjusts to price shifts.
INDICATOR COMPONENTS
The Fourier Oscillator Suite aggregates the output of the transformed signal into three primary market components:
1. Volatility-Based Metrics
Commodity Channel Index (CCI) – Measures price deviation from a moving average.
Bollinger Band %B (BB%) – Evaluates price positioning within the Bollinger Bands.
Relative Volatility Index (RVI) – Identifies periods of heightened or subdued volatility.
2. Momentum Indicators
Relative Strength Index (RSI) – Gauges trend momentum and overbought/oversold levels.
Coppock Curve – A long-term momentum oscillator, often used for detecting major trend shifts.
Momentum (MOM), TRIX, and Stochastic Momentum Index (SMI) – Further refine momentum analysis.
3. Volume-Based Oscillators
Money Flow Index (MFI) – Measures price strength relative to volume.
Volume Zone Oscillator (VZO) – Detects accumulation and distribution phases.
Elder's Force Index (EFI) & Klinger Volume Oscillator (KVO) – Assess money flow strength.
These individual metrics are first normalized within a defined period and then smoothed using the selected moving average type. The final composite signal is derived from a weighted combination of the volatility, momentum, and volume components, each of which can be customized by the user.
SETTINGS
The indicator includes an extensive set of options for users to tailor its performance:
📌 Fourier Transform Parameters
Source Selection – Choose which price input (e.g., HLC3) is used for Fourier analysis.
Fourier Period – Defines the number of cycles analyzed for signal extraction.
📌 Aggregation Settings
Normalization Period – Controls how indicator values are scaled.
Smoothing Length – Adjusts the sensitivity of moving averages applied to oscillators.
Weight Adjustments – Fine-tune the impact of volatility, momentum, and volume-based inputs on the final signal.
📌 White Noise Control
White Noise Amplitude & Period – Filters out excessive market noise to improve signal clarity.
Enable/Disable White Noise Overlay – Provides optional visualization of filtered noise levels.
📌 Custom Styling & Visual Enhancements
Selectable Color Schemes – Choose from Default, Modern, Cool, or Monochrome.
Bull & Bear Color Customization – Define custom colors for positive/negative momentum shifts.
Adaptive Gradient Fills – Highlights market conditions dynamically based on oscillator movements.
The Fourier Oscillator Suite is designed for advanced traders seeking a noise-reduced, multi-dimensional view of market dynamics. By incorporating Fourier-transformed signals into a broad range of oscillators, this tool offers a highly adaptive, filter-enhanced, and customizable approach to momentum and trend analysis. Whether you are a trend follower, mean reversion trader, or volume analyst, this suite provides actionable insights with enhanced clarity.
