@Kunnaphatz (EMA 5/21/50/100)EMA by Kunnaphatz
เส้น EMA นี้ถูกสร้างขึ้นจาก ข้อสงสัยของผมเกี่ยวกับ EMA ของ อาจารย์โต่งเต่ง และพบว่าในหนังสือจารย์แกมีบอกเลยทำขึ้นมาซะเลย
Exponential Moving Average (EMA)

EMA 5/21/50/100This is EMAs that setting like Mr.Tongtang
His youtube channel: Elliott Wave By โต่งเต่ง
He also wrote a book called "เล่นหุ้นอย่างไรไม่มโน"
You can buy it at: Shopee, Lazada, and Se-Ed

Triple EMAThis script contains triple EMAs (20, 50 and 200) you can edit them according to your preferences by going to settings and select whatever EMA you are used to.

ema gksthis strategy is very simple scripting to buy and sell based on crossover of exponential moving averages

EMA Cross Intraday 20/50/100/200/535This shows EMA cross of 50,100,200 and the epic 535 EMA mega average price line. The 535 EMA is mentioned in a dark bold colour and it's the thickest line.

MF 200 EMA PivotPointWe will be using the 200 EMA for identifying the trend of the market & possible cross overs for Swing trades. Pivot points will be really useful for defining the Supports & resistance. By combining with these two strategies we can understand the markets simple & clear. No need to fill your chart with Graphical designs.


Awen1s EMA FiboEMA based on Fibonacci sequence starting at 5 hours.
Hours: 5, 10, 15, 25, 40, 65, 105, 170, 275, 445, 720, 1165, 1885, 3050, 4935

EMAs Vertical & Horizontal Offset
This script allows you to set Horizontal and Vertical offset to EMA lines.
Default settings is to have one set of EMAs to show bearish wave (red line and circles)and the second set to show bullish wave (green line and circles).
It also includes supporting EMAs & SMA for direction and confirmation
Timeframe option allows you to overlay Higher TF EMAs onto the current TF.

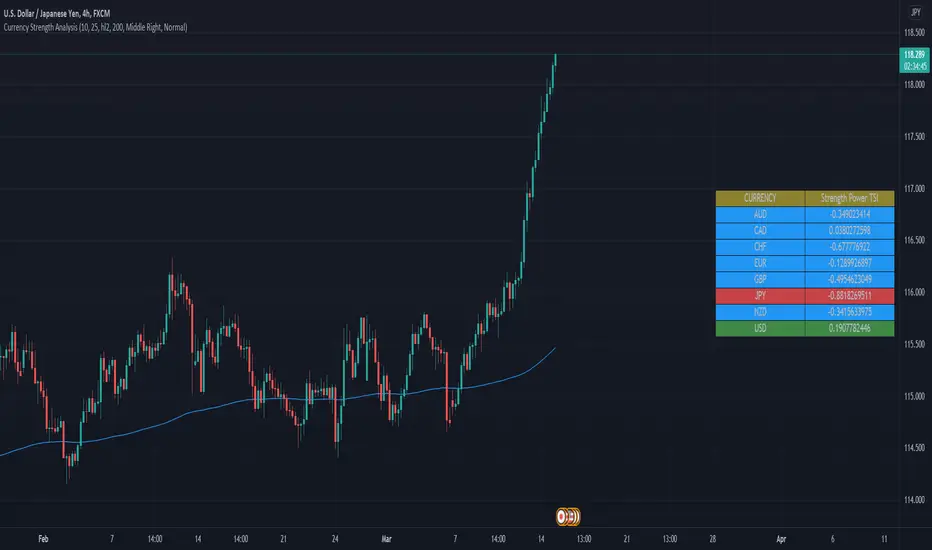
Trend Trading with Currency Strength MeterThis is a trend trading strategy designed mainly for forex made of two big components:
First we have the currency meter, which is made of taking TSI of different INDEXes such as EUR, USD, GBP, JPY, NZD, AUD , CHF and CAD.
Once we establish which one is the weakest and most powerful, we pair them together and we go on that chart.
Lastly we check with the EMA 200 to confirm our direction.
We can see in this example for the USDJPY chart, that USD is the strongest, JPY is the weakest and ema confirm our bullish trend.
For timeframe in general I recommend big timeframes, 1-4h+ , and as a mentality a swing trading mentality, we can stay in trade for days/weeks.
For exit in general I recommend to exit when either one of the pairs losses/gain power or when the EMA is crossing with current candle
If you have any questions, let me know !
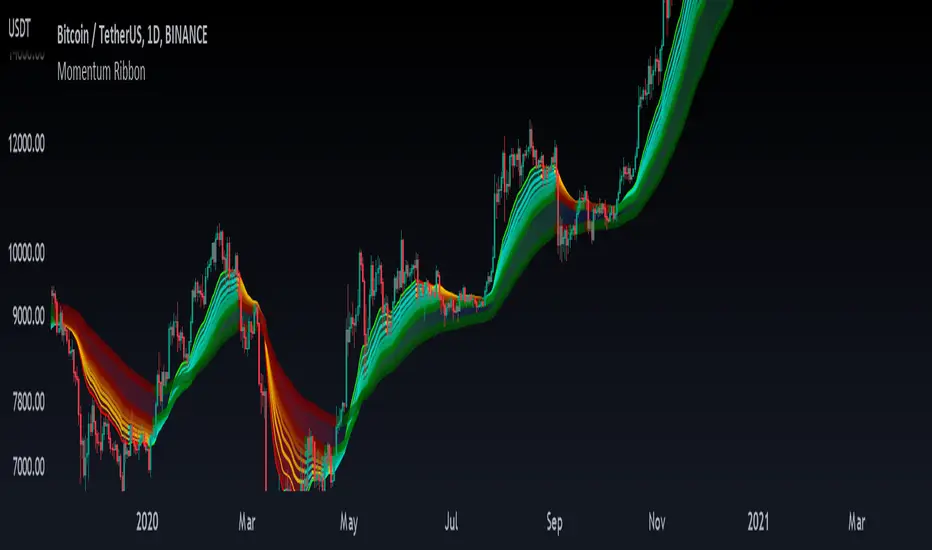
Momentum RibbonThe Momentum Ribbon is a collection of Moving Averages which indicate the severity of pull-backs in a given market.
As the ribbon spreads apart, it indicates more and more significant support/resistance for a trending market. As it is compressed back together, it displays a blue colour to indicate a "cooling" of trend momentum.
Adjustable Moving Average periods and types! You can customize the parameters of your ribbon to your heart's content!

Combine & Merge Candlesticks + EMACombine & Merge Candlesticks with EMA
You can do the following:-
1 min - look back 5 (5 min) up to 15 (15 min)
5 min - look back 3 (15 min) up to 12 (1 hour)
15 min - look back 4 (1 hour) up to 16 ( 4 hours)
1 hour - look back 4 (4 hours) up to 8 (8 hours - 1 trading session)
4 hour - look back 2 (8 hours - 1 trading session) up to 6 ( 1 Day)
1 day - look back 5 ( 1 week)

EMA Options Clouds With SignalsEMA Clouds for Options!
This indicator can help you confidently open and close options positions. Note that you should set stop a little below midline EMA . Risk reward for good signals is fairly consistent in profit. Most of the simulations I ran got between 1:2 and 1:4 profits. The losers usually can be avoided by making sure you are not in a choppy trading channel. Wait for EMAs to start separating and don't blindly follow every buy/sell.
3 wave EMA + Clouds:
Defaults:
EMA 8/32/64
Signals (off by default - turn on in settings):
Buy Call/Sell Call (open/exit call positions)
Buy Put/Sell Put (open/exit put positions)
Enter signals bullish:
Close over Middle EMA AND Short EMA > Middle EMA > Long EMA
Exit signals bullish:
Close under Middle EMA OR trend turns bearish (Short EMA < Middle EMA < Long EMA )
Enter signals bearish:
Close under Middle EMA AND Short EMA < Middle EMA < Long EMA
Exit signals bearish:
Close over Middle EMA OR Short EMA > Middle EMA > Long EMA
Cloud Colors (Default)
Green: Bullish
Red: Bearish
White: Chop/Transition

Yeşil DalgaEMA 44 ve EMA 55 Dalgası
Sizinle kullandığım bir dalgayı paylaşmak istiyorum bence 1 dakikalıkta gayet güzel iş yapıyor. EMA 44 ve 55 i dalga şeklinde takip ediyorum . Fiyat dalganın altına inince eğer bir veya iki kez nizami bir şekilde tepki almaya başlarsa düşüşün derinleşme ihtimali artıyor. Fiyat dalganın üstüne çıkınca da yine aynı şekilde eğer bir veya iki kez nizami bir şekilde sekmeyi başarırsa yükseliş gelme olasılığı artıyor. Scalp işlem yapanlar için bence takip edilmesi gereken bir unsur. Long girdiğimde dalgayı 2 3 mumla veya hacimli bir mumla kırdığında kaçıyorum genelde. Shortta da tam tersi. Yatırım tavsiyesi değildir.

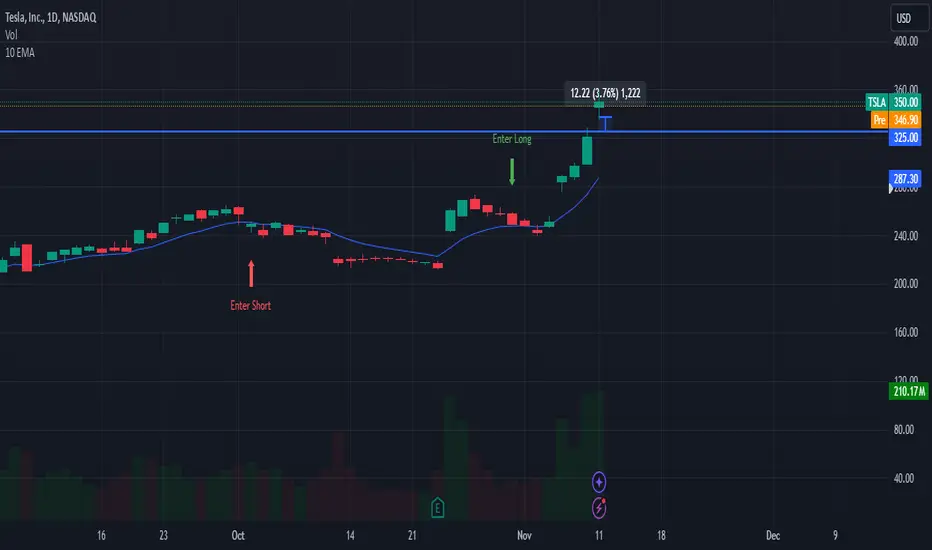
10 EMA StrategyThis indicator shows you:
- The first bullish candle to close below EMA 10
- The first bearish candle to close above EMA 10.
Optional:
You can enable the exit signals in the setting. This will show you:
- If you are long (bullish), it will signal when the first bullish candle closes below EMA 10
- If you are short (bearish), it will signal when the first bearish candle closes above EMA 10
You can also change the EMA 10, to another length, if you want to try something else.
Extreme VolumesThe aim of this volume indicator is quite simple: to pinpoint extreme volume spikes and how unusual these extremes are in comparison to all the chart's volumes.
The label displayed at the end of the indicator updates according to the settings you choose;
It shows the volume EMA length and how many times (the EMA) the current volume bar as to be above to be considered extreme.
Finally, the percentage at the end of the label tells how unusual the defined extreme volumes are compared to the whole chart's volumes (the smaller the percentage, the more unusual these "extreme" volumes are).

Exponentially Deviating Moving Average (MZ EDMA)Exponentially Deviating Moving Average (MZ EDMA) is derived from Exponential Moving Average to predict better exit in top reversal case.
EDMA Philosophy
EDMA is calculated in following steps:
In first step, Exponentially expanding moving line is calculated with same code as of EMA but with different smoothness (1 instead of 2).
In 2nd step, Exponentially contracting moving line is calculated using 1st calculated line as source input and also using same code as of EMA but with different smoothness (1 instead of 2).
In 3rd step, Hull Moving Average with 3/2 of EDMA length is calculated using final line as source input. This final HMA will be equal to Exponentially Deviating Moving Average.
EDMA Advantages
EDMA's main advantage is that in case of top price reversal it deviates from conventional EMA of 2*Length. This benefits in using EDMA for EMA cross with quick signals avoiding unnecessary crossovers. EDMA's deviation in case of top reversal can be seen as below:
EDMA presents better smoothened curve which acts as better Support and resistance. EDMA coparison with conventional EMA of 2*length of EDMA is as follows.
Additional Features
EMA Band: EMA band is shown on chart to better visualize EMA cross with EDMA.
Dynamic Coloring: Chikou Filter library is used for derivation of dynamic coloring of EDMA and its band.
Alerts: Alerts are provided of all trade signals. Weak buy/sell would trigger if EMA of 2*EDMA_length crosses EDMA. Strong buy/sell would trigger if EMA of same length as of EDMA crosses EDMA.
Trade Confirmation with Chikou Filter: Trend filteration from Chikou filter library is used as an option to enhance trades signals accuracy.
Defaults
Currently default EDMA and EMA1 length is set to 20 period which I've found better for higher timeframes but this can be adjusted according to user's timeframe. I would soon add Multi Timeframe option in script too. Chikou filter's period is set to 25.

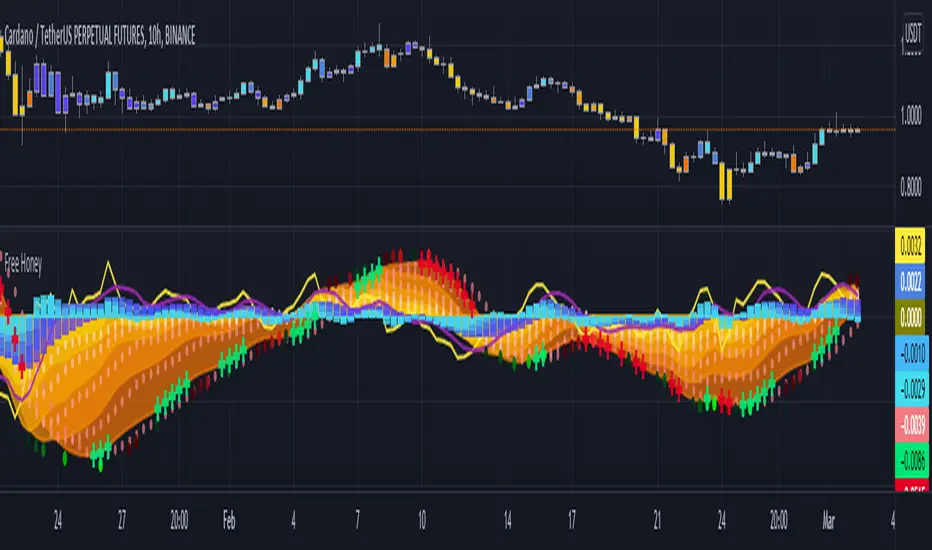
Honey CypherHoney Cypher Aims to do 4 things
Momentum
Trend Strength
Overbought and oversold zones
Being the most beautiful indicator you ever see
Momentum
The big yellow honey waves primary use is to see the momentum of the market, they can be used in a similar way you would use a MACD or Chaikin Money Flow
On this image you see the honey waves being plotted to the 30 minute timeframe while on the 5 minute chart to have an understanding of longer time momentum in the chart.
Trend Strength
Most tools of the indicator can be used for that but the yellow and purple slope strength lines are made specificaly for this. When you see them curl down you know trend is strengthening towards the downside.
The candle color is based on the amount of Honey waves sloping in one direction. This might be the best tool in the indicator to find Trend Strength. Bright yellow candles mean strong bears while the bright blue candles mean strong bulls.
Overbought and oversold zones
By analysing the waves on a chart you start to learn how big waves can get before a reversal or consolidation period arrives.
You can become profitable with the indicator. But to be honest, my primary focus in making this indicator was find ways to visualise alot of data in a clear and beautiful way.
You should use the indicator with some out of the box ideas instead of just trusting the signals.
examples:
Find a head and shoulders pattern on the top of a huge honey wave.
Find a bottom small wave while the others honey waves are in the opposite direction for entering a pullback.
Use the honey for direction but the yellow and purple slope line crosses for entrys.
Comment your own strategys, I made this open source to be able to get community feedback.
The Honey Cypher waves are calculated in a similar way as the MACD histogram. I've combined MACD formula with some of the lazybear formula. It looks for the distance between 2 moving averages to find trend strength. After that the end results get's smoothed out. It is very satisfying to change that as you can see the honey waves create a melting like motion on each change of smoothing.
Below a preview of the honey cypher moving average lines, all lines have a length that is based on the fibonacci number sequence. Honey cypher measures the distance between for example length 5-8 averages.
I hope this inspires coders to create very beautiful scripts.
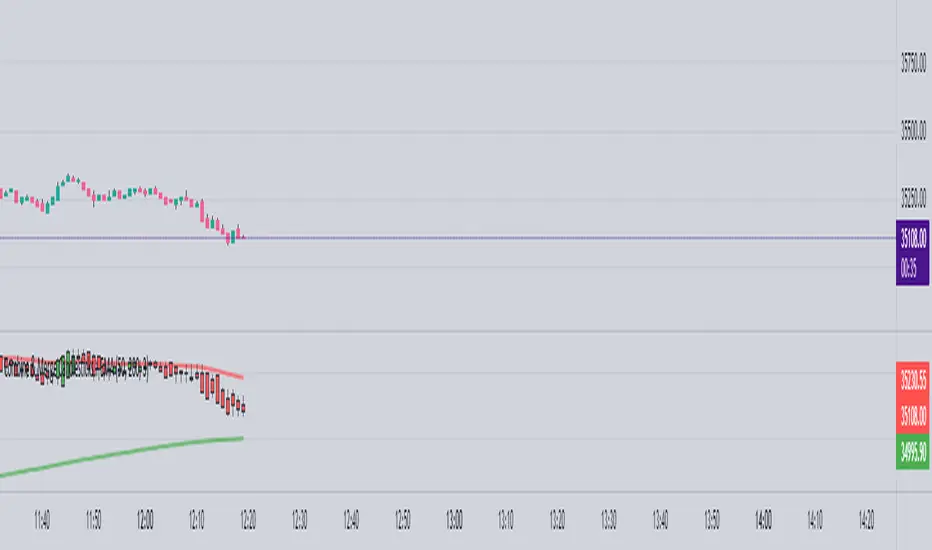
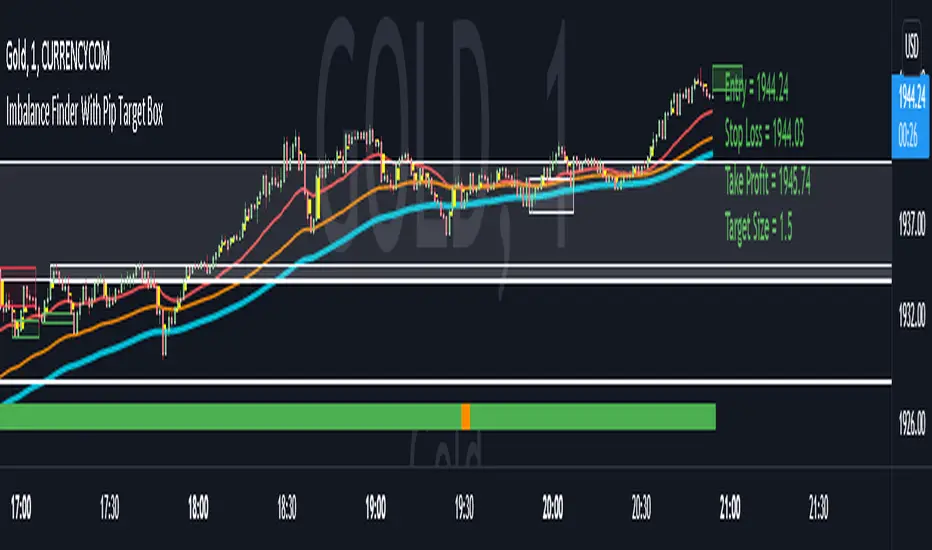
Imbalance Identifier With Target BoxTarget Area to help me with my target area for visual reference
Imbalance Identifier - Helps me to see where the trade may come back to
EMA on 1 Minute Time frame for helping to identify Direction to take trades in
I primarily use this as a tool to help me identify very short term direction for scalping small target area (Adjustable)
Preset for the main 28 Forex Pairs, US30,US100,US500 Dax40 and Gold on the 1 Minute timeframe
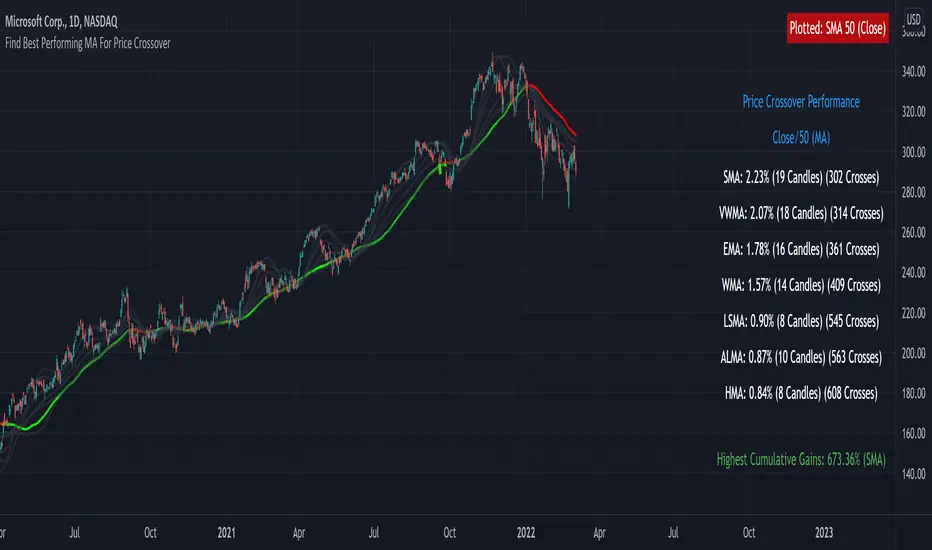
Find Best Performing MA For Price CrossoverHello!
This script calculates the average percentage gain/loss following a price crossover of a moving of any length, up until prices cross back under the MA.
The script calculates the average number of candles that the source (i.e. close, open, low, ohlc4) remains above the moving average until crossing back under, in addition to the number of crosses. Performance is listed from best to worst; descending order. Also listed is the HIGHEST cumulative gains of ALL tested moving averages.
The moving average length can be changed to any number, so long as there are enough data points, on ANY timeframe and the script will recalculate.
Triple MA Buy SellThis simple script show potentiel trade entry points using 3 MA, can be switch by EMA and SMA type.
Adjust the MA(s) Length depending pairs and timeframe you use.
Buy & Sell labels can be display by input settings.
Action are take by the following rule:
Long signal:
MA3 > MA2 > MA1
Short signal:
MA1> MA2 > MA3
Add some filters is really needed to make this usable.
using my "Flat Detect By Bollinger Bands" indicator can be a debut
