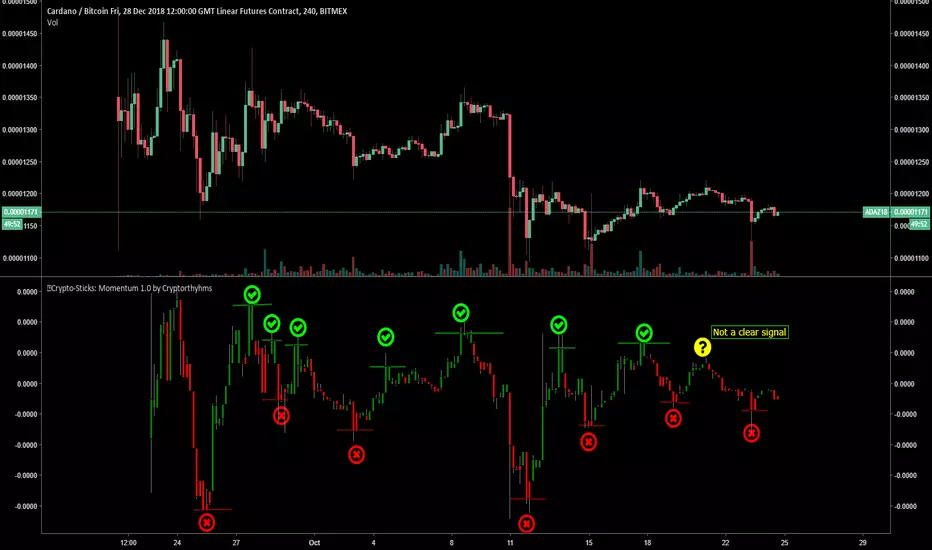
🥢Crypto-Sticks: Momentum 1.0 by Cryptorthyhms🥢 Crypto-Sticks™ Momentum
A new series of indicators brought to you by Cryptorthyhms...giving you an alternate look at your trusted favorites!
🚀 Indicator Specific Info
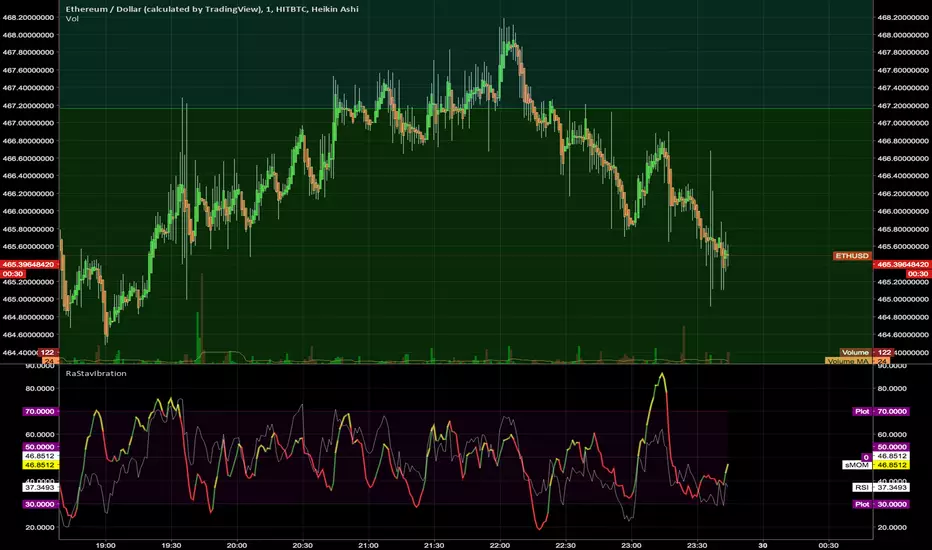
Momentum can be a tricky indicator sometimes. Since it doesnt go into predictable overbought or oversold zones, it rather just oscillates around zero - making it harder to create a signals strategy. On the default view I tend to look for 2 candle "flat tops" and "flat bottoms" with one or both containing a decent wick.
Heiken Ashi candles adds some more clear entry exit points which can be executed at the second candle going in either direction (applicable only to this chart on 4H - other coins/charts will require their own strategy). For instance, enter on 2nd green, exit on 2nd red.
Volume weighting the HA candles adds a different dimension to the indicator which I have to explore more fully. Please leave me any ideas or feedback you have!
🚫If using HA or VW+HA, the strategy about "flat candles" doesnt apply anymore.
🚀 Crypto-Sticks General Info
💭This series isnt polished 100%, and I have some more options I will add in the future. But for now, I want to just release them, as I am not sure when I will have the time to put more work into them (many other big projects I am working on).
📊Its basically reinterpretations of all your favorite indicators. I calculate the values a little bit differently than normal, but the end result is creating a candlestick chart (for the indicator!). Then I added the option to plot them as Heiken Ashi candles to smooth out noise and make signaling easier. Here's how it looks as Heiken Ashi:
🔊Lastly I implemented a Volume Weighting system for them all which simply integrates volume into the formulas for these indicators. For the most part this feature is experimental and doesn't provide huge utility (yet - I have other ways I want to try it as well - just no time). Though on some of the indicators it already shows great promise. Here is Volume Weighted + Heiken Ashi:
👍Enjoying this indicator or find it useful? Please give me a like and follow! There are many more indicators to be released in this series, not to mention I post crypto analysis and other free indicators regularly.
💬Questions? Comments? Want to get access to an entire suite of proven trading indicators? Come visit us on telegram and chat, or just soak up some knowledge. We make timely posts about the market, news, and strategy everyday. Our community isnt open only to subscribers - everyone is welcome to join.
Momentum Indicator (MOM)
Coppock CurveThis indicator was originally developed by Edwin "Sedge" Coppock (Barron's Magazine, October 1962).
Specially for @AlexMayorov :
1) Buy when indicator crosses the zero line upside
2) Sell when indicator crosses the zero line downside

Assassin Triple MomentumThere are a red base line on chart.
If crossunder the base line , we can treat it as bear market. If crossover baseline , we can treat it as bull market.
you can setting the base line number yourself for some special case.

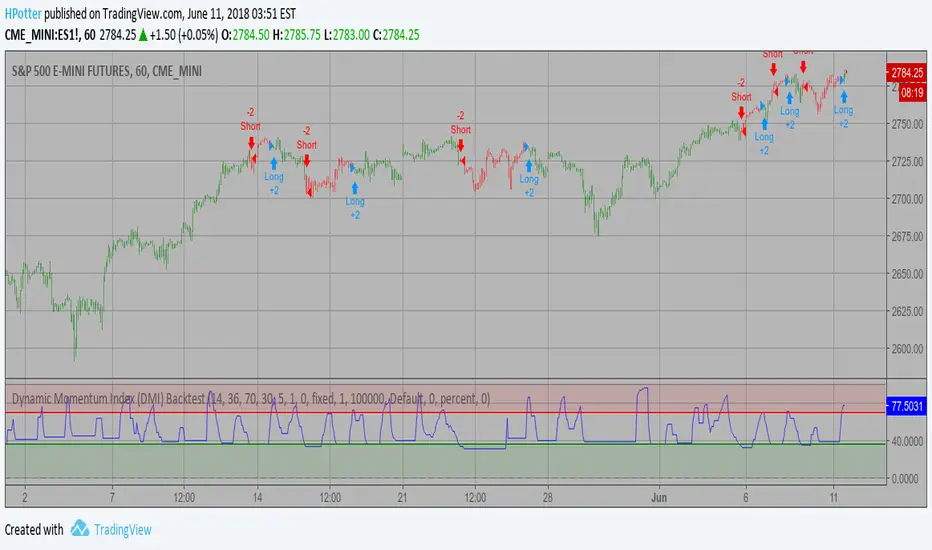
Dynamic Momentum Index (DMI) Backtest This indicator plots Dynamic Momentum Index indicator. The Dynamic Momentum
Index (DMI) was developed by Tushar Chande and Stanley Kroll. The indicator
is covered in detail in their book The New Technical Trader.
The DMI is identical to Welles Wilder`s Relative Strength Index except the
number of periods is variable rather than fixed. The variability of the time
periods used in the DMI is controlled by the recent volatility of prices.
The more volatile the prices, the more sensitive the DMI is to price changes.
In other words, the DMI will use more time periods during quiet markets, and
less during active markets. The maximum time periods the DMI can reach is 30
and the minimum is 3. This calculation method is similar to the Variable
Moving Average, also developed by Tushar Chande.
The advantage of using a variable length time period when calculating the RSI
is that it overcomes the negative effects of smoothing, which often obscure short-term moves.
The volatility index used in controlling the time periods in the DMI is based
on a calculation using a five period standard deviation and a ten period average
of the standard deviation.
You can change long to short in the Input Settings
WARNING:
- For purpose educate only
- This script to change bars colors.
Phase Change IndexPhase Change Index script.
This indicator was developed and described by M. H. Pee (Stocks & Commodities V.22:5 (28-37): Phase Change Index).
Other indicators of M. H. Pee:

Ehlers Smoothed Adaptive MomentumEhlers Smoothed Adaptive Momentum script.
This indicator was developed and described by John F. Ehlers in his book "Cybernetic Analysis for Stocks and Futures" (2004, Chapter 12: Adapting to the Trend).

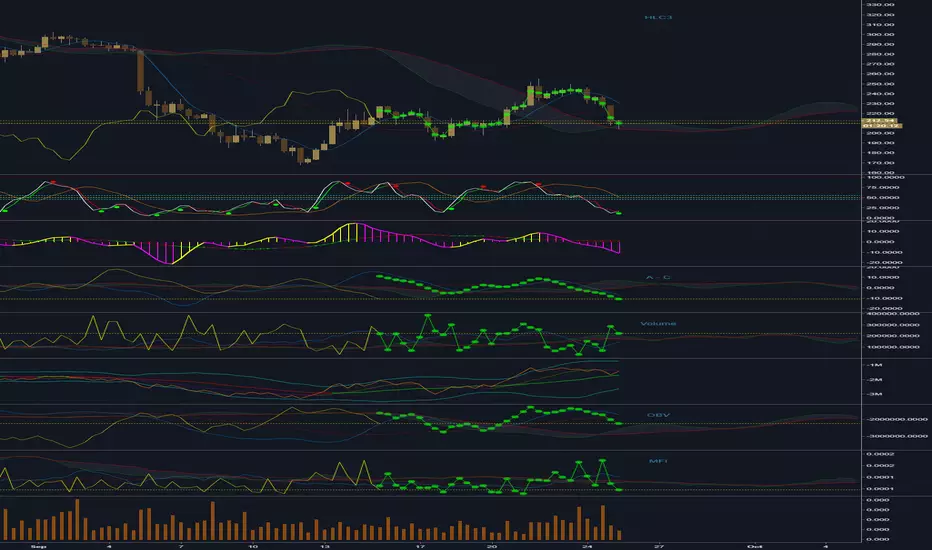
NeoIchi
The idea of this oscillator / indicator came from Ichimoku , how it draws and how it calculates different averages in different scales.
The formula used for this indicator is totally different from Ichimoku , as you can compare the left and right charts, with same setting between my indicator and ichimoku , different results show up.
The inputs that you can use for this indicator/oscillator :
1- HLC3 (better to through it on the chart just like ichimoku
2- acceleration - deceleration (set the first parameter to 5 and the second to 34 for standard calculations)
3- pure volume
4- OBV ( On Balance Volume )
5- Bill Williams MFI ( Market Facilitation Index )
6- Momentum : This one can have different options : set with Barry Burn's formula and bar scale for when the charts are 1 to 3 ratio (B 3) or when they are not 1 to 3 (B), Bill William standard (W), Hybrid with barry's input (Would be bar close but I replaced it with HLC3, better results) but Bill William time scale for calculations (H), and finally, use Bill Williams MFI as input but use Barry Burn's time scales in formula (H M)
If you have any specific input in mind that you think would be nice to have in this system, through a comment bellow and I will add it to the system.
This oscillator / indicator is for sale, you can buy a life long licence that would include all updates with 0.01 BTC. Send the BTC + transaction fee to the wallet address bellow :
12EDAYA52DzcXdh9aLC9Pqqfhm1jNMjxNo
after sending the BTC , contact me in pm and send the transaction ID with your trading view's ID and I will give you access to this oscillator / indicator
AtraxaLooking for:
X - Momentum divergence
Y - RSI Divergence
Z - Stochastic oversold/overbought region
Filter some signals with cmf
Each overlap prints different combination example...
XY - Momentum + RSI
YZ - RSI + Stochastic

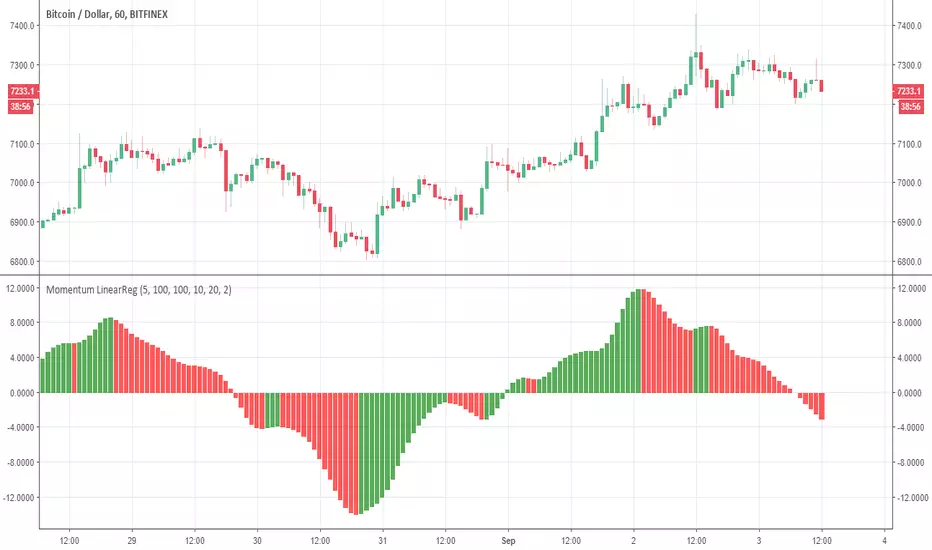
DepthHouse - Peak Momentum OscillatorDepthHouse Peak Momentum Oscillator uses advance calculations of linear regression to help determine price momentum and momentum peaks.
How to read it:
The least opaque columns represent general momentum direction.
When these columns are above the zero line, generally there is more bullish momentum in the market.
When they are below the zero line, generally there is more bearish momentum in the market.
When these columns turn white, it means the price could be losing its bullish or bearish momentum.
The more transparent columns in the background represent the lead band, which reacts faster than the general momentum columns.
This could be used to as a leading indication of where the market could be heading.
Swap Momentum Bands option:
This option removes the white columns from the general momentum histogram and in turn only gives signals when strong momentum is present.
How to use this Indicator:
For 30 days from this release (9/20/18) this indicator will be free to use! Either leave a comment below or feel free to send me a PM
After the 30 days from the release you can still
try this indicator for FREE! Just leave a comment, or feel free to send me a PM


Momentum IndexTo be Used with MACD HISTOGRAM
what to look for ?
normal divergences as well as cross divergences aka HIDDEN
when both stars align then its extra strong
flip the K&D settings for more dramatic results .
message me for access.


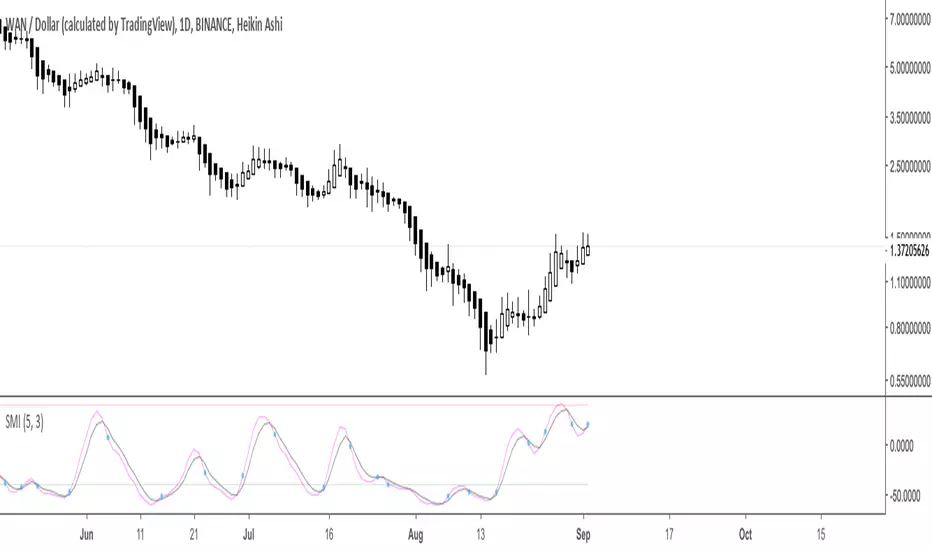
Stoch Momentum Index* Original code from UCSgears.
* Added circles for when Stoch MI and signal line crosses.
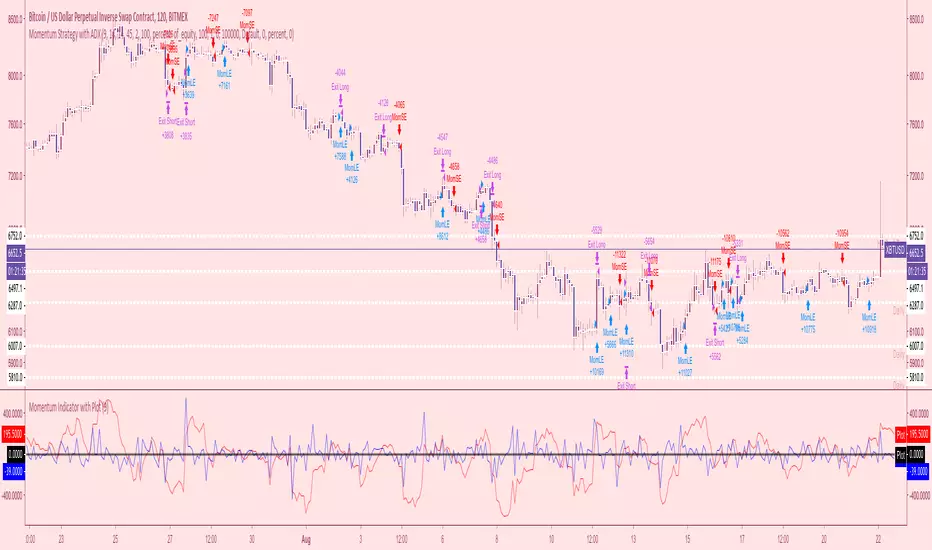
Momentum Strategy with ADXmomentum strategy that utilizes ADX for timing and includes stop loss % and take profit %.
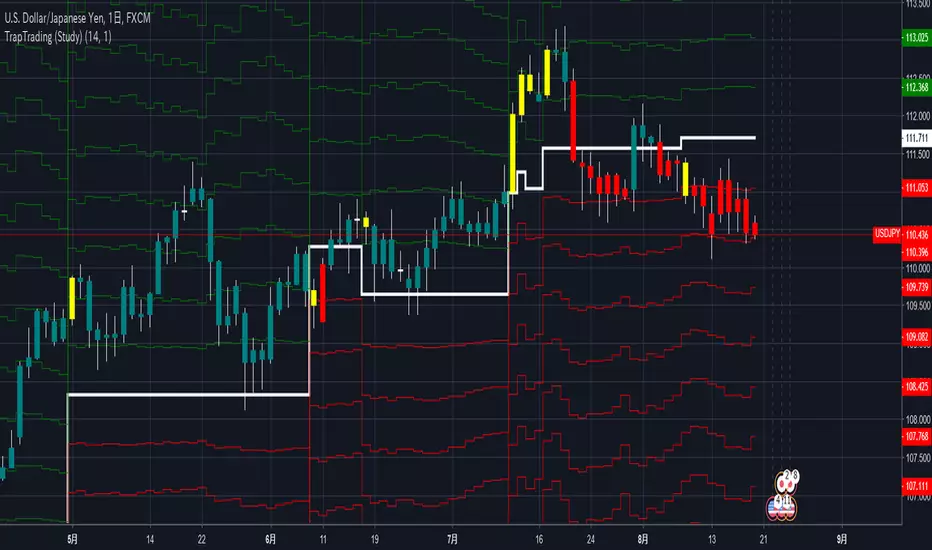
TrapTradingBuy on dips and sell into rallies. Simple as that.
- Short line (green)
- Base line (white)
- Long line (red)
When the market price touches the white or the red(green) lines, buy(sell) orders are generated.
The exit points are 2 lines above(below) the entries.
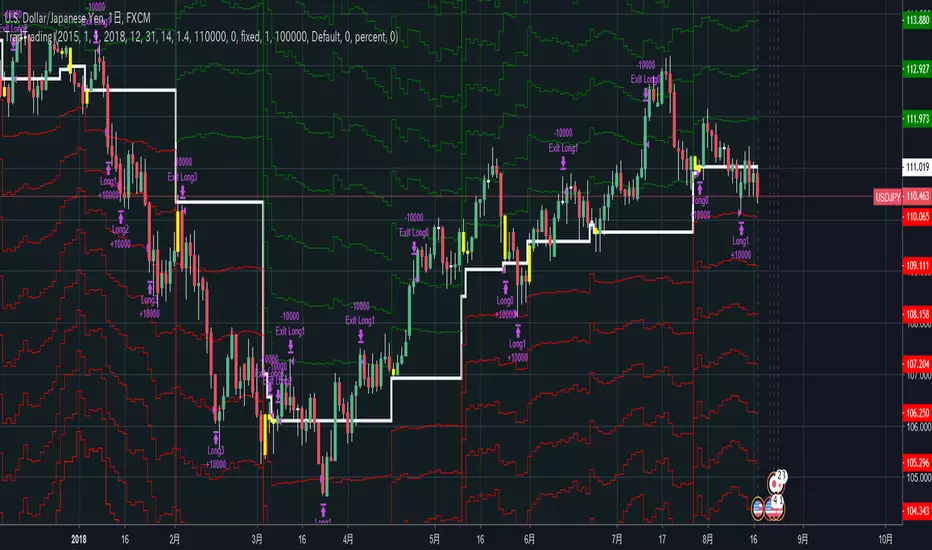
Parameters
- Period: It affects the value of Base line and the spacing of each line.
- Multiple: Specify the spacing between each line.
Power Momentum by Atilla YurtsevenThe Power Momentum indicator calculates momentum in a different way. The graph may look similar. The important part is the color of the bars.
If you set the "Base Line" to "Zero", there are two important things to notice. The orange color when the bars are below the base and the blue color when the bars are above the base.
If you set the "Base Line" to "Stats", instead of coloring bar, you see the bars in exact positions. For example; "Zero" shows you orange bar below the base line but "Stats" shifts the bars over the Base line.
Momentum is calculated statistically. If the momentum moves over to the preset levels, bar colors change concurrently.
BAR STATES
Orange: Orange bar below the base line means high possibility of an upcoming up movement
Blue: Blue bar above the base line means high possibility of an upcoming down movement
I hope you enjoy this indicator. As I stated in my previous indicators, i use statistical methods while developing my indicators.
Disclaimer: All the information in this article, including the indicator, was provided and published for informational purposes only and should not be considered legal or financial advice. Please use at your own risk.
Please remember to follow me and post some comments so i can share more indicators.
Happy trading! :)
Atilla Yurtseven

Momentum IndicatorMomentum indicator with adjustable EMA's bar colors lime for volume increase red for volume decrease

Shorts & Longs (Bitfinex) - Active CoinPlots the ammount of shorts and longs on bitfinex of current chart using the ticker ID
