Spot-Vol CorrelationSpot-Vol Correlation Script Guide
Purpose:
This TradingView script measures the correlation between percentage changes in the spot price (e.g., for SPY, an ETF that tracks the S&P 500 index) and the changes in volatility (e.g., as indicated by the VIX, the Volatility Index). Its primary objective is to discern whether the relationship between spot price and volatility behaves as expected ("normal" condition) or diverges from the expected pattern ("abnormal" condition).
Normal vs. Abnormal Correlation:
Normal Correlation: Historically, the VIX (or volatility) and the spot price of major indices like the S&P 500 have an inverse relationship. When the spot price of the index goes up, the VIX tends to go down, indicating lower volatility. Conversely, when the index drops, the VIX generally rises, signaling increased volatility.
Abnormal Correlation: There are instances when this inverse relationship doesn't hold, and both the spot price and the VIX move in the same direction. This is considered an "abnormal" condition and might indicate unusual market dynamics, potential uncertainty, or impending shifts in market sentiment.
Using the Script:
Inputs:
First Symbol: This is set by default to VIX, representing volatility. However, users can input any other volatility metric they prefer.
Second Symbol: This is set to SPY by default, representing the spot price of the S&P 500 index. Like the first symbol, users can substitute SPY with any other asset or index of their choice.
Length of Calculation Period: Users can define the lookback period for the correlation calculation. By default, it's set to 10 periods (e.g., days for a daily chart).
Upper & Lower Bounds of Normal Zone: These parameters define the range of correlation values that are considered "normal" or expected. By default, this is set between -0.60 and -1.00.
Visuals:
Correlation Line: The main line plot shows the correlation coefficient between the two input symbols. When this line is within the "normal zone", it indicates that the spot price and volatility are inversely correlated. If it's outside this zone, the correlation is considered "abnormal".
Green Color: Indicates a period when the spot price and VIX are behaving as traditionally expected (i.e., one rises while the other falls).
Red Color: Denotes a period when the spot price and VIX are both moving in the same direction, which is an abnormal condition.
Shaded Area (Normal Zone): The area between the user-defined upper and lower bounds is shaded in green, highlighting the range of "normal" correlation values.
Interpretation:
Monitor the color and position of the correlation line relative to the shaded area:
If the line is green and within the shaded area, the market dynamics are as traditionally expected.
If the line is red or outside the shaded area, users should exercise caution as this indicates a divergence from typical behavior, which can precede significant market moves or heightened uncertainty.
Options

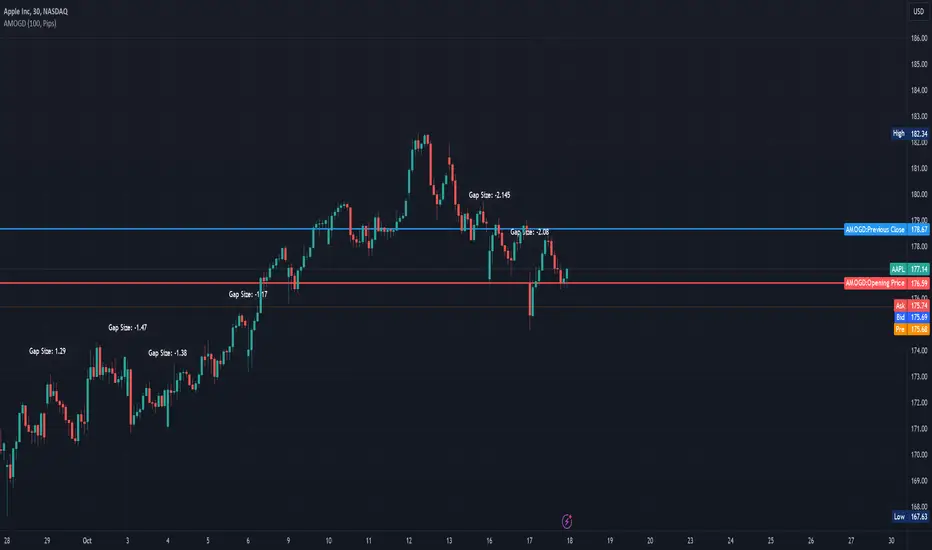
Advanced Market Opening Gap DetectorThe Advanced Market Opening Gap Detector (AMOGD) is a Pine Script indicator designed to help you identify market gaps at the opening of a new trading day. Gaps are areas on a chart where the price of a security moves sharply up or down with little or no trading in between. They are significant as they may indicate a change in market sentiment. This indicator highlights the size and direction of the opening gap, allowing you to potentially adjust your strategies accordingly.
By setting a minimum gap size, you can filter out smaller, less significant gaps, focusing only on larger gaps which may have more substantial implications. You can define the minimum gap size in points or pips, providing flexibility based on your trading preferences and the asset being traded.
How-to Use:
Apply the AMOGD indicator to your TradingView chart.
Configure the minimum gap size and unit (points or pips) based on your preference using the settings panel.
At the opening of each new trading day, the indicator will check for a gap between the previous close and the opening price.
If a valid gap is detected (i.e., the gap size meets or exceeds the minimum gap size specified), the indicator will:
Draw lines to indicate the opening price and previous close.
Display a label indicating the size of the gap.
Highlight the gap on the chart for better visibility.
Importance:
Market gaps can be pivotal points indicating a possible new trend or a continuation of the current trend. Being able to identify and analyze these gaps is crucial for making informed trading decisions. The AMOGD indicator automates the process of identifying and visualizing opening market gaps, saving traders time and allowing for quick assessment of market conditions at the start of each trading day. By setting a minimum gap size, traders can also filter out less significant price movements, allowing them to focus on potentially trend-changing gaps. This tool can be a valuable addition to a trader's toolkit, aiding in the analysis and interpretation of market behavior at the open, which is often a very volatile and crucial period in the trading day.
DISCLAIMER! RISK WARNING!
PAST PERFORMANCE IS NOT NECESSARILY INDICATIVE OF FUTURE RESULTS. TRADERS SHOULD NOT BASE THEIR DECISION ON INVESTING IN ANY TRADING PROGRAM SOLELY ON THE PAST PERFORMANCE PRESENTED, ADDITIONALLY, IN MAKING AN INVESTMENT DECISION, TRADERS MUST ALSO RELY ON THEIR OWN EXAMINATION OF THE PERSON OR ENTITY MAKING THE TRADING DECISIONS.
[BCT] Option Pricing via Markov Chain Monte Carlo SimulationOverview:
This script offers a toolkit for quantitative options trading, using Monte Carlo simulations based on actual historical returns to model potential future price paths for underlying assets. A range of metrics related to options trading are also provided.
Monte Carlo Simulations:
The script employs Monte Carlo simulations to model future price paths based on the historical returns of the underlying asset. These simulated paths are represented as parabolas at the 2-sigma, 25th percentile, and median levels for quick reference.
Methodologies:
For calculating options prices at At-the-Money (or any user-selected strike), two methodologies are used:
Simple Averaging: Takes the mean of the simulated asset price paths.
Kernel Density Estimation (KDE): Applied to the simulated asset price paths to produce a smoothed estimate of its probability density function, thereby aiding in a more nuanced option price calculation.
Bootstrap Resampling:
Bootstrap resampling is specifically applied to the simulated asset price paths to generate an estimate of the standard deviation of the options prices. Note that while bootstrap methods are employed, they serve as statistical tools and do not guarantee statistical reliability.
Metrics Displayed:
Model-Estimated At-the-Money (or selected strike) Straddle Price
Model-Estimated At-the-Money (or selected strike) Call Price
Model-Estimated At-the-Money (or selected strike) Put Price
Model-Estimated Standard deviation for Option Prices from simulated price paths
Underlying Monte Carlo Simulation Results (represented as parabolas at the 2 sigma, 25 percentile and median)
This is not financial advice. Use at your own risk.
Disclaimer: Options trading carries a high level of risk and may not be suitable for all investors. This script is intended to serve as an educational tool and should not be considered financial advice. While designed to aid in decision-making, the script's indicators are not guarantees of performance or outcomes. Always conduct your own due diligence before making trading decisions.

Auto Trailing stoploss By InvestYourAsset💥The Auto Trailing Stop-Loss indicator is a technical indicator that uses the ATR (Average True Range) to calculate a trailing stop-loss for both long and short positions.
💥The signals according to the indicator allows traders to exit from the position before its too late! The indicator can be used to determine when to enter and exit trades.
💥To use the indicator, you simply need to set the input parameters to suit your trading style and risk tolerance. The default values for the parameters are:
p: The ATR period (14)
q: The stop period (20)
x: The multiplier used to calculate the initial high and initial low (1.5)
Calculations:
📈Calculates the ATR using the specified period you can modify ATR period according to your trading style.
📈Calculates the initial high and low stop levels based on the highest high and lowest low over the user defined ATR period.
📈Calculates short and long stoploss levels using the initial high and low stops.
💥Once you have set the input parameters according to your trading style whether you are a day trader or a swing trader, the indicator will plot the short stoploss, long stoploss, and stoploss hit signals on your chart.
💥You can use the indicator to enter and exit trades in a various ways.
For example,
🚀 you could enter a long trade when the price crosses above both red and green lines plotted on the chart. (or when price crosses over both short stoploss and long stoploss.) You could also use the indicator to secure your profits by moving your stop-loss up as the price moves in your favor.
Here is an example of how you could use the indicator to enter and exit trades:
🚀Enter a long trade when the price crosses above the red line or short stoploss.
✅keep Moving your stop-loss upward with the long stoploss or green line.
✅Exit the trade when the price crosses below the long stoploss or green line.
💥You can also use the indicator to protect your existing trades. For example, if you are already in a long trade, you could move your stop-loss up to the short stop when the price moves up 10%. This will help you to protect your profits in case the price starts to move against you.
💥💥some additional tips for using the Auto Trailing Stop-Loss indicator:
✅Use the indicator in conjunction with other technical indicators or your own trading strategy to generate entry and exit signals.
✅Backtest your trading strategy before using it live to make sure that it is profitable.
✅Use the indicator to protect your profits by moving your stop-loss up as the price moves in your favor.
✅ Always follow risk management rules and manage your position sizing according to your risk appetite.
✅ Be aware of the overall trend direction. If the trend is up, you should be looking for bullish reversals or continuations. If the trend is down, you should be looking for bearish reversals or continuations.
This script essentially provides a visual representation of a trading strategy that automatically adjusts stop-loss levels based on market volatility (ATR). It also includes signals for entering long or short positions and visually highlights these signals on the chart.
📣📣Follow us for timely updates regarding future indicators and give it a like if you appreciate the work.📣📣

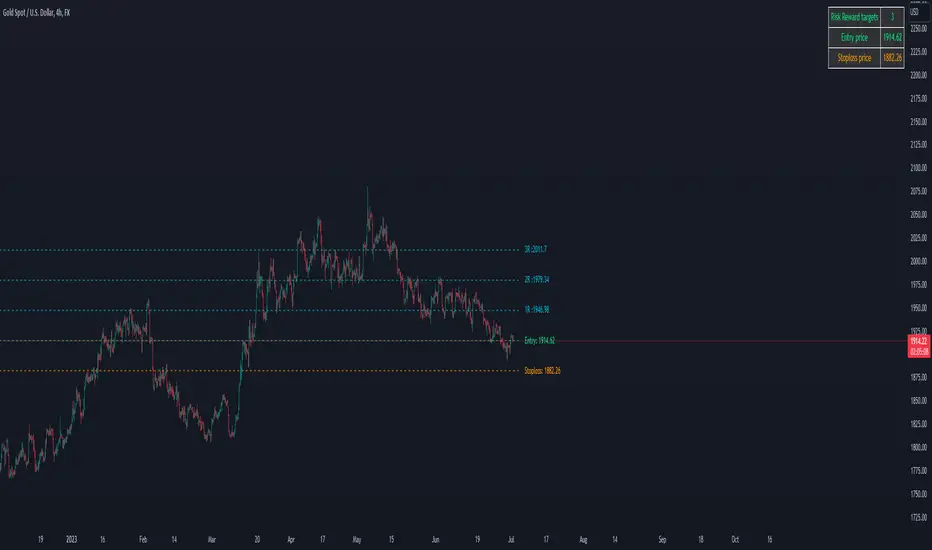
Forex Risk CalculatorForex Risk Calculator 's logical is bring the differential between Entry price and Stoploss price, your acceptable risk and your account size to calculate the loss size first then convert to the 'Lot size' and have another feature like auto scale static target calculate by your loss size with RRR (Risk Reward Ratio). Give you to get easier to manage your orders.
Key Features:
📈 Real-time Risk Assessment: Enter the amount you are willing to risk, and Forex Risk Calculator will calculate the appropriate position size for your trade in real-time.
🎯 Target Lines and Static Target Prices based on RRR: Set your desired Risk-Reward Ratio (RRR), and let Forex Risk Calculator auto-generate target prices according to your RRR. Additionally, place target lines to visualize the expected profit if the price hits that line.
⚙️ Customizable Parameters: Adjust risk percentage, RRR, and other parameters to tailor the tool to your trading strategy.
👁️ User-Friendly Interface: Forex Risk Calculator features an easy-to-use and intuitive interface for both beginners and seasoned traders.
Usage:
Step 1: Place your entry price
Step 2: Place your stoploss price
Step 3: Place your target price
Step 4: Confirm your account detail
Step 5: Bring the 'Lot size' to use
Parameter:
Initial account size
Risk percent
Entry price
Stop price
Target price
Show your target price
Show static target prices
Number of your static target prices
Table position
Text size
Background color
Text color
Border color
Output:
Chart
Entry price line
Stop loss price line (loss in USD)
Target price line (profit in USD)
Table
Account size
Risk percent
Entry price
Stoploss price
Lot size
Highlight Day of WeekA simple indicator that highlights certain days of the week by changing the background color of the chart to a specified color. Each day can be highlighted its own respective color.
This can be used to visually search for patterns based on day of the week.

01 Position CalculatorI present to your attention a calculator for calculating the volume per position.
This calculator is tested on cryptocurrency trading and MOEX liquid shares!
This calculator is suitable for beginners to make it easier to study trading and not get confused at the very beginning with volume calculations, I also use it for virtual trading, a position is drawn on the chart in real time, which shows the amount of loss or profit, that is, with the help of it I I practice different strategies without losing real money on experiments.
All calculations are made at your risk.
You need to indicate what your working deposit is, what percentage of it you are willing to risk per day, the number of your losing trades for one trading session, after which you will stop trading for that day, the amount of risk will be divided by the number of unprofitable trades.
The principle of operation is as simple as possible, you need to indicate three lines on the chart 1 - time line: it is needed so that a position on the chart can be drawn from it. 2 – Entry line for entering a position: the price at which you want to buy an asset. 3 – stop loss line “SL”: the price upon reaching which your losing trade will be closed. If the 3-stop loss line is placed below the 2-Entry line, then a long position will be calculated, if the stop loss line is above the Entry line, then a short position will be calculated. take profit "TP" is calculated automatically according to your settings in the menu.
And so on in order through the menu from top to bottom.
1. Rounding the volume to a whole number: if you select “round”, then the volume of the acquired asset (shares, coins, etc.) will be rounded to a whole number, but be careful if your deposit is $100, and the cost of 1 unit of the asset is more than $1000, then the calculator will give error. MOEX shares are traded only in whole lots, so rounding occurs automatically.
2. Automatic calculation of SL in 1 ATR of the selected TF (auto/manual) (ATR...): if you select auto and specify, for example, ATR 1h, then your “SL” will be calculated automatically and set at a distance from Entry of 1 ATR of the hourly time frame (this is the average price change over 1 hour)
3. Cryptocurrency deposit commission, MOEX deposit commission: I made two different deposits on purpose so as not to change the settings each time, depending on the schedule you choose, MOEX or cryptocurrency, the required deposit and commission will be automatically taken into account.
4. Slippage: this is the percentage of slippage on closing a position at a stop loss.
5. Daily drawdown % (...): this is the percentage of your trading deposit that you are willing to risk for one trading session, the amount at risk.
6. Ratio rice /profit 1/ (...): you need to indicate the SL/TP ratio, based on this your income per trade is calculated and the distance to TP is outlined on the graph.
7. Number of losing trades (...): this is the number of your trades per trading session after receiving which you will end trading for that day, the amount of risk will be divided by the number of losing trades.
8. Position: you can enter the start date of the position and Entry and SL prices
9. ATR – specify the number of last candles to calculate the average price movement of the selected time frame
Now, as for the tables located by default on the left and right at the bottom of the screen, I made windows with descriptions; when you hover the cursor over a cell, a description pops up.
RU
Этот калькулятор проверен, на торговле криптовалюты и ликвидных акциях MOEX!
Этот калькулятор подойдет начинающим, чтоб облегчить изучение торговли и не запутаться в самом начале с расчётами объемов, так же я использую его для виртуальной торговли, на графике в реальном времени рисуется позиция, на которой видно суму убытка или прибыли, то есть с помощью него я отрабатываю разные стратегии, не теряя реальные деньги на эксперименты.
Все расчеты делаются от вашего риска.
Вам необходимо указать какой ваш рабочий депозит, каким процентом от него вы готовы рискнуть на день, количество ваших убыточных сделок на одну торговую сессию, после которых вы прекратите торговлю на этот день, сумма риска будет поделена на количество убыточных сделок.
Принцип работы максимально прост, вам нужно указать на графике три линии 1 - линия время: она нужна чтоб от нее рисовался позиция на графике. 2 –линия Entry входа в позицию: цена по которой вы хотите купить актив. 3 – линия stop loss «SL»: цена при достижении которой закроется ваша убыточная сделка. Если линию 3-stop loss разместить под линией 2-Entry то будет рассчитываться длинная позиция, ели лини stop loss будет над линией Entry то будет рассчитываться короткая позиция. take profit «TP» рассчитывается автоматически согласно вашим настройкам в меню.
И так по порядку по меню с верху в низ.
1. Округление объема до целого: если выбрать «round -округлить», то объем приобретаемого актива (акции, монеты и другого) будет округлен до целого числа, но будьте внимательны если ваш депозит 100$, а стоимость 1 единицы актива более 1000$ то калькулятор выдаст ошибку. Акции MOEX торгуются только целыми лотами потому округление происходит автоматически.
2. Авто расчёт SL в 1 ATR выбранного TF (auto/manual) (ATR…): если выбрать auto и указать, к примеру ATR 1h, то ваш «SL», будет рассчитан автоматически и выставлен на расстоянии от Entry в 1 ATR часового time frame (это усредненное изменение цены за 1 час)
3. Депозит крипто валюты комиссия, депозит MOEX комиссия: сделал специально два разных депозита чтоб каждый раз не менять настройки, в зависимости от выбранного вами графика, MOEX или криптовалюта, будет автоматически браться в расчет нужный депозит и комиссия.
4. Проскальзывание: это процент на проскальзывание закрытия позиции по stop loss.
5. Просадка на день % (…): это процент от вашего торгового депозита, которым вы готовы рискнуть на одну торговую сессию, сумма риска надень.
6. Соотношение рис /прибыль 1/ (…): вам нужно указать соотношение SL/TP на основе этого рассчитывается ваш доход на сделку и на графике обрисовывается расстояние до TP.
7. Количество убыточных сделок (…): это количество ваших сделок на торговую сессию после получения, которых вы закончите торговлю на этот день, сумма риска надень будет поделена на количество убыточных сделок.
8. Позиция: можно вписать дату начала позиции и цены Entry и SL
9. ATR – укажите количество последних свечей для расчета среднего движения цены выбранного time frame
Теперь что касается таблиц расположенных по умолчанию с лева и справа в низу экрана, я сделал окна с описаниями, при наведении курсора на ячейку всплывает описание.

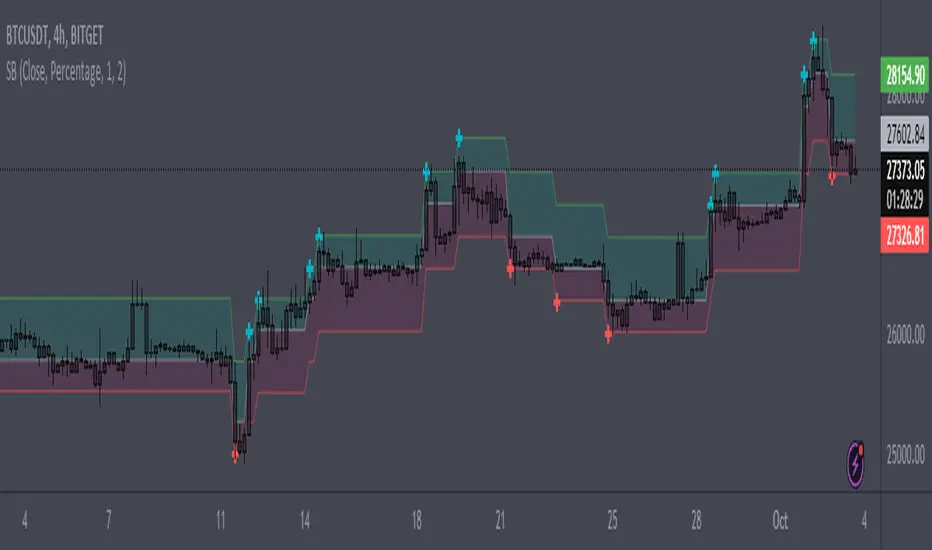
SizeblockPrice change indicator in the form of diagonal rows.
The calculation is based on the percentage or tick deviation of the price movement (indicated in the "Deviation" parameter), which is displayed on the chart in the form of rows.
The row consists of the base middle line, upper and lower limits:
The middle line is the basis for the upper and lower limits of the current row.
The upper and lower limits are deviations from the base middle line of the current row.
The base middle line is equal to the upper or lower limits of the previous row (if the price changes rapidly in one time interval, then the base middle line of the current row is greater than the upper limit of the previous row or less than the lower limit of the previous row by an equal number of deviations depending on the direction of price movement). At the beginning of the calculation, the base middle line is equal to the initial value of the first row.
The "Quantity" parameter determines the deviation for the upper or lower limits depending on the direction of the price movement, and the "U-turn" parameter determines the deviation for changing the direction of the price movement.
The rule for constructing a new row:
The "Source" parameter accepts, depending on the choice, the price of high, low values or the closing price from the time interval of the chart.
When the price reaches the upper or lower limits of the row and goes beyond them, a new row is formed with the same parameters for deviation of the upper and lower limits from the base middle line, depending on the direction of price movement.
By adjusting certain deviations, you can clearly see the local trend and reversal points on the chart.
A useful tool for tracking price direction.
Thanks for your attention!
MeanReversion - LogReturn/Vola ZScoreShows the z-Score of log-return (blue line) and volatility (black line). In statistics, the z-score is the number of standard deviations by which a value of a raw score is above or below the mean value.
This indicator aggregates z-score based on two indicators:
MeanReversion by Logarithmic Returns
MeanReversion by Volatility
Change the time period in bars for longer or shorter time frames. At a daily chart 252 mean on trading year, 21 mean one trading month.

Seasonal Trend by LogReturnSeasonal trend in terms of stocks refers to typical and recurring patterns in stock prices that happen at a specific time of the year. There are many theories and beliefs regarding seasonal trends in the financial markets, and some traders use these patterns to guide their investment decisions.
This indicator calculates the trend by "Daily" logarithmic returns of the past years.
So, you should use this indicator with a "Daily" mainchart.
Note: If you select more years in the past than data is available, the line turns red.

Tetra Trendline Indicator 2.0This script is designed to help traders visualize and identify potential overbought and oversold conditions in a financial instrument's price chart using four customizable trendlines. It also provides the option to set alerts for these conditions. Users can adjust the input parameters to tailor the indicator's behavior to their trading preferences.
Input Parameters: The script allows users to configure various input parameters to customize the behavior of the indicator. These parameters include:
showTrendlineX: Boolean inputs to control whether to show each of the four trendlines (Trendline 1, Trendline 2, Trendline 3, and Trendline 4).
trendlineColorX: Color inputs to specify the color of each trendline.
trendlineWidthX: Numeric inputs to set the width of each trendline.
trendlineLengthX: Numeric inputs to determine the length of each trendline.
alertOnTrendlineXBreak: Boolean inputs to enable or disable alerts for each trendline when they are breached.
Trendline Calculations: The script calculates the coordinates for each of the four trendlines. It does this by identifying the starting and ending points of each trendline based on user-defined parameters and the highest or lowest price levels within a specified length.
Plotting Trendlines: The script uses the plot function to display the calculated trendlines on the price chart. It also fills the area between the trendlines to visually emphasize the region.
Alert Conditions: The script defines alert conditions for each trendline. Alerts are triggered when certain price conditions are met:
Trendline 1: An alert is triggered when the price crosses above the Trendline 1 (indicating overbought conditions).
Trendline 2: An alert is triggered when the price crosses below the Trendline 2 (indicating oversold conditions).
Trendline 3: Similar to Trendline 1, an alert is triggered when the price crosses above Trendline 3 (overbought).
Trendline 4: Similar to Trendline 2, an alert is triggered when the price crosses below Trendline 4 (oversold).

BE - Strategy Builder ToolkitIndicator vs Toolkit:
This is definitely not an indicator, hence this doesn't do any kind of analysis nor provide meaningful outputs where you can take trading decisions out of it.
This is a Strategy Builder Toolkit which works like any other broker/3P applications, which helps traders to build their own custom/ predefined strategies, save / deploy them at their wish.
Idea Behind Developing this Toolkit: I am sure many of traders have overcome scenarios where, on break of x level he wants to initiate straddle else he wants to initiate Iron Condor. Some of them wants to deploy custom strategies only at certain time or at certian price levels.
It becomes pretty difficult to track markets when you are away from desk and if you dont adjust the strategy legs, you are incurring big drawdowns. There are many if's and buts to deploy strategies.
To overcome such challenges, i have built this toolkit.
Note: As this is just a toolkit, you should conduct your analysis to gauge the market direction outside the perview of this. Once you know the view / direction of the script. you can use this toolkit in action to
1. Deploy Strategy at (Desired levels| Desired time|Confired Levels|Confirmed Volumes)
2. Strategy can be Prebuilt / Custom Built
3.1 Set SL, Target for Directional view (Trail SL aswell)
3.2 Set Upside or Downside Target for Non Directional view (Trail SL aswell)
3.3 let the strategy play with out SL|Targets for consolidation view.
4. Adjust Legs by closing existing position and opening fresh position or place fresh adjustments
5. Book partial Profits with in the zone.
How the Toolkit is buit: Script uses text related functions to understand the custom input given in the indicator and coverts into a strategy and deployes them as a algo trading (Next Level Bot) with the additional parameter set for SL|Target|Entry levels.
Understanding the settings:
1. Strike Difference: is basically a value between each strike. eg: Banknifty : 100, Nifty & Finnifty: 50
2. 1 Lot Qty: Qty per Lot accepted by exchange|Broker. eg: BNF: 15, Nifty: 50, Finnifty: 40
3. Lot Multiplier: If you build strategy with 1 lot and if you set the Lot multiplier as 2 then strategy gets deployed with 2 lots. for eg. If i have saved strategy to buy BNF 1 ITM with 1Lot and have set lot multipier to 3 then at the time of deploying the trade it pushes as 3 lots (3 * 15Qty per lot = 45Qty) of 1 ITM strike.
4. Symbol Name: Select the Symbol Name here.
5. Current & Next Week Expiry Date: Specify the expiry Dates in the format as supported by your broker.
6. Broker Name, Exchange & Product Type: hope it is self explanatory.
IMPORTANT settings to understand:
7. Triggere Entry Post (optional): You have to specify when you want to deploy the strategy. For instance, if i want to deploy my strategy at 30 min after market open which is 9:45 am, then i have specify as 0945. Another instance where i want to close my strategy at 3 PM then you have to specify as 1500. Uncheck this option if you are not worried about the time of entry.
My personal Used Case: On the Expiry -1 Day at 0916 (9:16AM) i will buy 6 lots of 8OTM PE & CE and Sell 2 lots 7OTM, 2 lots of 6OTM and 2 lots of 5OTM and close the trade by 1100 (11AM).
8. Price Levels (Confirmed vs UnConfirmed) (Optional): Confirmed is basically price is sustained at|around the specified price level, where in UnConfirmed is basically the touch of the specified level.
for instance if i want to deploy straddle only if price is sustained at 100. then, i would specify GE with 100 in price input settings, and check thee Confirmed price box. Assuming if LTP is running at 98 and with the above settings it will only deploy the trade upon price is sustained at 100 level for 3 to 5 candles not at the touch of 100.
Uncheck this option if you are not worried about the Entry Price.
9. Confirmed Volume (Optional) (Long or Short): Basis your view|direction of the strategy. you can get additional confirmation. At the time of entry you want volume to be present towards the direction of the strategy. Uncheck this option if you are not worried about the volume or Volume doesn't exist for the chart loaded.
10. Alert Types: It consists of 3 Long & 3 Short directional (prebuilt) strategy along with Close Strategy, Close Specified Symbols Only & Design Custom Strategy Option.
10.1 : Slow Upmove - If you are having bullish view and predict that prices shall go slow and steady. This strategy can be deployed where you get the benifit of time decay as well while the delta play in favor of you. (viseversa for Slow DownMove)
10.2 : Fast Upmove - If you are having bullish view and predict that prices shall go fast. This strategy can be deployed where you get the smaller benifit of time decay as well while the delta play in favor of you. (viseversa for Fast DownMove)
10.3 : Vol Upmove (Volatality)- If you are having bullish view and predict market is tend to be volatile. This strategy can be deployed where you get the benifit of volatility as well while the delta play in favor of you. (viseversa for VolDownMove)
10.4 : Close Trade - You can use this option close the deployed strategy completely.
10.5 : Close Symbols - You can use this option close few of the symbols for the strategy deployed.
10.6 : Custom: Use this option to design you own custom strayegy with the syntax below:
Sample 1:
N|B|C2|3
N refers to Nextweek Expiry (if C is used then Current week expiry)
B refers to Buy (if S is used then Sell)
C refers to Call | CE (if P is used then PE or Put)
2 refers to 2OTM (for CE any Postitive number refers to as OTM and for PE it will be treated as ITM strikes & 0 refers to as ATM - viseversa for Negative Numbers)
3 refers to as 3 Lot
With the syntax of N|B|C2|3 - strategy will be deployed as "Buy 3 lots of 2 OTM Call of Next expiry"
Sample 2:
C|S|P-3|3|10|30
Above syntax means: SELL Current Expiry 3 Lots of 3 OTM Put Strike with 10 SL and 30 TGT
Sample 3:
C|S|C10|3|Default
Above syntax means: SELL Current Expiry 3 Lots of 10 OTM CALL Strike with 50% SL and 95% TGT
Sample 4:
C|B|C-2|3|40%|50%
Above syntax means: BUY Current Expiry 3 Lots of 2 ITM CALL Strike with 40% SL and 50% TGT
Sample 5: Long Straddle
C|B|C0|3
C|B|P0|3
Above syntax means: BUY Current Expiry 3 Lots of ATM CALL & PUT Strike
Sample 6: Iron Butterfly
C|B|C1|1
C|S|C0|1
C|S|P0|1
C|B|P-1|1
Above syntax means: Sell Current Expiry 1 Lots of ATM CALL & PUT Strike and BUY 1OTM Call & Put Strike
Sample 7: Diagonal Spread
C|S|C2|1
C|S|P-2|1
N|B|C3|1
N|B|P-3|1
Above syntax means: Sell Current Expiry 1 Lots of 2OTM CALL & PUT Strike and BUY 3OTM Call & Put Strike of Next Expiry.
To Understand how to deploy Strategy with defined Adjustments. For instance i want to deploy Iron Condor with Adjustments for BNF when the price is currently running at 45000.
C|B-|C3|1
C|S*|C2|1
C|B--|P-3|1
C|S**|P-2|1
At:2|C|S|C2|1
At:2|C|B|C3|1
At:-2|C|S|P-2|1
At:-2|C|B|P-3|1
On:2|*
On:-2|**
On:2|-
On:-2|--
With the above syntax: Intial trades are placed with
BUY BANKNIFTY45300CALL(Current Expiry) 1 Lot
BUY BANKNIFTY44700PUT(Current Expiry) 1 Lot
SELL BANKNIFTY45200CALL(Current Expiry) 1 Lot
SELL BANKNIFTY44800PUT(Current Expiry) 1 Lot
Toolkit tracks the price and holds the adjustments.
We may start to bleed on the sold leg (45200CALL) once the price crosses 45200. Hence if the price crosses 2 strike upside as specified with syntax " On:2|* " where * is a character tagged to Sold Call Leg. it closes the 45200 Call.
Similarly, " On:2|- " where - is character tagged to Brought Call Leg. it closes the 45300 Call, as soon as prices reaches 2 strike upside.
At:2|C|S|C2|1
At:2|C|B|C3|1
With the At Statements you can place the fresh adjustments legs. Above syntax refers to Once the price reaches 45200 it places below adjustment legs.
BUY BANKNIFTY45500CALL(Current Expiry) 1 Lot
SELL BANKNIFTY45400CALL(Current Expiry) 1 Lot
Note: Similarly If prices reaches downside with the On and At Sytax it places the necessary adjustment legs accordingly.
11. SL & TGT - You can specify SL, TGT or Upside & Dowside TGT during the entry conditions and Stratey shall be closed upon hitting either the SL or TGT accordingly.
12. On % Tgt & Lock % SL: This option is used for Prebuilt strategy where you can lock the Profit | Set Revised SL upon hitting specified TGT percentage.
13. Close Symbols: This option is used if you select Alert type as Close Symbols (Ref - 10.5 : Close Symbols) for specified list of symbols Alert shall be pushed to close the open positions of those symbols.
DISCLAIMER: No sharing, copying, reselling, modifying, or any other forms of use are authorized for our documents, script / strategy, and the information published with them. This informational planning script / strategy is strictly for individual use and educational purposes only. This is not financial or investment advice. Investments are always made at your own risk and are based on your personal judgement. I am not responsible for any losses you may incur. Please invest wisely.
Happy to receive suggestions and feedback in order to improve the performance of the indicator better.

Strategy:Reversal-CatcherWhat
This is a plain and vanilla reversal based strategy for intraday (15m) timeframe on Futures prices of the assets.
Now what all it comprises of?
It finds out the dynamic support & resistance from Bollinger Band (20 period, 1.5 std dev).
It finds out the potential divergence of price deviation from 5 period exponential moving average (EMA).
If the previous candle (N-1) shows a divergence it confirms the reversal by checking the present candle (N) to be closed inside the Bollinger Band.
It confirms the momentum by checking RSI shows a crossover/crossunder to oversold (30) / overbought (70) region.
It also confirms whether the trend is up (then only reversal trade to short) or down (then only reversal trade to long). The trend is checked with EMA-21 and EMA-50.
Re-affirmation Condition : It re-affirms the position of two successive candles called as `hhLLong` and `hhLLShort` in the script.
Why
In Indian context, retail participants are pre-dominantly (yes- 80% of Indian daily volume) Options buyers mainly in weekly indices (Nifty, BankNifty, FinNifty, CNXMidcap, Sensex, Bankx .. well everyday is expiry now in India, except -- Thank God -- Saturday & Sunday).
And in Index Options the momentum plays a big role.
If one can catch a good reversal point the potential of high Risk-to-Reward trade (hence earn handsomely) is very likely (please note: there is no holy grail in trading. Nothing works 100%).
So this is the attempt to catch a reversal.
Re-affirmation of Reversal
hhLLong : It's a reversal point after an uptrend. It checks the relative positioning of current candle compared to that of previous candle. [The details are in the script. Check for variable hhLLong in script.
hhLLShort : It's a reversal point after a downtrend. It checks the relative positioning of current candle compared to that of previous candle. [The details are in the script. Check for variable hhLLShort in script.
Unique-ness
What's unique in it? Why we decided to publicly share this:
Already given the context of The Great Indian Options Buyers community. It should be helpful to them, we believe.
It takes Very Less Number of Trades with High Accuracy . Please check the result in NSE:NIFTY1! in 15m timeframe. 71% accuracy with roughly a trade in a month.
There is no point giving brokers' the brokerages taking 10 trades a day and ending not-so-good EoD. Better lets take less trades with better result possibility. .
Mention
There are many people uses this variation of Bolling Band, 5EMA
Many people use RSI, trends and relative positioning of candles.
--> We are grateful to all of them. It's really difficult to mention everyone's name. But all people somehow influence the thought process. Thanks for all of them.
Statutory Disclaimer
There is no silver bullet / holy grail in trading. Nothing works 100% time. One has to be careful about the loss (s)he can bear in case of the trade goes against.
We, as the author of this script, is not responsible for any trading or position decision one is taken based on the outcome of this.
It is our sole discretion to change, add, delete the portion or withdraw the whole script without any prior notice or intimation.
In Indian Context : We are not SEBI registered, will never be SEBI registered.

Earnings_MFCThe Earnings_MFC indicator displays statistical information of the price movement of the selected asset as follows:
TAGS: Label on each "earning day" with information on the movement that the price has made from the close of the day before the announcement to:
the opening of the next day (Close to Open - GAP)
the close of the next day (Close to Close - CTC)
HISTOGRAM: Histogram of the times the price has moved in each price band (number of configurable bands).
Each movement has been taken and represented in histogram format, so that visually you can see the number of times the price has exceeded a certain value. Within each band is numbered the number of times the price has reached that area
The histogram has two overlapping data:
....+ A main histogram (red/green stripes)
....+ A secondary histogram (black stripes)
....+ This is so that you can configure which data to see in each one: the GAP movement data or the CTC movement data
The maximum and minimum movement has been indicated (for the main histogram)
It has been indicated, both for positive and negative movements, which is their first (gray) and second (red/green) standard deviation (for the main histogram)
TABLE: A table is included with the following information (you can hide this table):
Summary of statistical data:
....+ Number of samples
....+ Maximum UP movement and average (for both CAP and CTC)
....+ Maximum DOWN movement and average (for both CAP and CTC)
....+ Maximum movement UP or DOWN and average (both for CAP and CTC)
List of all past Earnings (according to the history available in the chart) with their movements
HOW TO USE:
For Options traders it can come in handy to position themselves with Sell PUTs / Sell CALLs / Spreads or Iron Condors. Considering the probabilities of the movement (taking into account that past movements do not ensure future movements), this indicator can help in the decision making for sell strikes.
REMARKS:
Use only in Daily timeframe
Depending on the history of the asset (whether the user is PRO or not FREE) there will be more data

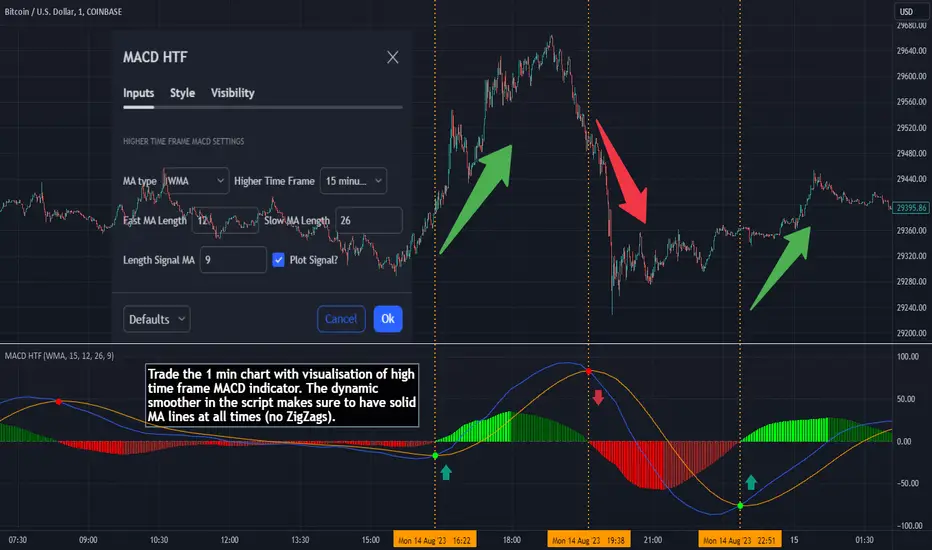
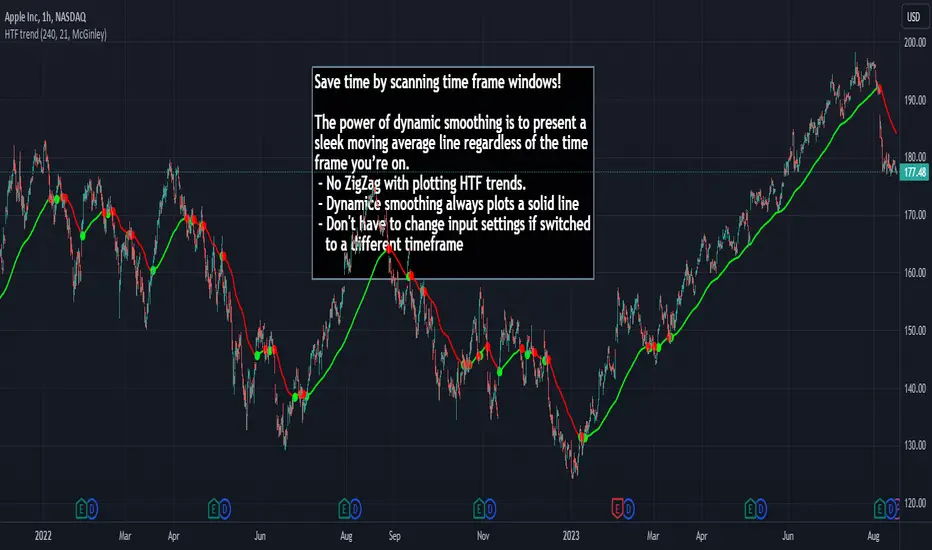
MACD HTF - Dynamic SmoothingEnhancing Your 1-Minute Trades with Dynamic HTF MACD Smoothing
Ever found yourself glued to a 1-minute chart, trying to catch every minor price movement, yet feeling like you're missing the bigger picture? Picture this: a solid MACD line on that chart, dynamically smoothed from a higher timeframe (HTF). This tool offers two significant benefits over other existing HTF MACD indicators:
User-Friendly Interface: No need to manually adjust input parameters every time you switch to a different timeframe.
Smooth Charting: Say goodbye to the zigzag lines that often result from plotting higher time frame resolutions on a lower time frame.
Understanding the MACD
The Moving Average Convergence Divergence (MACD) is one of the most widely used and trusted technical indicators in the trading community. Invented by Gerald Appel in the late 1970s, the MACD helps traders understand the relationship between two moving averages of a security's price. It consists of the MACD line (difference between a 12-period and 26-period Exponential Moving Average) and the Signal line (9-period EMA of the MACD line). When the MACD line crosses above the Signal line, it's viewed as a bullish signal, and vice versa. The difference between the two lines is represented as a histogram, providing insights into potential buy or sell opportunities.
Features of the Dynamic HTF MACD Smoothing Script
Time Frame Flexibility: Choose a higher timeframe to derive MACD values and apply dynamic smoothing to your current timeframe.
Multiple Moving Averages: The script supports various MA types like EMA, SMA, DEMA, TEMA, WMA and HMA.
Alerts: Get real-time alerts for MACD crossover and crossunder.
Customizability: From the type of moving average to its length, customize as per your strategy.
Visual Indicators: Clearly plots signals when MACD crossover or crossunder occurs for potential entries.
At last
A massive shoutout to all the wizards and generous contributors in the community! You inspire innovations and new tools, paving the path forward. Here's to a community where we learn and build together. Cheers to collective growth!
HTF Trend Filter - Dynamic SmoothingSummary of the HTF Trend Filter
The Higher Time Frame (HTF) Trend Filter is a cutting-edge tool crafted for traders who want to scan moving average trend lines time efficiently. At its core, it harnesses the power of dynamic smoothing to present a sleek moving average line regardless of the time frame you’re on. Here's a glimpse of the advantages you unlock with the HTF trend filter:
Dynamic Smoother: Ever been irked by jagged lines on your chart? With the dynamic smoother, those days are gone. The smoother streamlines HTF moving average line on your current lower time frame chart.
Time Efficiency: Time is of the essence in trading. With this tool, you can nimbly toggle between time charts without the hassle of readjusting input parameters, ensuring your screening process remains unhindered.
Features of the Script
Variety of Moving Averages: The script caters to different trading styles by offering a plethora of moving average types, ranging from the classic SMA and EMA to the innovative Hull and McGinley Dynamic MAs.
Dynamic Smoothing: This is the script's pièce de résistance. The dynamic smoothing factor is ingeniously derived by taking the ratio of minutes of the higher time frame to the current time frame. This ensures the moving average remains fluid and consistent across different time frames, eliminating the common pitfalls of jagged moving averages.
Reversal Indicators: It includes a reversal indicator. Green circles pinpoint the start of a potential uptrend, while red ones signify a potential downtrend.
Customizable Alerts: To ensure you never miss a beat, the script is equipped with customizable alert conditions.
Trading Idea
The essence of trading lies in confirming assumptions and validating trends. The HTF Trend Dynamic Smoother positions itself as a potential game-changer in this domain. One could consider using the HTF trend dynamic smoother as a supplementary confirmation tool alongside other primary indicators. For instance, if you're plotting a moving average on a lower time frame, toggling the HTF smoother can offer a broader perspective of the trend from a higher time frame. By ensuring alignment between these perspectives, you could potentially trade with increased confidence, reinforcing your lower time frame strategies with higher time frame confirmations. It's worth noting, however, that while this method can offer additional layers of information and validation, it doesn't replace due diligence. Every trade decision should be the culmination of thorough analysis, and no tool should be solely relied upon for decision-making.
Limitations
While the HTF Trend Filter is an exceptional tool, like all tools, it has its constraints. Lower Time Frame Dependency: For the indicator to function optimally, it's paramount to ensure that the time frame open is always lower (or equal) than the one selected in the input parameters. This limitation is crucial to remember as the dynamic smoother's accuracy hinges on this condition.
In conclusion, the HTF Trend Filter - Dynamic Smoothing is a remarkable blend of innovation and efficiency, tailored for traders who demand fast screening of higher time frame MA trends. Due to it simplistic design it gives a user-friendly experience. However, always remember the golden rule of trading: utilize tools as part of a comprehensive strategy, never in isolation.
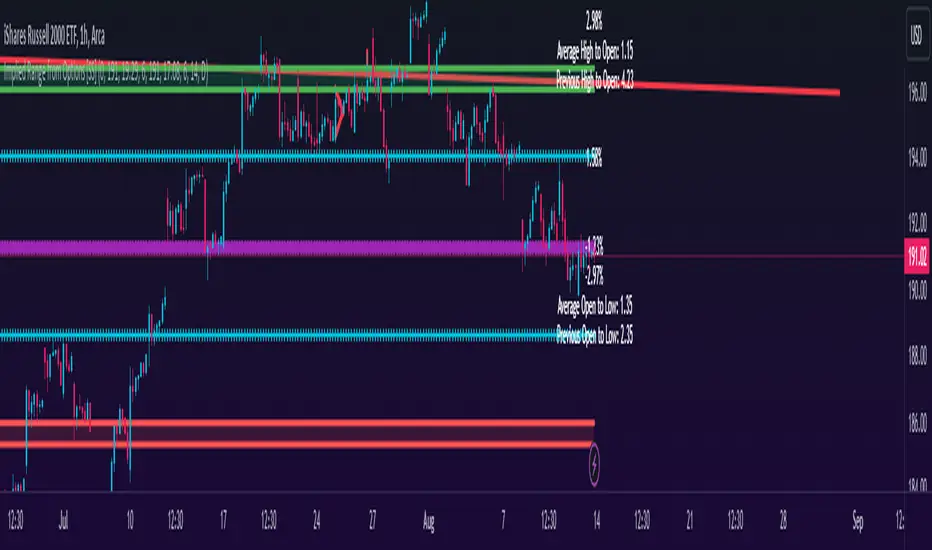
Implied Range from Options [SS]I have been promising to post this for a while, but I just needed to make sure that a) there were no similar indicators already available and b) make it a bit more user friendly.
So here it is, a basic indicator that will display the implied range from options.
In addition to displaying the implied range from options, it will provide some secondary information to help add context to the implied range. Those are shown in the chart below:
The indicator will list various precents at each point to the upside and to the downside. This is the percent move required, based on the current close price, to obtain any point in the implied move range.
In addition, the indicator will display the average move from open to high and open to low over a user defined period (default to 14 candle period) as well as the previous open to high and open to low move from the previous day.
This is to give you context of:
a) How much of a % increase or decrease is required to reach the implied ranges; and
b) How does the implied range compare to the ticker's average moves.
An increased implied range that exceeds the ticker's average move can alert you that the market is pricing in an above average move. This can be helpful and alert you to potential news releases or other fundamental things that have the potential to move the market.
How to Use the indicator:
So unfortunately, this indicator requires a bit of manual input. I was going to do an auto IV calculcation using Black-Scholes Model but just to be more rigorous in accuracy, I decided to, for now, leave it at a manual input. So when you launch the settings menu, this is what you will see:
You can collect all of this required information from your broker. Inversely, you can collect it online for free from various services such as Barchart or COBE's exchange website. The easiest way is to just pull it from your broker though.
Make sure, if you are doing weekly options to see the weekly range, you set the timeframe to 1 week. The timeframe function will calculate the average move over the desired timeframe length. So if you are doing a 0 dte for the next day, you want to see the intra-day range and will select the 1 day timeframe. It will then present to you the range averages and information on the daily timeframe for you to compare to the implied options range.
Same for the weekly, monthly, yearly, etc.
Additional options:
The indicator provides the midline average and midway points, to add static targets if you are trading the implied range.
These can be toggled on or off in the settings menu:
As well, as you can see, you can also toggle off the range labels.
There is also an offset option. This allows you to extend the range into the future:
Simply select how many candles you would like to plot the range in advance.
Closing remarks
That is the indicator. Its very simple, but it is handy. I was never one to pay attention to option pricing data, but I have been plotting it out daily and weekly these past few weeks and it does add a bit of context in terms of what the market is thinking. So I do recommend actually adding it to your repertoire of analyses going into the weeks and months, and really just paying attention to how the average ranges compare to what the market is pricing in.
One quick suggestion, select the strike price that aligns with the closing price of the ticker. This gives you a better representation of the range.
Safe trades everyone and leave your comments, questions and suggestions below!
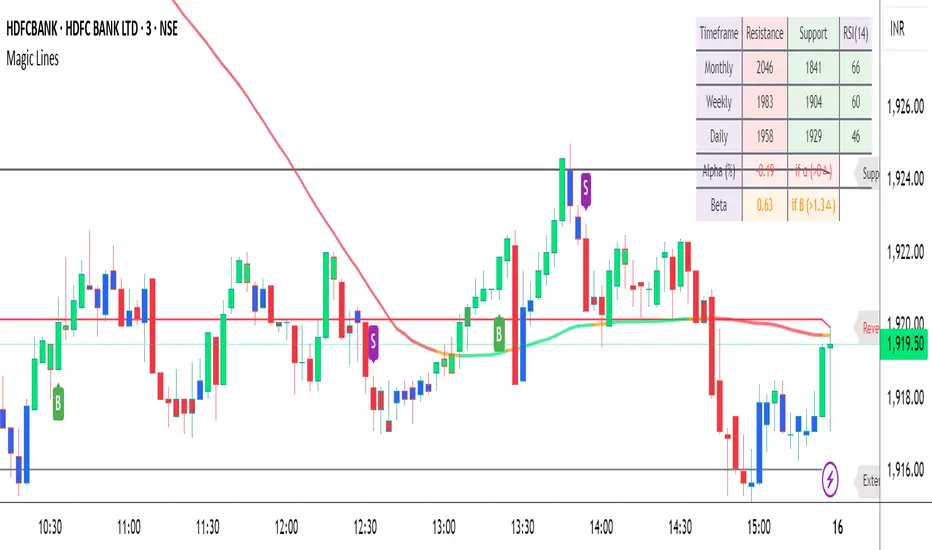
Magic LevelsPS MODS : This indicator calculate the levels based on IndiaVIX, volumes on FnO, cofficient and factor to reach on the level. Hope this can help you to understand the functionality of this Indicator
This indicator is used for draw levels or "Magic Levels/Lines" for Nifty, Bank Nifty and FnO futures, based on volatility (indiavix) calculations. This powerful tool is designed to provide insights into market volatility and assist traders and investors in making informed decisions in the Indian stock market.
As of now the indicator draws levels only on Bank Nifty and Nifty. Soon we'll publish the next update supporting all FnO Futures and stocks.
The India VIX, often referred to as the "Fear Index," is a popular measure of market volatility and investor sentiment. It quantifies the market's expectations of near-term volatility by calculating the implied volatility of NIFTY options. The VIX Levels Indicator utilizes these calculations to draw key levels on price charts, enhancing traders' understanding of potential market movements.
The indicator's main function is to identify critical support and resistance levels derived from IndiaVIX data. We considered to volatility of all the FnO instruments and calculated the mean value keeping the day into consideration while performing the calculations. These levels serve as significant reference points that can help traders gauge potential price reversals, breakouts, and trends. By integrating the Magic Levels Indicator into their analysis, traders can gain a comprehensive view of market dynamics and improve their timing for entering or exiting positions.
Traders can customize the VIX Levels Indicator to suit their preferences, adjusting parameters such as time period where the default is 1 day. This flexibility allows traders to adapt the indicator to different trading strategies and timeframes. Whether a trader focuses on intraday scalping or swing trading, the Magic Levels Indicator can be a valuable addition to their technical analysis toolkit.
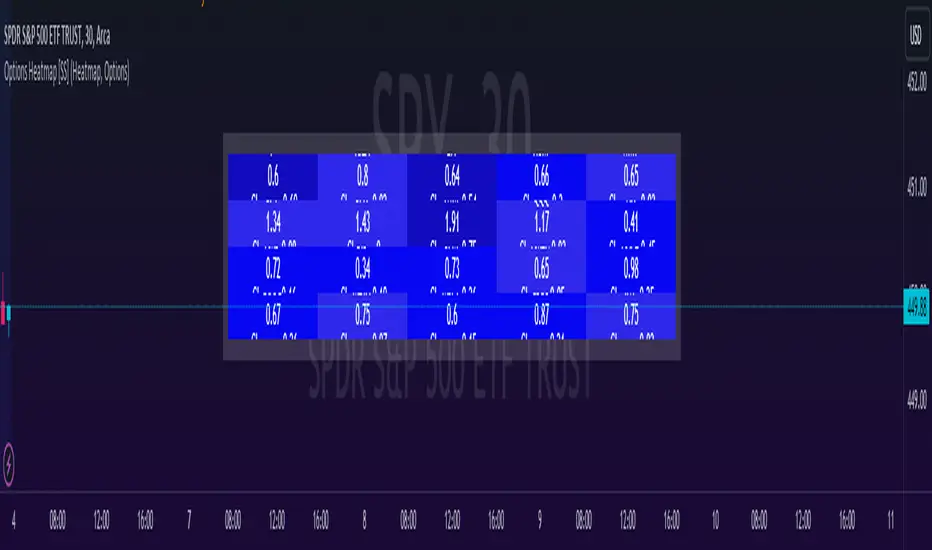
Options & Leveraged Shares Heatmap This is the leveraged share/option heatmap / screener.
Tradingview offers a few different tickers that have PTCR data on the daily timeframe. So I was able to pull those few tickers that display the PTCR data and format it into a heatmap.
I also had some room to add leveraged share data as well.
It is pretty self explanatory but I will go over it really briefly:
The timeframe is 1 D. This cannot be changed because this is the only timeframe available for the PTCR data.
It will pull the current day PTCR as well as the previous day PTCR and display the PTCR and change value.
The screening will be done according to the 1 day change.
You have the ability to select the option to sort by Max and Min or sort by heatmap:
Displaying max and min will show you the max positive and negative change among all the available tickers.
Max positive = bearish, as this indicates an uptick in Puts.
Max negative = bullish, as this indicates a decline in Puts.
If we flip over to the leveraged shares, it is the same:
To keep it consistent, the leveraged share ratio is displayed similar to PTCR. It is Sell to Buy ratio. The higher the ratio, the more selling and vice versa.
Thus, the same rules apply. Max positive = bearish and max negative = bullish.
If you want to display the heatmap, this is what it will look like:
The darker the blue, the higher the change in either a negative or positive direction. The same for the leveraged shares:
And that is the indicator.
Hopefully you find it helpful. I like to reference it at the end of each day to see how things are looking in terms of positioning for the following day.
Leave your comments/questions and suggestions below.
Safe trades!
BE - Spread_IndicatorSpread Indicator: An Overview Driven by the concept of forethought. The indicator predicts the range for the day and divides it into two or three Levels (upper, middle, and lower).
These ranges are drawn from possible supply and demand zones as well as potential price consolidation zones which has happend in the rolling number of days in the past.
It's true that market respects history. Which means the zones which are untested and created new in recent past shall be respected in the future days. Also the most respected Zones switch between support and resistance based on the price and volume pumped into the market.
Calucations Involved In the Indicator:
Indicator takes into account Factrol points, Fibonachi and its Retracements along with Channel and Candle Ranges to calculate the levels accordingly.
Levels Information:
Levels should be Treated and Traded the way like POC (Point Of Control). Price within the levels are basically controled by the levels above and underneath.
Converting idea to TradeOpportunity:
One can look into deploying IronCondor, while it is within the Zone also One Can deploy Long Straddle when the levels are Tested.
My personal Observation not a Trade Recommendation
With an Option Buyer view, I have been testing this indicator on the Index (BankNifty, FinNifty & Nifty) on 5 Min TF and 15 Min TF. Banknifty Works Well with Bull & Bear Spreads and FinNifty along with Nifty Works Well with Long Straddle & Long Strangle.
Happy to receive Suggesstions and feedback to improvise it with better option strategy.
Features:
1. Integrated with NLB for AlgoTrading.
2. Timely Alerts for Levels, Formation, Breach, TestOf Levels, CrossOvers.
3. Position Can be traded as CarryForward or Intraday.

Binary Option Ultimate Backtester-V.1[tanayroy]The Binary Option strategy backtester gives the user extensive power to test any kind of strategy with advance trade management rules.
The strategy tester accepts external scripts as strategy sources. You can add your strategy and test it for historical stats.
Few assumption regarding strategy tester:
We are opening position at next candle after signal come
We are taking the position at opening price
Our call will be profitable if we get a green candle and put will be profitable if we get a red candle
We can open only one trade at a time. So if we are in trade, subsequent signals will be ignored.
How to make your strategy code compatible for strategy backtesting?
In your strategy code file add following lines:
Signal = is_call ? 1 : is_put ? -1 : 0
plot(Signal, title="🔌Connector🔌", display = display.none)
Is_call and is_put is your buy and sell signal. Plot the signal without displaying it in the chart. The new TradingView feature display = display.none, will not display the plot.
All Input options
Group: STRATEGY
Add Your Binary Strategy: External strategy to back test.
Trade Call/Put: Select CALL, to trade Call, PUT, to trade Put. Default is BOTH, Trading Call and Put both.
Number of Candles to Hold: How many candles to hold per trade. Default 1. If you want to hold the option for 30 minutes and you are testing your strategy in 15m intervals, use 2 candle holding periods.
GROUP: MARTINGALE
Martingale Level: Select up to 15 Martingale. Select 1 for no Martingale.
Use Martingale At Strategy Level: Instead of using Martingale per trade basis, using Martingale per signal basis. Like if we make a loss in the first signal, instead of starting martingale immediately we’ll wait for the next signal to put the martingale amount. For example if you start with $1 and you lose, at the next signal you will invest $2 to recover your losses.
Strategy Martingale Level: Select up to 15 Martingale at strategy signal level. Only workable if Use Martingale At Strategy Level is selected.
Type of Trade: Martingale trade type. Only workable if we are using Martingale Level more than 1.
It can be:
“SAME”: If you are trading CALL and incur a loss, you are taking CALL in subsequent Martingale levels.
“OPSITE”: if you are trading CALL and incur a loss, you are taking PUT in subsequent Martingale levels.
“FOLLOW CANDLE COLOR”: You are following candle color in Martingale levels, i.e if the loss candle is RED, you are taking PUT in subsequent candles.
“OPPOSITE CANDLE COLOR”: You are taking opposite candle color trade, i.e if the loss candle is RED, you are taking CALL in subsequent candle.
GROUP: TRADE MANAGEMENT
Initial Investment Per Option: Initial investment amount per trade
Payout: Per trade payout in percentage
Use Specific Session: Select to test trade on specific session.
Trading Session: Select trading session. Only workable if Use Specific Session is selected.
Use Date Range: Select to use test trades between dates.
Start Time: Select Start Time. Only workable if Use Date Range is selected.
End Time: Select end Time. Only workable if Use Date Range is selected.
Early Quit: Select to quit trade for the day after consecutive win or loss
Quit Trading after Consecutive Win: Number of consecutive wins. Only workable if early Early Quit is selected.
Quit Trading after Consecutive Loss: Number of consecutive losses. Only workable if early Early Quit is selected.
Buy/Sell Flip: Use buy signal for sell and sell signal for buy.
GROUP:STATS
Show Recent Stats: Show win trades in last 3,5,10,15,25 and 30 trades.
Show Daily Stats: Day wise win trades and total trades.
Show Monthly Stats: Month wise win trades and total trades.
Result and stat output:
Back tester without any strategy.
Strategy added with default option.
Stats with 7 Martingales. You can test up to 15.
Optional Stats:
Example Strategy code used :
//@version=5
indicator("Binary Option Strategy",overlay = true)
length = input.int(7, minval=1)
src = input(close, title="Source")
mult = input.float(3.0, minval=0.001, maxval=50, title="StdDev")
basis = ta.sma(src, length)
dev = mult * ta.stdev(src, length)
upper = basis + dev
lower = basis - dev
fab_candle_upcross=(high< upper and low>basis)
fab_candle_downcross= (high< basis and low>lower)
up_cross=ta.barssince(ta.crossover(close,basis))
down_cross=ta.barssince(ta.crossunder(close,basis))
is_first_up=false
is_first_down=false
if fab_candle_upcross
for a=1 to up_cross
if fab_candle_upcross
is_first_up:=false
break
else
is_first_up:=true
if fab_candle_downcross
for a=1 to down_cross
if fab_candle_downcross
is_first_down:=false
break
else
is_first_down:=true
//strategy for buying call
is_call=(is_first_up or is_first_down ) and close>open
//strategy for selling call
is_put=(is_first_up or is_first_down ) and close<open
Signal = is_call ? 1 : is_put ? -1 : 0
plot(Signal, title="🔌Connector🔌", display = display.none)

Binary Option Strategy Tester with Martingale-Basic V.2In Binary options, strategy testing is a bit different. The strategy result depends upon expiry intervals and payout ratio.
My previous script was a try to resolve this but has some bugs in specific choices. The new version overcame those and added some new features useful for binary option strategy testing.
Assumption:
We are opening position at next candle after signal come
Chart interval is option expiry time.
We are taking the position at opening price
Our call will be profitable if we get a green candle and put will be profitable if we get a red candle
We can open only one trade at a time. So if we are in trade, subsequent signals will be ignored.
All Input Options:
Test Call/Put individually or both. Default BOTH
Select up to 5 Martingale levels. Default 2
Type of Martingale Trade. Default “SAME”
“SAME”: If you are trading CALL and incur a loss, you are taking CALL in subsequent Martingale levels.
“OPSITE”: if you are trading CALL and incur a loss, you are taking PUT in subsequent Martingale levels.
“FOLLOW CANDLE COLOR”: You are following candle color in Martingale levels, i.e if the loss candle is RED, you are taking PUT in subsequent candles.
“OPPOSITE CANDLE COLOR”: You are taking opposite candle color trade, i.e if the loss candle is RED, you are taking CALL in subsequent candle.
Select Specific Trading Session. Please select “USE SPECIFIC SESSION”. Default: TRUE
Put the investment amount per option. Default: 10
Payout ratio. Default: 80%
The strategy is taken from Vdub Binary Options SniperVX v1 (by @vdubus). I have deleted extra parts and kept only the necessary parts.
Result Table
Signal and Win Levels:
Signal and Loss:
Please note that Binary options trading is very risky. You must be aware of the risk and be willing to accept them in order to invest in binary options. Only invest what you can afford to lose. The past performance of any trading system, strategy, or methodology is not necessarily indicative of future results.

FalconRed 5 EMA Indicator (Powerofstocks)Improved version:
This indicator is based on Subhashish Pani's "Power of Stocks" 5 EMA Strategy, which aims to identify potential buying and selling opportunities in the market. The indicator plots the 5 EMA (Exponential Moving Average) and generates Buy/Sell signals with corresponding Target and Stoploss levels.
Subhashish Pani's 5 EMA Strategy is a straightforward approach. For intraday trading, a 5-minute timeframe is recommended for selling. In this strategy, you can choose to sell futures, sell calls, or buy puts as part of your selling strategy. The goal is to capture market tops by selling at the peak, anticipating a reversal for profitable trades. Although this strategy may result in frequent stop losses, they are typically small, while the minimum target should be at least three times the risk taken. By staying aligned with the trend, significant profits can be achieved. Subhashish Pani claims that this strategy has a 60% success rate.
Strategy for Selling (Short Future/Call/Stock or Buy Put):
1. When a candle completely closes above the 5 EMA (with no part of the candle touching the 5 EMA), it is considered an Alert Candle.
2. If the next candle is also entirely above the 5 EMA and does not break the low of the previous Alert Candle, ignore the previous Alert Candle and consider the new candle as the new Alert Candle.
3. Continue shifting the Alert Candle in this manner. However, when the next candle breaks the low of the Alert Candle, take a short trade (e.g., short futures, calls, stocks, or buy puts).
4. Set the stop loss above the high of the Alert Candle, and the minimum target should be 1:3 (at least three times the stop loss).
Strategy for Buying (Buy Future/Call/Stock or Sell Put):
1. When a candle completely closes below the 5 EMA (with no part of the candle touching the 5 EMA), it is considered an Alert Candle.
2. If the next candle is also entirely below the 5 EMA and does not break the high of the previous Alert Candle, ignore the previous Alert Candle and consider the new candle as the new Alert Candle.
3. Continue shifting the Alert Candle in this manner. However, when the next candle breaks the high of the Alert Candle, take a long trade (e.g., buy futures, calls, stocks, or sell puts).
4. Set the stop loss below the low of the Alert Candle, and the minimum target should be 1:3 (at least three times the stop loss).
Buy/Sell with Additional Conditions:
An additional condition is added to the buying/selling strategy:
1. Check if the closing price of the current candle is lower than the closing price of the Alert Candle for selling, or higher than the closing price of the Alert Candle for buying.
- This condition aims to filter out false moves, potentially preventing entering trades based on temporary fluctuations. However, it may cause you to miss out on significant moves, as you will enter trades after the candle closes, rather than at the breakout point.
Note: According to Subhashish Pani, the recommended timeframe for intraday buying is 15 minutes. However, this strategy can also be applied to positional/swing trading. If used on a monthly timeframe, it can be beneficial for long-term investing as well. The rules remain the same for all types of trades and timeframes.
If you need a deeper understanding of this strategy, you can search for "Subhashish Pani's (Power of Stocks) 5 EMA Strategy" on YouTube for further explanations.
Note: This strategy is not limited to intraday trading and can be applied to positional/swing
SMMA Bounce IndicatorThis indicator Looks for continuous retracements from Smoothed Moving Average periods of the user's choosing. This can be helpful in locating reversals and pullbacks with a quick glance. With this indicator, you have plenty of options to cater to your time period of choice as well as the freedom to change to colors that best suit your chart. This script was made in whole by SirvivalFX and utilized the (Built-in Script) "Smoothed Moving Average" with inspirations from rmunoz's Engulfing Candle Indicator. *DISCLAIMER*- This should be used with a plethora of knowledge and tools to work effectively and should not be used as a surefire trading tactic. You may use and alter this script in any form you like! :)
