Waldo Cloud Bollinger Bands
Waldo Cloud Bollinger Bands Indicator Description for TradingView
Title: Waldo Cloud Bollinger Bands
Short Title: Waldo Cloud BB
Overview:
The Waldo Cloud Bollinger Bands indicator is a sophisticated tool designed for traders looking to combine the volatility analysis of Bollinger Bands with the momentum insights of the Relative Strength Index (RSI) and moving average crossovers. This indicator overlays on your chart, providing a visual representation that helps in identifying potential trading opportunities based on price action, momentum, and trend direction.
Concept:
This indicator merges three key technical analysis concepts:
Bollinger Bands: These are used to measure market volatility. The bands consist of a central moving average (basis) with an upper and lower band that are standard deviations away from this average. In this indicator, you can customize the type of moving average used for the basis (SMA, EMA, SMMA, WMA, VWMA), the length of the period, the source price, and the standard deviation multiplier, offering flexibility to adapt to different market conditions.
Relative Strength Index (RSI): The RSI is incorporated to provide insight into the momentum of price movements. Users can adjust the RSI length and overbought/oversold levels and even choose the price source for RSI calculation, allowing for tailored momentum analysis. The RSI values influence the cloud color between the Bollinger Bands, signaling market conditions.
Moving Average Crossovers: Two moving averages with customizable lengths and types are used to identify trend direction through crossovers. A fast MA (default 20 periods) and a slow MA (default 50 periods) are plotted when enabled, helping to signal potential bullish or bearish market conditions when they cross over each other.
Functionality:
Bollinger Bands Calculation: The basis of the Bollinger Bands is calculated using a user-defined moving average type, with a customizable length, source, and standard deviation multiplier. The upper and lower bands are then plotted around this basis.
RSI Calculation: The RSI is computed using a user-specified source, length, and overbought/oversold levels. This RSI value is used to determine the color of the cloud between the Bollinger Bands, which visually represents market sentiment:
Purple when RSI is overbought.
Blue when RSI is oversold.
Green for bullish conditions (when the fast MA crosses above the slow MA, RSI is bullish, and the price is above the slow MA).
Red for bearish conditions (when the fast MA crosses below the slow MA, RSI is bearish, and the price is below the slow MA).
Gray for neutral conditions.
Trend Analysis: The indicator uses two moving averages to help determine the trend direction.
When the fast MA crosses over the slow MA, it suggests a potential change in trend direction, which, combined with RSI conditions, provides a more comprehensive trading signal.
Customization:
Users can select the type of moving average for all calculations through the "Global MA Type" setting, ensuring consistency in how trends and volatility are interpreted.
The Bollinger Bands settings allow for adjustments in length, source, standard deviation, and offset, giving traders control over how volatility is measured.
RSI settings include the ability to change the RSI source, length, and overbought/oversold thresholds, which can be fine-tuned to match trading strategies.
The option to show or hide moving averages provides clarity on the chart, focusing on either the Bollinger Bands or including the MA crossovers for trend analysis.
Usage:
This indicator is ideal for traders who incorporate both volatility and momentum in their trading decisions.
By observing the color changes in the cloud, along with the position of the price relative to the moving averages, traders can gauge potential entry and exit points.
For instance, a green cloud with a price above the slow MA might suggest a strong buying opportunity, while a red cloud with a price below might indicate selling pressure.
Conclusion:
The Waldo Cloud Bollinger Bands indicator offers a unique blend of volatility, momentum, and trend analysis, providing traders with a multi-faceted view of market conditions. Its customization options make it adaptable to various trading styles and market environments, making it a valuable addition to any trader's toolkit on Trading View.
Oscillators

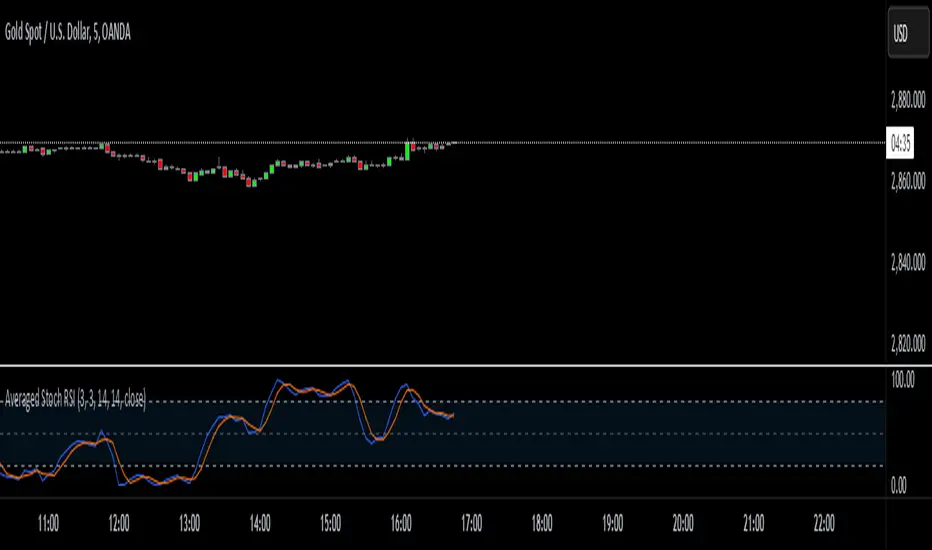
Averaged Stochastic RSI by TenozenSimplicity beats everything! Averaged Stochastic RSi is calculated using the 2 points of stochastic of the RSI, where the difference is by 2 (larger), and averaged out the stochastic's values. In result it is less noisy and more responsive towards the market's momentum.
I hope you guys find this indicator useful! So far this is the best indicator I ever had! And I also learned that simplicity is better than complex blurry/abstract problems. Ciao!
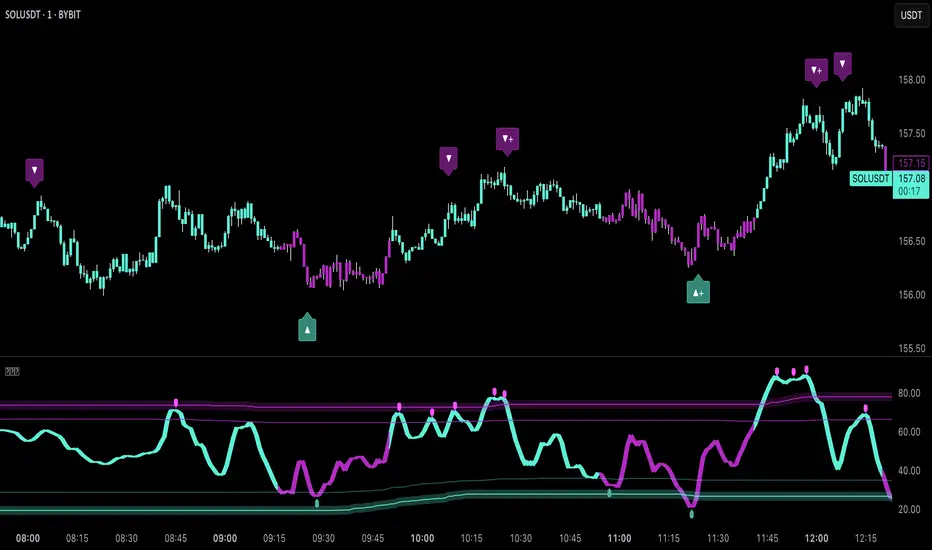
Uptrick: Quantum RSI +Uptrick: Quantum RSI+ (QR-Pro) is a technical analysis indicator designed to enhance the functionality of the traditional Relative Strength Index (RSI). It incorporates adaptive volatility adjustments, threshold calculations, divergence detection, and visualization enhancements. This script is a vendor-protected indicator, and its source code is not publicly available. It adheres to TradingView’s vendor requirements while providing traders with a refined approach to analyzing market momentum, strength, and trend conditions.
Purpose:
The purpose of Quantum RSI+ (QR-Pro) is to adapt the RSI methodology dynamically based on changing market conditions. By utilizing smoothing techniques, adjustable length calculations, and divergence detection, it provides a structured way to evaluate trend strength and potential reversals. The indicator aims to offer a balanced response to varying levels of market volatility, helping traders minimize lag while reducing signal noise. Unlike standard RSI indicators that rely on fixed period settings, this script adapts to real-time market conditions, offering enhanced responsiveness and more accurate detection of potential reversal points.
Overview:
Quantum RSI+ (QR-Pro) modifies traditional RSI calculations by integrating a state-based adjustment system that alters the RSI length dynamically. This allows the indicator to respond more effectively to different volatility environments. It incorporates multiple analytical tools, such as divergence detection and support/resistance visualization, to assist in identifying momentum shifts and trend strength. In addition, the script offers an advanced metrics table that provides deeper insights into market statistics such as entropy, kurtosis, and volatility analysis. These insights are valuable for traders who wish to understand market structure in greater detail and adjust their strategies accordingly.
Originality:
This indicator differentiates itself by combining adaptive RSI length adjustments, divergence detection, and dynamic learning zones. Unlike standard RSI implementations that use fixed calculations, Quantum RSI+ (QR-Pro) adjusts automatically to market volatility, making it more responsive and effective under changing conditions. The advanced metrics table, which includes measures like the Hurst exponent, entropy, kurtosis, and volatility Z-score, further distinguishes the script by offering an additional layer of market intelligence. These metrics help traders determine whether a market is trending or mean-reverting, assess randomness, and identify volatility spikes, thereby justifying the script's value compared to freely available alternatives.
Enhanced RSI Framework:
Quantum RSI+ (QR-Pro) introduces a framework that adjusts RSI sensitivity based on volatility. Traditional RSI methods use a fixed calculation period, which can result in signals that either react too slowly or too quickly depending on market behavior. This indicator modifies the RSI length dynamically, shortening it in high-volatility periods to capture rapid shifts while extending it in low-volatility periods to filter out noise. This adaptive approach provides a more balanced assessment of market momentum and helps traders avoid false signals. It is best used in conjunction with other technical analysis tools to validate trade setups and manage risk effectively.
Advanced Adaptive Smoothing:
The script employs a multi-layered smoothing technique to refine RSI readings. Traditional RSI indicators can be affected by market noise, leading to erratic signals. By applying a structured smoothing process, Quantum RSI+ (QR-Pro) helps identify sustained trends while filtering out short-lived fluctuations. This balance between reactivity and stability leads to more reliable momentum assessments, making it easier for traders to discern genuine market movements from transient noise.
Dynamic Market Intelligence:
Instead of relying on static thresholds, Quantum RSI+ (QR-Pro) calculates its levels dynamically based on historical market performance. This approach provides a contextual understanding of market conditions, allowing traders to better anticipate reversals. Additional validation methods further increase the reliability of the signals, making the indicator a practical tool for confirming potential trend changes in real time.
Inputs:
• Line Width – Sets the thickness of the RSI plot line for visual clarity.
• MA Type for Quantum RSI – Allows users to choose the type of moving average (SMA, EMA, WMA, or VWMA) to overlay on the Quantum RSI.
• MA Length – Defines the period used for the selected moving average, providing additional trend filtering.
• Enable Moving Average – Toggles the calculation and plotting of the chosen moving average on the RSI. Bar coloring is then adjusted according to the slope of this MA if enabled.
• Ribbon Help – Enables or disables a moving average ribbon that visually compares two moving averages for enhanced trend clarity. Bar coloring is then adjusted according to the slope of this Ribbon if enabled.
• Ribbon Difference – Adjusts the gap between the fast and slow moving averages used in the ribbon visualization.
• Slope Length – Determines the period for calculating the slope of the moving average, which influences its color representation based on trend direction. A higher value usually can help filter out more noise as it would not be affected by small moves.
• Show Advanced Metrics Table – Toggles the display of a table that presents advanced market metrics.
Features and Usage:
• Adaptive RSI Length – Dynamically adjusts the RSI length based on market volatility. Traders can use this feature to obtain more responsive RSI signals during volatile periods and smoother readings during calmer market conditions.
• Quantum RSI Smoothing – Applies a structured smoothing process to RSI values to reduce noise, helping traders focus on genuine momentum shifts rather than transient fluctuations.
• Holographic Divergence Detection – Detects bullish and bearish divergences by comparing price action with RSI movements. This feature can be used to confirm potential trend reversals when combined with other market data.
• Gradient-Filled Zones – Highlights areas with smooth gradient transitions, making it easier to visualize and anticipate shifts in market sentiment.
• Moving Average of RSI – Overlays different moving averages on the RSI to provide additional trend filtering and confirmation for trading decisions.
• Ribbon Visualization – Displays a dynamic moving average ribbon that compares fast and slow moving averages, offering additional visual context and clarity regarding trend direction and potential momentum shifts.
• Metrics Table – Presents market statistics such as the Hurst exponent, Shannon entropy, kurtosis, skewness, fractal dimension, and volatility Z-score. These metrics offer deeper insights into market structure, assisting traders in understanding whether markets are trending or reverting and identifying periods of uncertainty. Here's what the metrics tell you:
• Hurst Exponent – Provides insight into whether market behavior tends to follow a trending or mean-reverting pattern.
• Shannon Entropy – Gauges the randomness or unpredictability in price movements, reflecting market stability.
• Kurtosis – Highlights the likelihood of extreme price swings, indicating the presence of heavy tails in the return distribution.
• Skewness – Indicates the asymmetry in the distribution of returns, pointing to potential biases in price direction.
• Fractal Dimension – Assesses the complexity of market patterns, revealing the intricacy of price action.
• Volatility Z-Score – Standardizes current volatility relative to historical levels, helping to identify periods of unusual market activity.
• UPT State – Provides a qualitative evaluation of the overall market environment, categorizing conditions as favorable, cautionary, or neutral for trading.
• Alerts – Built-in alert conditions notify users when bullish or bearish divergences occur, enabling traders to automate signal detection and respond promptly to market changes.
Summary:
Quantum RSI+ (QR-Pro) is a structured RSI-based momentum analysis tool that adapts to market conditions dynamically. By incorporating volatility-based adjustments, adaptive threshold calculations, and divergence detection, it delivers enhanced trend recognition and trade signals. Its advanced visualization techniques and moving average options offer a clear representation of market dynamics, while the advanced metrics table provides additional insights into market structure and behavior. Traders can use this indicator to identify overbought and oversold conditions dynamically, filter market noise through adaptive smoothing, and confirm trade signals using divergence detection. It is best applied as part of a comprehensive technical analysis strategy to validate trends and potential reversals in real-world trading scenarios.
Disclaimer:
This indicator is a technical analysis tool and should not be considered financial advice. Trading involves significant risk, and past performance does not guarantee future results. Users should exercise discretion and employ proper risk management when utilizing this tool in live trading.
RVMM IndicatorRVMM Indicator
RVMM Indicator combines four indicators: RSI, VWAP, MFI, and Momentum to provide comprehensive technical analysis. This indicator helps traders identify potential market conditions based on the interaction of these indicators.
Components of the RVMM Indicator
1. RSI (Relative Strength Index)
RSI is a momentum indicator that measures the speed and change of price movements. RSI oscillates between 0 and 100 and is used to identify overbought and oversold conditions in the market.
Buy Level: Set at 30. When RSI falls below 30, the market is considered oversold, which may suggest a potential upward trend reversal.
Sell Level: Set at 70. When RSI rises above 70, the market is considered overbought, which may suggest a potential downward trend reversal.
2. VWAP (Volume Weighted Average Price)
VWAP is an indicator that combines price and volume to calculate the average price weighted by volume. VWAP is used to identify support and resistance areas and assess the strength of price movements.
Interpretation: If the price is above the VWAP line, the market is likely in an uptrend. If the price is below the VWAP line, the market is in a downtrend.
3. MFI (Money Flow Index)
MFI is a momentum indicator that considers both price and volume. MFI oscillates between 0 and 100 and is used to identify overbought and oversold conditions in the market.
Oversold Level: Set at 20. When MFI falls below 20, the market is considered oversold.
Overbought Level: Set at 80. When MFI rises above 80, the market is considered overbought.
4. Momentum
Momentum is an indicator that measures the speed of price changes. This indicator is used to identify the strength of a trend.
Interpretation: High momentum values indicate a strong uptrend, while low momentum values indicate a strong downtrend.
How to Use the RVMM Indicator
Interpreting Market Conditions:
RSI : Check RSI values below 30 to identify oversold conditions, and above 70 to identify overbought conditions.
VWAP : Observe whether the price is above or below the VWAP line to determine if the market is in an uptrend or downtrend.
MFI : Check if MFI is below 20 to identify oversold conditions, and above 80 to identify overbought conditions.
Momentum : Analyze momentum values to gauge the strength of the current trend.
Confirming Market Conditions:
Use VWAP, MFI, and Momentum to confirm market conditions identified by RSI.
If the price is above the VWAP line, and MFI and Momentum indicate the strength of the uptrend, the market may be in a bullish phase.
If the price is below the VWAP line, and MFI and Momentum indicate the strength of the downtrend, the market may be in a bearish phase.
Risk Management:
Set stop-loss and take-profit levels based on technical analysis and your trading preferences.
Monitor the market and adjust stop-loss and take-profit levels as market conditions change.
Example of Application
Here is an example of how to use the RVMM Indicator in practice:
Bullish Phase: When the price is above the VWAP line, RSI is below 30, and MFI and Momentum indicate the strength of the uptrend, the market is likely in a bullish phase.
Bearish Phase: When the price is below the VWAP line, RSI is above 70, and MFI and Momentum indicate the strength of the downtrend, the market is likely in a bearish phase.

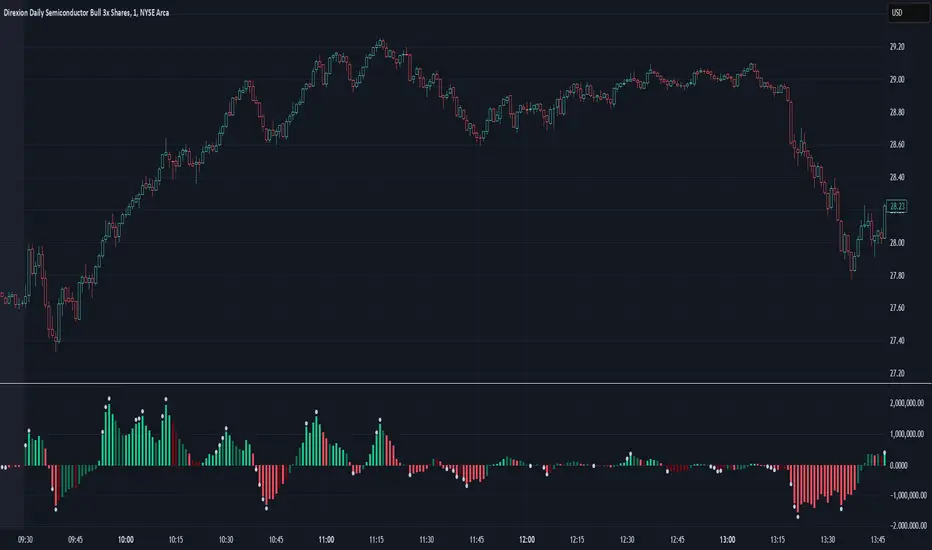
Adaptive On Balance Volume with Trend█ Introduction
The Adaptive On Balance Volume (AOBV) indicator enhances the traditional On Balance Volume (OBV) by introducing adaptability, volatility detection, and trend analysis. It helps traders identify the direction of volume flow, assess volume momentum, and spot potential reversals in the market.
Detecting market tops and bottoms is crucial for making informed trading decisions. The AOBV indicator offers a method for identifying these points by using an adaptive volatility detection function that highlights potential volume peaks or climaxes, suggesting when a price top or bottom may be forming.
█ Understanding the AOBV
Note: Details on how calculations are conducted can be found at the end of this script description.
1. The Basics of the AOBV Function:
• Adaptive Momentum Calculation: Instead of using a fixed momentum formula, the AOBV uses the original formula for basic momentum and enhances it based on relative strength and applies an adaptive smoothing function.
• Dynamic Smoothing:
• Strong Momentum: When the AOBV detects significant changes (strong momentum), it reduces smoothing. This makes the indicator more responsive to major market movements.
• Weak Momentum: When momentum is weak (small changes), it increases smoothing to filter out market noise.
This adaptability allows the AOBV to more accurately reflect volume momentum, responding promptly during significant market moves and remaining stable during quieter periods.
To determine the trend direction (bullish or bearish), the indicator calculates a signal curve and displays the difference as bars:
• Bar Above the Middle Line: Indicates a bullish trend.
• Bar Below the Middle Line: Indicates a bearish trend.
2. Volatility Function:
The volatility function measures how much the AOBV deviates from its average by comparing it to its smoothed version. It calculates the exponential standard deviation to estimate volatility.
• Purpose: Identifies when volume momentum is near a climax or when a trend is nearing exhaustion.
• How It Works:
• Compares current volatility to previous bars.
• Computes a percentage indicating how often the current volatility is higher than past values.
• If this percentage exceeds a defined threshold, it signals a significant volatility event by plotting a dot above or below the bar.
This pattern typically manifests itself during strong runs on price followed by a period of consolidation. Thus, estimating volatility would be an acceptable measure of when a market is reaching or nearing an implied top or bottom.
3. The Trend Function:
The trend function combines several common indicators to gauge buildup toward a reversal or a continuation of a trend when the AOBV changes direction.
• Components:
• AOBV Strength Percentage: Calculates the percentage change in the AOBV to gauge its strength and direction.
• Supertrend Indicator: Acts as the main driver for trend buildup.
• Vertical Horizontal Filter (VHF): Measures market consolidation, adjusting the trend strength accordingly.
• Adaptive RSI: Further refines the trend strength based on volume momentum.
• Trend Ranking:
• Assigns a trend rank to the AOBV that reflects both market direction and momentum.
• Colors are used to represent different trend strengths: Strong Bullish, Bullish, Strong Bearish, and Bearish.
█ How to Use the AOBV
• Above the Middle Line: Suggests a bullish trend.
• Below the Middle Line: Suggests a bearish trend
• The Volatility dots:
• Indicate strong momentum relative to previous bars.
• Signal that the trend may be nearing a climax or exhaustion.
• Can imply a potential market top or bottom.
• Consolidation can be detected by visually comparing current bars to previous ones. This should be obvious since, and as described, the AOBV bars represent volume momentum.
• The trend function is used to gauge the likelihood of a reversal or a continuation of a trend; trend is represented with several colors: strong bullish trend, bullish trend, strong bearish trend, and finally simply a bearish trend.
It is important to understand that this trend function is not the typical trend function found on other technical indicators. It must be viewed within the context of the AOBV momentum. For example, if AOBV is exerting a bullish trend (bars above middle line), then a bearish trend with no major change in momentum and no volatility indication could mean a false reversal. Conversely, a large charge in AOBV could be a strong indication of a market reversal.
█ Key Features
• Two Display Modes: Curve and Bars:
The Adaptive OBV can be viewed in two different display modes: Curve and Bars Mode. "Curve Mode" offers the classic OBV representation (but as AOBV) with trend, while "Bars Mode" incorporates volatility detection and trend, making it the recommended mode.
• Volatility Function:
• Dots appear above or below the volume bars when significant volatility events are detected.
• The sensitivity can be adjusted by changing the percentage threshold.
• Trend Analysis:
• Helps gauge the likelihood of a trend continuation or reversal.
• Uses color-coded trend ranks for easy interpretation.
• Flexible Lookback Period:
Lookback periods for the main AOBV, its signal line, trend function, and volatility function can be customized.
• Recommendations:
• Match the main lookback period with the volatility period: Ensures consistency in momentum and volatility measurements.
• Match the trend lookback period with the signal AOBV lookback period: Aligns trend analysis with the underlying momentum signals.
Below is a sample demonstrating the utility on a 1- minute chart.
█ Calculation Details:
• AOBV Calculations
The AOBV differs the traditional OBV by focusing on the differences in OBV values rather than absolute price movements. Initially, it calculates the standard OBV by accumulating volume based on whether the closing price is higher or lower than the previous close. Next, it computes the difference between the current OBV and the previous OBV to measure changes in volume momentum. It calculates the average net change and average total change of these OBV differences over a specified period using a selected averaging method (e.g., EMA, SMA). By dividing the average net change by the average total change, it obtains a change ratio that reflects the strength and direction of volume momentum.
This change ratio is then scaled to an RSI-like value between 0 and 100, which is used to derive an adaptive smoothing factor (alpha). The alpha adjusts dynamically—when the change ratio indicates strong momentum, alpha increases, making the indicator more responsive to recent changes; when momentum is weak, alpha decreases, increasing smoothing to filter out noise.
The adaptive OBV is calculated by applying this alpha to combine the current OBV and the previous adaptive OBV value. This adaptive smoothing allows the indicator to adjust its sensitivity based on market conditions, becoming more responsive during strong momentum and more stable during weak momentum.
A smoothed OBV signal line is also computed using weighted moving averages for comparison. By analyzing the difference between the adaptive OBV and this smoothed signal line, the indicator identifies bullish or bearish trends. Positive differences suggest bullish momentum (bars above the middle line), while negative differences indicate bearish momentum (bars below the middle line).
• Volatility Calculations
The volatility function in the AOBV indicator identifies significant changes in volume momentum by estimating the variability of recent momentum shifts. It begins by calculating the difference between the AOBV and its smoothed signal line, capturing the current change in volume momentum. To assess volatility, the function employs exponential smoothing to compute adaptive averages of both the volume and the squared volume over a specified lookback period. By combining these averages, it estimates the current standard deviation of the volume momentum changes, effectively measuring how much the momentum deviates from its average level.
This estimated volatility is then compared to historical volatility values over the lookback period to determine how frequently the current volatility exceeds past levels. If the proportion of times the current volatility is higher than previous values and it surpasses a user-defined threshold, it signals a significant volatility event, indicating a potential volume climax
• Trend Calculations
As outlined earlier in description, the trend function is composed of several components:
The Supertrend indicator calculates dynamic support and resistance levels based on price movements and volatility using the Average True Range. It assesses whether the closing price is above or below these levels to determine the primary trend direction. If the price is above the Supertrend line: The market is considered to be in an uptrend. If the price is below the Supertrend line: The market is considered to be in a downtrend.
The Vertical Horizontal Filter measures the strength of the trend by comparing the price range over a period to the sum of absolute price changes. It does this by comparing the difference between the highest and lowest prices over a given period (the "vertical" movement) to the sum of the absolute differences between consecutive prices (the "horizontal" movement). A higher VHF value indicates a stronger, more directional trend, while a lower value suggests that the market is moving sideways without a clear trend.. If the VHF detects consolidation, it downgrades the trend strength indicated by the Supertrend. This prevents the trend function from overemphasizing the Supertrend's signals when the market lacks clear direction.
The Adaptive RSI Analyzes recent changes in the AOBV to identify whether volume momentum is strengthening or weakening (based on the volume percent change) correlating price movement with volume momentum. It only upgrades or downgrades on a bar by bar basis if price movement is correlating with percent change. This acts as a corrective measure against the VHF since quiet periods (consolidation) can occur between strong moves. The alpha generated from the adaptive function is the same as the one generated with the AOBV calculations.
█ Disclaimer
This script is provided for educational and informational purposes only and should not be considered financial advice. Trading financial instruments carries a high level of risk and may not be suitable for all investors. Before using this script, please consult with a qualified financial advisor to ensure it aligns with your individual circumstances. The author does not guarantee the accuracy or completeness of the script and is not responsible for any losses or damages that may occur from its use. Use this script at your own risk.
Multi Stochastic AlertHello Everyone,
I have created a Multi Stochastic Alert based on Scalping Strategy
The Strategy uses below 4 Stochastic indicator:
1. Stochastic (9,3)
2. Stochastic (14,3)
3. Stochastic (40,4)
4. Stochastic (60,10)
Trade entry become active when all of these goes below 20 or above 80, In this indicator you don't need to use all 4, this will show red and green background whenever all of them goes below 20 or above 80.
As shown in picture below, it works better when script is making a channel, Our indicator shows green or red signal, we wait for RSI Divergence and we enter. We book when blue line (9,3) goes above 80, as shown by arrow, and trail rest at breakeven or your own trailing method
Same Situation shown for Short side. We book 50% when Blue line (9,3) Goes below 20 and trail rest at breakeven or your own trailing method
Happy trading, Let me know if any improvements required.

GTA MARKET SENTIMENTGTA Market Sentiment Indicator – Multi-Timeframe Momentum Analysis
Technical Overview
The GTA Market Sentiment indicator is a multi-timeframe momentum analysis tool that calculates trend strength and directional bias by aggregating data from higher timeframes. It applies a timeframe multiplier to derive price data from three progressively larger timeframes, providing a broader perspective on market conditions.
Key Components:
Multi-Timeframe Data Aggregation:
Uses a timeframe multiplier to fetch price data from three higher timeframes.
Computes an averaged price input to smoothen noise and enhance trend clarity.
Exponential Moving Averages (EMAs):
Two EMAs (fast and slow) are calculated on the multi-timeframe aggregated price.
A signal line is derived using an additional EMA to track momentum shifts.
Histogram Representation:
Displays the difference between the moving averages as a histogram.
Implements a gradient color fill to visually indicate trend shifts.
Histogram color intensity adapts dynamically to signal strength variations.
Slope Calculation:
Computes the slope of the aggregated momentum data to assess trend strength.
Helps detect acceleration or deceleration in trend movement.
Zero Line & Signal Levels:
Zero line acts as a baseline for trend bias determination.
Additional signal levels provide reference points for potential trend shifts.
Customization & Parameters:
Time Frame Multiplier: Adjustable multiplier for selecting higher timeframes.
Fast, Slow, and Signal Lengths: User-defined parameters to modify responsiveness.
Moving Average Display Toggle: Option to enable or disable visualization of EMAs.
Usage Considerations:
Designed for multi-timeframe confirmation and momentum-based trend assessment.
Suitable for analyzing trend consistency across different time horizons.
Can be combined with other technical tools for deeper market context.
This indicator provides a structured approach to momentum analysis by leveraging multiple timeframes, smoothing out short-term noise, and offering a clearer visualization of trend dynamics.

MOKI V1The "MOKI V1" script is a trading strategy on the TradingView platform that uses a combination of two key indicators to identify buy and sell signals:
EMA200 (Exponential Moving Average 200): Used to determine the overall market trend. This line helps ensure that trades are made in the direction of the primary market trend.
RSI (Relative Strength Index): Used to measure the strength or weakness of a trend. In this strategy, a reading above 50 for the RSI indicates stronger buy signals.
Engulfing Pattern: This candlestick pattern occurs when a green (bullish) candle completely engulfs the previous red (bearish) candle. It is used as a buy signal when combined with the other indicators.

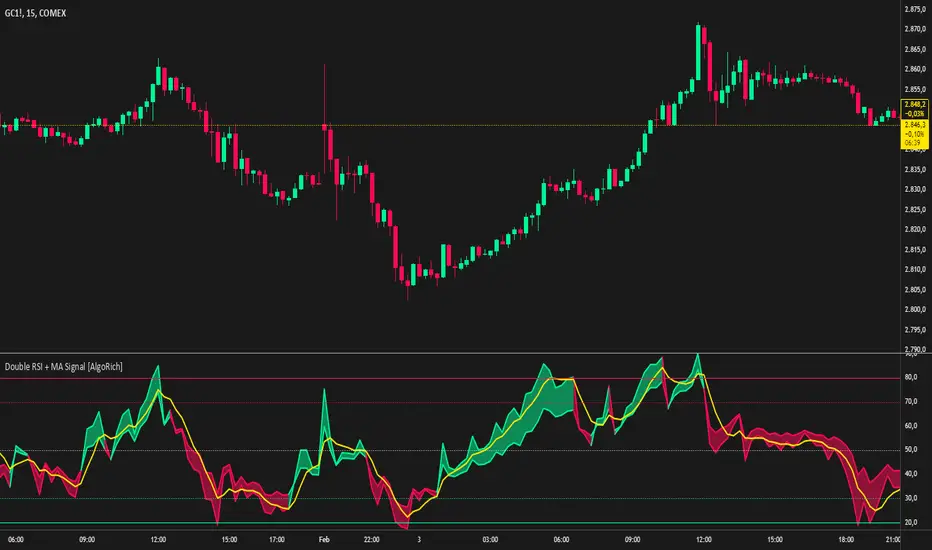
Double RSI + MA Signal [AlgoRich]Objective:
This indicator combines two RSI (Relative Strength Index) calculations with moving averages applied to each. It generates visual signals to help identify overbought, oversold conditions, and potential trend reversals.
Functions and Key Features:
Dual Customizable RSI:
Two RSIs are calculated using different periods (for example, one with 7 periods and another with 14 periods).
This allows you to compare two perspectives on price strength over different timeframes.
Selectable Moving Averages for the RSI:
Each RSI can be smoothed using a moving average, with the type being selectable:
EMA (Exponential Moving Average)
SMA (Simple Moving Average)
WMA (Weighted Moving Average)
DEMA (Double Exponential Moving Average), which is calculated in a custom way for a faster response.
You can also independently set the length (period) of these moving averages for each RSI.
Display of Key Levels:
Horizontal lines are drawn at important levels (80, 70, 50, 30, and 20).
These levels help identify overbought conditions (above 70 or 80) and oversold conditions (below 30 or 20).
Dynamic Colors and Fill Between the RSIs:
The two RSIs are plotted with dynamic colors that change based on their relationship:
For example, if the shorter-period RSI is above the longer-period RSI, a color (such as green) is used to indicate strength; otherwise, another color (such as red) is applied.
Additionally, a fill is drawn between the two RSIs that changes tone according to which RSI is dominant, making it easier to visualize divergences or convergences between them.
Signals Through Moving Averages Applied to the RSI:
The moving averages applied to each RSI act as an additional reference line, helping to detect when the RSI is accelerating or stabilizing.
These lines are displayed on the chart in contrasting colors to make them easy to identify.
Benefits of Using This Indicator:
Early Trend Reversal Detection:
Combining two RSIs with different periods and their moving averages can help identify divergences and early changes in price strength.
Clear Visual Presentation:
The dynamic colors and fill between the RSIs provide a clear visual representation of which side (bullish or bearish) is dominating at any given time.
Flexibility and Customization:
The adjustable parameters allow you to tailor the indicator to different assets and timeframes, according to your trading preferences.
RSI XTR with selective candle color by Edwin KThis tradingView indicator named "RSI XTR with selective candle color", which modifies the candle colors on the chart based on RSI (Relative Strength Index) conditions. Here's how it works:
- rsiPeriod: Defines the RSI calculation period (default = 5).
- rsiOverbought: RSI level considered overbought (default = 70).
- rsiOversold: RSI level considered oversold (default = 30).
- These values can be modified by the user in the settings.
RSI Calculation
- Computes the RSI value using the ta.rsi() function on the closing price (close).
- The RSI is a momentum indicator that measures the magnitude of recent price changes.
Conditions for Candle Coloring
- when the RSI is above the overbought level.
- when the RSI is below the oversold level.
How It Works in Practice
- When the RSI is above 70 (overbought) → Candles turn red.
- When the RSI is below 30 (oversold) → Candles turn green.
- If the RSI is between 30 and 70, the candle keeps its default color.
This helps traders quickly spot potential reversal zones based on RSI momentum.

Cypto Oscillator with Sortino-like VolatilityEnhanced Inverted Ultimate Oscillator with Sortino-like Volatility
This indicator combines the power of the Ultimate Oscillator with a unique Sortino-like volatility calculation to provide a comprehensive view of market dynamics. It's designed to help traders identify potential turning points and assess the risk associated with price movements.
**Core Components:**
* **Ultimate Oscillator (UO):** The UO is a momentum indicator that incorporates short, medium, and long-term price action to identify overbought and oversold conditions. This indicator inverts and normalizes the UO to a 0-10 scale, providing a clear view of momentum shifts.
* **Sortino-like Volatility:** Instead of a standard deviation, this indicator uses a downside deviation calculation. This focuses specifically on *negative* price movements, offering a more relevant measure of risk for most traders. By not penalizing upside volatility, it avoids giving false signals during strong bull runs. The downside deviation is scaled as a percentage of the closing price for cross-asset comparability.
* **Volatility Signal:** The inverted UO is multiplied by the downside deviation to create a combined volatility signal. This signal reflects both momentum and downside risk, providing a more nuanced market perspective.
**Key Features and Uses:**
* **Identifying Potential Turning Points:** Divergences between the UO and price action can signal potential trend reversals. Look for the UO to make higher lows while price makes lower lows (bullish divergence) or the UO to make lower highs while price makes higher highs (bearish divergence).
* **Assessing Downside Risk:** The Sortino-like volatility component helps traders gauge the potential for downside price swings. Higher volatility suggests greater risk.
* **Dynamic Volatility Thresholds:** The indicator includes adjustable upper and lower volatility thresholds, based on a moving average of the volatility signal. These thresholds can be used to identify periods of unusually high or low volatility.
* **Customizable Lookback Periods:** Traders can adjust the lookback periods for the UO and the standard deviation calculation to fine-tune the indicator to their specific trading style and market conditions.
* **Visualizations:** The indicator provides several visual aids, including:
* A histogram of the volatility signal, colored dynamically based on its relationship to the moving average of volatility. Red indicates volatility above the upper bound, orange between the bounds and green below the lower bound.
* A line plot of the volatility signal.
* An optional moving average of the volatility signal.
* Optional upper and lower volatility threshold lines with a filled range for visual clarity.
* **Alerts:** The indicator includes alert conditions for when the volatility signal crosses above the upper threshold (high volatility) or below the lower threshold (low volatility).
**How to Use:**
1. **Inputs:** Adjust the input parameters to optimize the indicator for your chosen asset and timeframe.
2. **Divergences:** Look for divergences between the UO and price to identify potential trend reversals.
3. **Volatility:** Use the volatility signal and thresholds to assess downside risk.
4. **Alerts:** Enable alerts to be notified of high or low volatility events.
**Disclaimer:** This indicator is for informational purposes only and should not be considered financial advice. Always conduct your own thorough analysis before making any trading decisions.
Key improvements in this description:
Clear and concise language: Easy for traders to understand.
Focus on benefits: Highlights how the indicator can help traders.
Detailed explanation of features: Covers all the important aspects.
How-to-use section: Provides practical guidance.
Disclaimer: Includes a necessary disclaimer.
Emphasis on the Sortino-like approach: This is a unique selling point of your indicator.
Well-structured and formatted: Easy to read and digest.
This description should be a great starting point for sharing your indicator with the TradingView community. You can further customize it by adding screenshots of the indicator in action or linking to a chart where it's being used. Remember to respond to comments and questions from other users to build engagement and improve your indicator over time.

Alpha Beta Gamma OscillatorThis momentum oscillator calculates three key ratios to analyze price position within a dynamic range:
1. **Alpha (Blue Line)**
`Alpha = (Current Close - Lowest Close) / Lookback Period`
Measures the absolute price elevation above the recent low, normalized by time. Represents raw upward momentum.
2. **Beta (Red/Blue Line)**
`Beta = (Highest Close - Lowest Close) / Lookback Period`
Calculates the normalized price range volatility over the period. Acts as a denominator for relative positioning.
3. **Gamma (Green/Red Line)**
`Gamma = Alpha / Beta`
Creates a 0-1 bounded oscillator showing relative position within the recent price range:
- 0 = At period's lowest close
- 1 = At period's highest close
- 0.5 = Midpoint of range
**Key Features:**
- Dynamic horizontal levels (default 15/85) for overbought/oversold zones
- Color-coded momentum direction:
- Beta turns red when expanding volatility
- Gamma turns green when strengthening momentum
- Candle visualization reinforces gamma's directional bias
- All calculations adapt automatically to the user-defined lookback period
**Interpretation Guide:**
- Gamma > 0.15 suggests overbought conditions
- Gamma < 0.85 indicates oversold territory
- Converging Alpha/Beta signals range contraction
- Gamma candles + line color alignment confirms trend strength
*Usage: Best applied to identify mean-reversion opportunities and confirm breakout/breakdown scenarios in ranging markets.*
---
This description maintains technical accuracy while being accessible to traders, with clear attribution to najoomi ji as the creator.

Overextension Oscillator [by DanielM]The Overextension Oscillator is an indicator that detects when a market move has extended significantly beyond its typical range, signaling potential areas for a correction or reversal. Unlike traditional oscillators that rely on fixed overbought/oversold levels, this tool dynamically adjusts its thresholds based on historical swing high and swing low movements.
By analyzing all swing points on the chart, the indicator determines the expected range of price movements and identifies when the price extends beyond normal levels. Since every asset has different price behavior and volatility, swing lengths may vary from asset to asset, ensuring that overextension is measured relative to each market's historical price behavior.
How It Works
1️⃣ Swing Detection & Data Collection
The indicator scans all available swing highs and swing lows on the chart to gather a complete dataset of past price fluctuations.
It records the percentage differences between swings to determine how much price typically moves in a given market.
2️⃣ Overextension Calculation
Using the stored swing data, the indicator calculates:
Average Swing Difference – Measures the average percentage difference between swings.
Average Move Percentage – Determines the typical magnitude of price moves within a trend cycle.
These values are used to create dynamic overextension thresholds that adjust based on historical data.
3️⃣ Price Distance & Overextension Measurement
The indicator calculates the distance between the current price and the closest historical swing point. If this distance exceeds the predefined threshold based on past swings, the move is considered overextended. The greater the deviation, the higher the probability of a pullback or short-term reversal.
4️⃣ Buy/Sell Signal Generation
A Buy signal is generated when the price has dropped below an overextended threshold relative to a past swing low.
A Sell signal is generated when the price has risen beyond an overextended threshold relative to a past swing high.
These signals indicate that the price has reached a level where it historically tends to slow down or reverse.

Macro-Sentiment Index Model (MSIM)Macro-Sentiment Index Model (MSIM) is a comprehensive trading strategy developed to analyze and interpret the broader macroeconomic and market sentiment. The strategy integrates various quantitative signals, including market volatility, trading volume, market breadth, and economic indicators, to assess the prevailing mood in the financial markets. This sentiment analysis is then used to guide trading decisions, helping identify optimal entry and exit points based on underlying market conditions. The model is specifically designed to capture the shifts in investor sentiment, which have been shown to significantly influence market behavior (Fleming et al., 2001).
The MSIM utilizes a multi-faceted approach to measure sentiment. Drawing from the theory that macroeconomic variables can influence financial markets (Stock & Watson, 2002), the strategy incorporates market volatility (VIX), volume measures, and long-term market trends. These indicators help form a robust view of the market’s risk appetite and potential for price movement. For instance, high volatility often signals increased market uncertainty (Bollerslev, 1986), while volume-based indicators provide insights into investor conviction (Chen, 1991).
Additionally, the model incorporates macroeconomic proxies like GDP growth, interest rates, and unemployment data, leveraging the findings of macroeconomic studies that indicate a direct correlation between these factors and market performance (Hamilton, 1994). By normalizing these economic indicators, the model provides a standardized sentiment score that reflects the aggregated impact of these factors on the market’s outlook.
The MSIM aims to exploit market inefficiencies by responding to shifts in sentiment before they manifest in price movements. Studies have shown that sentiment indicators, such as the Advance-Decline Line and the Stock-Bond Ratio, can be predictive of future price movements (Neely, 2010). The model integrates these indicators into a single composite sentiment score, which is then filtered through momentum signals to refine entry points. This approach is grounded in behavioral finance theory, which suggests that investor sentiment plays a crucial role in driving asset prices, sometimes beyond the reach of fundamental data alone (Shiller, 2000).
The strategy is designed to identify long opportunities when sentiment is particularly favorable, with a focus on minimizing risk during adverse conditions. By analyzing market trends alongside macroeconomic signals, the MSIM helps traders stay aligned with the prevailing market forces.
References:
• Bollerslev, T. (1986). Generalized autoregressive conditional heteroskedasticity. Journal of Econometrics, 31(3), 307-327.
• Chen, S. S. (1991). The determinants of stock market liquidity. Journal of Financial and Quantitative Analysis, 26(3), 283-305.
• Fleming, M. J., Kirby, C. W., & Ostdiek, B. (2001). The economic value of volatility timing. Journal of Financial and Quantitative Analysis, 36(1), 113-134.
• Hamilton, J. D. (1994). Time series analysis. Princeton University Press.
• Neely, C. J. (2010). The behavior of exchange rates: A survey of recent empirical literature. International Finance Discussion Papers, 981.
• Shiller, R. J. (2000). Irrational Exuberance. Princeton University Press.
• Stock, J. H., & Watson, M. W. (2002). Macroeconomic forecasting using diffusion indexes. Journal of Business & Economic Statistics, 20(2), 147-162.

RSI (Pr)The "RSI (Pr)" indicator enhances the traditional Relative Strength Index (RSI) by incorporating dynamic bands and highlighting extreme market conditions directly on the price chart. This approach offers traders a more intuitive visualization of potential overbought and oversold zones, facilitating timely decision-making.
Key Features:
Dynamic RSI Bands: The indicator calculates upper and lower bands based on user-defined overbought and oversold levels. These bands adjust in real-time, providing a responsive measure of market extremes.
Visual Alerts: Background colors change when the price moves outside the RSI bands, offering immediate visual cues of potential market reversals.
Buy/Sell Signals: The script places "BUY" and "SELL" labels on the chart when the price crosses above or below the RSI bands, assisting traders in identifying potential entry and exit points.
How It Works:
RSI Calculation: The script computes the RSI based on the closing price and a user-defined length (default is 14 periods).
Exponential Moving Averages (EMA): It calculates the EMA of the maximum gains and losses to smooth out the data, enhancing the reliability of the RSI bands.
Upper and Lower Bands: Using the smoothed data, the script determines the upper (resistance) and lower (support) bands, which represent dynamic overbought and oversold levels.
Visual Indicators: The script plots the upper and lower bands, as well as a midline, directly on the price chart. Background colors change when the price exceeds these bands, and "BUY" or "SELL" labels appear at crossover points.
Usage:
Overbought Conditions: When the price crosses above the upper band, it may indicate an overbought condition, suggesting a potential selling opportunity.
Oversold Conditions: When the price crosses below the lower band, it may indicate an oversold condition, suggesting a potential buying opportunity.
Customization:
Users can adjust the following parameters to suit their trading preferences:
RSI Overbought Level: Default is 70.
RSI Oversold Level: Default is 30.
RSI Length: Default is 14 periods.
Disclaimer:
This indicator is designed for educational purposes and should not be construed as financial advice. Trading involves significant risk, and it's essential to conduct thorough research and consider your financial situation before making trading decisions. Past performance is not indicative of future results.
By integrating dynamic RSI bands and clear visual signals directly onto the price chart, this indicator aims to provide traders with actionable insights into market conditions, enhancing the traditional RSI analysis.

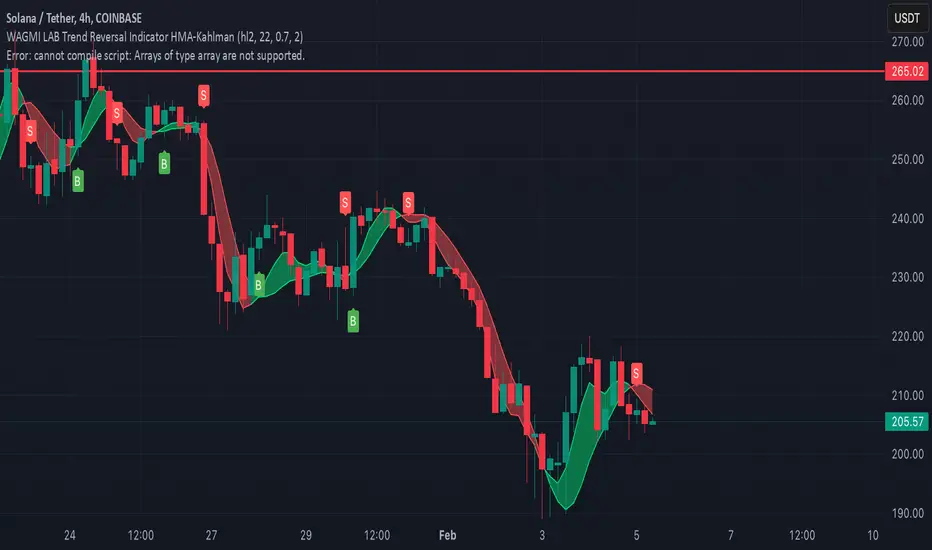
WAGMI LAB Trend Reversal Indicator HMA-Kahlman (m15)WAGMI HMA-Kahlman Trend Reversal Indicator
This indicator combines the Hull Moving Average (HMA) with the Kahlman filter to provide a dynamic trend reversal signal, perfect for volatile assets like Bitcoin. The strategy works particularly well on lower timeframes, making it ideal for intraday trading and fast-moving markets.
Key Features:
Trend Detection: It uses a blend of HMA and Kahlman filters to detect trend reversals, providing more accurate and timely signals.
Volatility Adaptability: Designed with volatile assets like Bitcoin in mind, this indicator adapts to rapid price movements, offering smoother trend detection during high volatility.
Easy Visualization: Buy (B) and Sell (S) signals are clearly marked with labels, helping traders spot trend shifts quickly and accurately.
Trendlines Module: The indicator plots trendlines based on pivot points, highlighting important support and resistance levels. This helps traders understand the market structure and identify potential breakout or breakdown zones.
Customizable: Adjust the HMA and Kahlman parameters to fit different assets or trading styles, making it flexible for various market conditions.
Usage Tips:
Best Timeframes: The indicator performs exceptionally well on lower timeframes (such as 15-minute to 1-hour charts), making it ideal for scalping and short-term trading strategies.
Ideal for Volatile Assets: This strategy is perfect for highly volatile assets like Bitcoin, but can also be applied to other cryptocurrencies and traditional markets with high price fluctuations.
Signal Confirmation: Use the trend signals (green for uptrend, red for downtrend) along with the buy/sell labels to help you confirm potential entries and exits. It's also recommended to combine the signals with other technical tools like volume analysis or RSI for enhanced confirmation.
Trendline Analysis: The plotted trendlines provide additional visual context to identify key market zones, supporting your trading decisions with a clear view of ongoing trends and possible reversal areas.
Risk Management: As with any strategy, always consider proper risk management techniques, such as stop-loss and take-profit levels, to protect against unforeseen market moves.
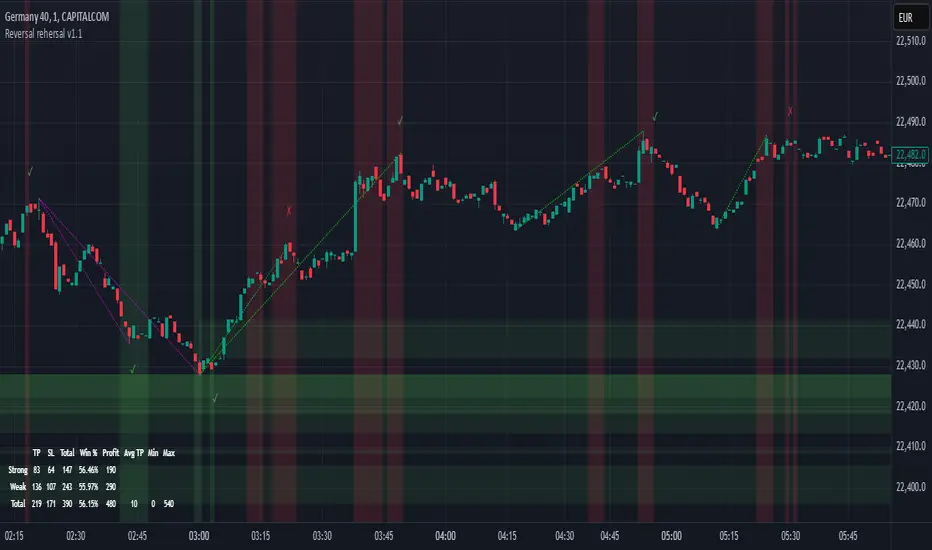
Reversal rehersal v1This indicator was designed to identify potential market reversal zones using a combination of RSI thresholds (shooting range/falling range), candlestick patterns, and Fair Value Gaps (FVGs). By combining all these elements into one indicator, it allow for outputting high probability buy/sell signals for use by scalpers on low timeframes like 1-15 mins, for quick but small profits.
Note: that this has been mainly tested on DE40 index on the 1 min timeframe, and need to be adjusted to whichever timeframe and symbol you intend to use. Refer to the backtester feature for checking if this indicator may work for you.
The indicator use RSI ranges from two timeframes to highlight where momentum is building up. During these areas, it will look for certain candlestick patterns (Sweeps as the primary one) and check for existance of fair value gaps to further enhance the hitrate of the signal.
The logic for FVG detection was based on ©pmk07's work with MTF FVG tiny indicator. Several major changes was implemented though and incorporated into this indicator. Among these are:
Automatically adjustments of FVG boxes when mitigated partially and options to extend/cull boxes for performance and clarity.
Backtesting Table (Experimental):
This indicator also features an optional simplified table to review historical theoretical performance of signals, including win rate, profit/loss, and trade statistics. This does not take commision or slippage into consideration.
Usage Notes:
Setup:
1. Add the indicator to your chart.
2. Decide if you want to use Long or Short (or both).
3. If you're scalping on ie. 1 min time frame, make sure to set FVG's to higher timeframes (ie. 5, 15, 60).
4. Enable the 'Show backtest results' and adjust the 'Signals' og 'Take profit' and 'Stop loss' values until you are satisfied with the results.
Use:
1. Setup an alert based on either of the 'BullishShooting range' or 'BearishFalling range' alerts. This will draw your attention to watch for the possible setups.
2. Verify if there's a significant imbalance prior to the signal before taking the trade. Otherwise this may invalidate the setup.
3. Once a signal is shown on the graph (either Green arrow up for buys/Red arrow down for sells) - you should enter a trade with the given 'Take profit' and 'Stop loss' values.
4. (optional) Setup an alert for either the Strong/Weak signals. Which corresponds to when one of the arrows are printed.
Important: This is the way I use it myself, but use at own risk and remember to combine with other indicators for further confluence. Remember this is no crystal ball and I do not guarantee profitable results. The indicator merely show signals with high probability setups for scalping.
Volume & Trend Confluence OscillatorVolume & Trend Confluence Oscillator (VTCO)
Overview:
The Volume & Trend Confluence Oscillator (VTCO) is a technical analysis tool designed to help traders assess market conditions by integrating volume analysis, momentum, and trend direction into a single oscillator. This indicator provides traders with additional confirmation when evaluating potential trade entries and exits.
Key Features:
Volume Analysis: Calculates a Z-score to detect unusual trading activity.
Momentum Measurement: Evaluates the rate of price change to gauge market velocity.
Trend Confirmation: Utilizes an Exponential Moving Average (EMA) to assess overall market direction.
Signal Filtering: Incorporates minimum movement thresholds and a confirmation period to reduce false signals.
Visual Enhancements: Background shading indicates trend direction, and buy/sell markers highlight key signals.
How It Works:
The VTCO applies a volume multiplier to momentum readings when volume activity significantly deviates from its historical norm. Additionally, it prioritizes momentum moves that align with the prevailing market trend. A smoothing mechanism refines the oscillator’s signal line, ensuring a more stable and actionable output. The indicator generates alerts when key conditions are met, assisting traders in identifying potential trend shifts.
Signal Generation:
Buy Signal: Triggered when the oscillator crosses above zero after an oversold condition, ideally within an uptrend.
Sell Signal: Triggered when the oscillator crosses below zero after an overbought condition, ideally within a downtrend.
Alerts: Configurable alerts notify traders when key market conditions are met.
Usage Considerations:
Works effectively across various timeframes but may provide more reliable signals on higher timeframes.
Best utilized in conjunction with additional technical indicators and risk management strategies.
No indicator guarantees future performance; proper analysis and trade management remain essential.
Disclaimer:
This indicator is provided for educational purposes only and should not be considered financial advice. Trading involves risk, and past performance is not indicative of future results. Always conduct independent analysis before making trading decisions.

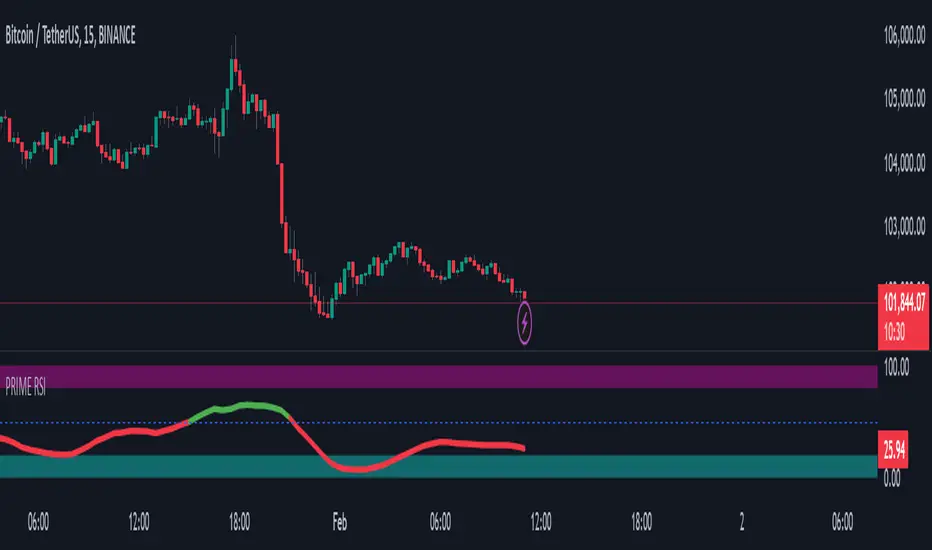
prime rsiThe "PRIME RSI" is a custom variation of the traditional RSI (Relative Strength Index) that offers enhanced flexibility and precision. This indicator provides an adaptable approach for tracking market conditions across different timeframes, making it an ideal tool for both short-term and long-term traders.
Key Features:
Custom Timeframe Selection: Users can select any timeframe to calculate the RSI, providing the ability to analyze data beyond the current chart's timeframe.
Smoothing Methods: Choose between Exponential Moving Average (EMA), Simple Moving Average (SMA), or the Relative Moving Average (RMA) for smoother, more accurate RSI values.
Signal Line: The signal line is smoothed using the selected method and visualized with dynamic coloring to indicate bullish (green) or bearish (red) market conditions.
Overbought/Oversold Levels: Clear levels at 70 (overbought) and 30 (oversold), with fill zones to highlight extreme market conditions, helping traders spot potential reversal points.
Midline at 50: The centerline at 50 serves as a neutral zone, allowing traders to identify shifts in market momentum quickly.
Practical Use:
Trend Confirmation: Use the PRIME RSI to confirm the prevailing market trend, with signals above 50 suggesting bullish momentum and signals below 50 indicating bearish trends.
Overbought/Oversold Conditions: The indicator’s overbought and oversold regions help pinpoint potential market reversals, giving traders valuable entry and exit signals.
Ideal For: All types of traders who want a more flexible and customizable RSI for better trend analysis, especially those working with smaller timeframes or seeking a more responsive momentum indicator.
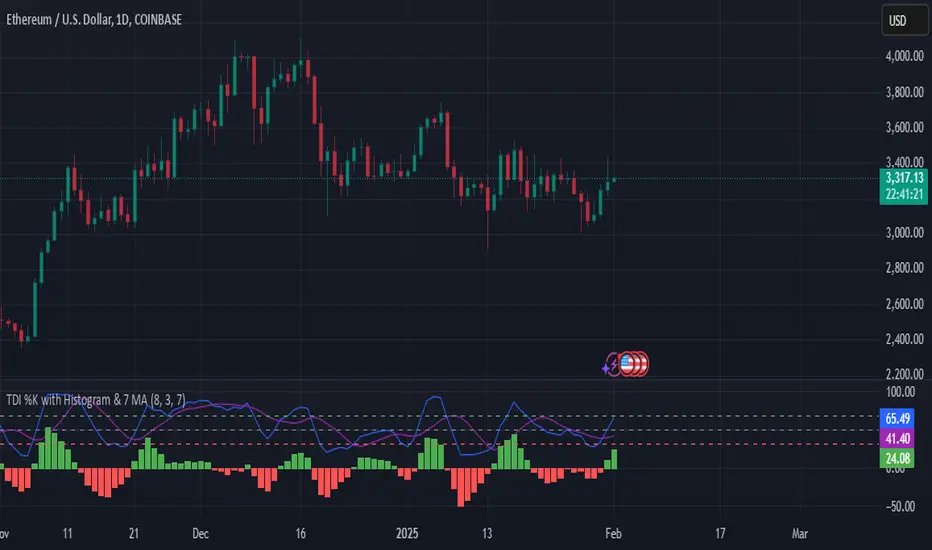
TDI 7 MA and HISTOGRAMTDI %K Histogram with 7 MA
Overview
This indicator enhances trend and momentum analysis using the %K line from the Traders Dynamic Index (TDI), combined with a 7-period moving average (MA) and a histogram.
How It Works
The script calculates %K (similar to Stochastic RSI), representing the relative price position within a given range.
A 7-period Simple Moving Average (SMA) is applied to smooth the %K line, reducing noise and improving trend clarity.
A histogram is plotted based on the difference between %K and the 7-period MA:
Green bars indicate that %K is above the 7-period MA, suggesting bullish momentum.
Red bars indicate that %K is below the 7-period MA, suggesting bearish momentum.
Key Features
-%K Line (Blue) – Reflects short-term momentum shifts.
-7-period MA (Purple) – Helps smooth out fluctuations in %K for better trend identification.
-Histogram (Green/Red Columns) – Highlights momentum shifts visually.
Overbought (68), Midpoint (50), and Oversold (32) Levels – Provides reference points for potential reversals or trend continuation.
How to Use
Bullish Confirmation: When the histogram turns green and %K is above the 7 MA, it suggests upward momentum.
Bearish Confirmation: When the histogram turns red and %K is below the 7 MA, it suggests downward momentum.
Overbought/Oversold Conditions: Use the 68 and 32 levels as potential reversal zones, but always confirm with price action.
Midpoint (50 Level): Acts as a dynamic support/resistance area for momentum shifts.
This indicator is suitable for trend-following and momentum-based trading strategies, whether on lower timeframes for scalping or higher timeframes for swing trading.
Try it out and integrate it with your trading system to refine your entries and exits!
HTC peppermint_07 CCI w signal + s&r RSI
This CCI version enhances the traditional Commodity Channel Index (CCI) by integrating a dynamically calculated Relative Strength Index (RSI) that acts as support and resistance as shown in the screenshot, it can add as a confirmation to the divergence found in the CCI.
Key Features:
Enhanced CCI: The primary plot (black line but customizable) represents the standard CCI, providing insight into price momentum and potential overbought/oversold conditions.
Dynamic RSI Support/Resistance: The upper and lower bands (medium cyan line) are derived from a smoothed RSI, dynamically adjusting to the current market volatility. These bands serve as potential support and resistance levels for the CCI as additional confirmation for the divergence.
Overbought/Oversold Zones: The traditional overbought (+100) and oversold (-100) levels for CCI are marked with horizontal dotted lines.
Benefits:
Improved Entry/Exit Signals: Combining CCI with dynamic RSI support/resistance may offer more precise trading signals compared to using CCI alone.
Dynamic Adaptation: The RSI-based bands adapt to changing market conditions, potentially providing more relevant support and resistance levels.
Divergence Confirmation: dynamic s&r RSI adds confluence to potential trend reversals identified by the CCI.
Potential Usage:
Traders might use this indicator to:
Identify potential overbought/oversold conditions using the CCI and its relationship to the dynamic RSI bands.
Look for breakouts beyond the dynamic support/resistance levels as potential entry points.
Confirm potential trend reversals using RSI divergence (cyan and red label above divergence) signals.
Further Development Considerations:
Customizable Parameters: Allowing users to adjust the CCI length, RSI periods, and smoothing factors would enhance flexibility.
Alert Conditions: Adding alerts for breakouts, overbought/oversold conditions, and divergence signals would improve usability.
Backtesting: Thoroughly backtesting the indicator's performance across different assets and timeframes is essential before using it for live trading.
DISCLAIMER: !!
indicator is a custom technical analysis tool designed for educational and informational purposes only. It should not be construed as financial advice or a recommendation to buy or sell any security. Trading involves substantial risk of loss and may not be suitable for all investors.
Key Points to Consider:
No Guarantee of Profitability: The indicator's past performance is not indicative of future results. No trading strategy can guarantee profits or eliminate the risk of losses. You could lose some or all of your investment.
Use at Your Own Risk: Use of this indicator is solely at your own discretion and risk. You are responsible for your trading decisions. The developers and distributors of this indicator are not liable for any losses incurred as a result of using it.
Not Financial Advice: This indicator does not provide financial advice. Consult with a qualified financial advisor before making any investment decisions.
Backtesting Limitations: Backtested results, if presented, should be viewed with caution. Past performance may not reflect future results due to various factors, including changing market conditions and the limitations of backtesting methodologies.
Indicator Limitations: Technical indicators, including this one, are not perfect. They can generate false signals, and their effectiveness can vary depending on market conditions and the specific parameters used.
Parameter Optimization: Optimizing indicator parameters for past performance can lead to overfitting, which may not translate to future profitability.
No Warranty: The indicator is provided "as is" without any warranty of any kind, either express or implied, including but not limited to warranties of merchantability, fitness for a particular purpose, or non-infringement.
Changes and Updates: The developers may make changes or updates to the indicator without notice.
By using the "HTC peppermint_07 CCI w signal + s&r RSI" indicator, you acknowledge and agree to the terms of this disclaimer. If you do not agree with these terms, do not use the indicator.

KRI For Loop | QuantumResearchIntroducing Rocheur’s KRI For Loop Indicator
The KRI For Loop indicator is an advanced trend-following tool that enhances the traditional Kairi Relative Index (KRI) with a for-loop scoring mechanism. The Kairi Relative Index (KRI) measures the percentage deviation of price from its smoothed moving average, helping traders identify market trends and reversals. By incorporating a for-loop calculation, this version refines trend detection, making it a powerful tool for traders seeking precise entry and exit points.
Understanding the KRI For Loop
The Kairi Relative Index (KRI) is a momentum-based indicator that calculates how far the current price deviates from its moving average, expressed as a percentage. It is widely used to identify overbought and oversold conditions, as well as potential trend reversals.
In this enhanced version, a for-loop scoring mechanism systematically evaluates KRI values within a defined range to determine trend strength:
KRI Calculation: The formula computes the percentage difference between price and an Exponential Moving Average (EMA) of a user-defined length.
For-Loop Scoring: A dynamic scoring system assesses the strength of KRI values across a range (default: -20 to 20), helping to refine market trend analysis.
Threshold-Based Signal Generation:
Long Signal: Triggered when the for-loop score surpasses the long threshold (default: 8).
Short Signal: Triggered when the score falls below the short threshold (default: -5).
Visual Representation
The KRI For Loop indicator provides a clear, color-coded trend analysis:
Green Bars: Indicate bullish conditions when the score surpasses the long threshold, signaling a potential buy opportunity.
Red Bars: Indicate bearish conditions when the score drops below the short threshold, suggesting a sell opportunity.
Gray Bars: Show neutral conditions when the score remains within the defined range.
KRI Bands: Three horizontal bands help visualize market structure:
Upper Band: Represents the bullish threshold.
Middle Band: Zero line for neutral conditions.
Lower Band: Represents the bearish threshold.
Background Fill: A shaded area between the bands highlights trend intensity.
Customization & Parameters
The KRI For Loop indicator offers multiple user-configurable settings for flexibility:
KRI Length: Default set to 27, determines the EMA smoothing period.
Source Price: Selectable input price for calculations (default: close).
Scoring Range (a, b): Defines the range of KRI values assessed in the for-loop (default: -20 to 20).
Long & Short Thresholds:
Long Threshold: Default set to 8, determines when bullish conditions are strong enough for a buy signal.
Short Threshold: Default set to -5, identifies bearish conditions for sell signals.
Color Modes: Choose from eight distinct color schemes to personalize the indicator’s appearance.
Trading Applications
This indicator is highly adaptable and can be applied to various trading strategies, including:
Momentum Trading: Evaluates trend strength based on KRI deviation and for-loop scoring.
Trend Following: Helps traders stay in profitable trends by identifying strong bullish and bearish conditions.
Reversal Detection: The crossing of key KRI thresholds can signal potential market reversals.
Risk Management: Clearly defined entry and exit rules help traders manage risk effectively.
Final Note
Rocheur’s KRI For Loop indicator combines the power of the Kairi Relative Index (KRI) with an advanced for-loop scoring method to deliver a refined market trend analysis. This structured approach offers traders a dynamic and visually intuitive tool for detecting momentum shifts and trend reversals. As always, backtesting and strategic adjustments are essential to fully optimize this indicator for real-world trading.

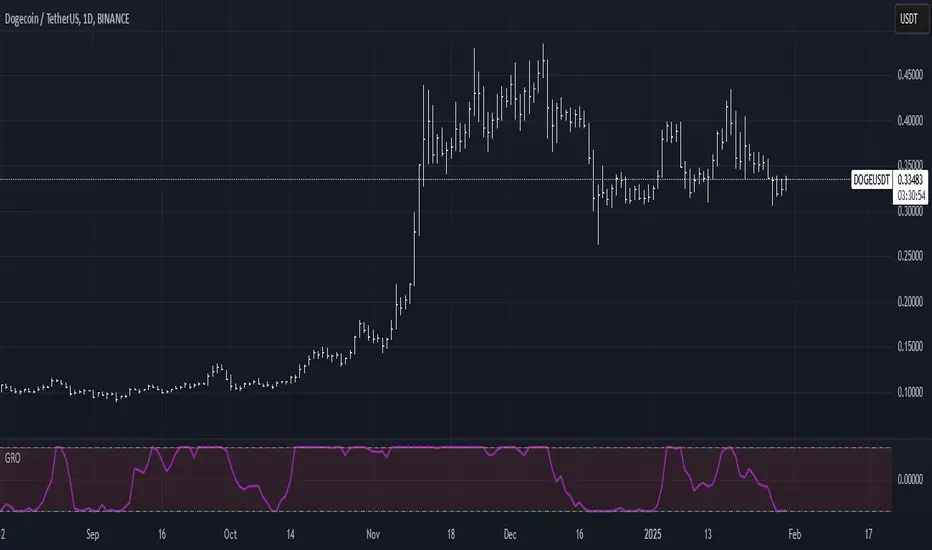
Golden Ratio Oscillator (GRO)Here is a description for your Golden Ratio Oscillator (GRO) indicator:
Golden Ratio Oscillator (GRO) - Overview
The Golden Ratio Oscillator (GRO) is a powerful technical analysis tool that leverages the Golden Ratio (1.618) to smooth price action and generate a normalized momentum-based oscillator. By applying a Golden Ratio-based Exponential Moving Average (EMA), the indicator offers a unique way to analyze price trends, overbought/oversold conditions, and potential reversals.
How It Works
Golden Ratio Smoothing:
The indicator applies a smoothing function based on the Golden Ratio (Φ = 1.618) to the closing price.
This creates a dynamically smoothed price curve, reducing noise while maintaining responsiveness to price changes.
Normalization for Oscillation:
The smoothed price is normalized between -1 and 1, making it a bounded oscillator that fluctuates within a fixed range.
This allows traders to easily interpret overbought and oversold conditions.
Overbought & Oversold Levels:
The oscillator includes two key horizontal reference lines:
Overbought Level (+1.0) – Indicates potential reversal zones from bullish momentum.
Oversold Level (-1.0) – Suggests possible price bottoms and reversal opportunities.
The area between these levels is visually highlighted for better clarity.
How to Use the Indicator
Trend & Momentum Analysis:
When GRO is rising, it signals increasing bullish momentum.
When GRO is falling, it indicates weakening price action or bearish momentum.
Overbought & Oversold Zones:
A reading near +1.0 suggests the market is overbought and could face selling pressure.
A reading near -1.0 indicates an oversold condition, hinting at a potential buying opportunity.
Divergence Detection:
If price makes a new high, but GRO fails to confirm, it signals a potential bearish divergence (weakening trend).
If price makes a new low while GRO holds higher, it suggests bullish divergence (potential reversal).
Customizable Parameters:
Smoothing Length: Defines the responsiveness of the indicator (default: 14).
Overbought/Oversold Levels: Can be adjusted to fine-tune entry and exit points.
Why Use the Golden Ratio Oscillator?
✅ Golden Ratio-Based Smoothing: Reduces noise while maintaining trend sensitivity.
✅ Dynamic Normalization: Adapts to market conditions, making it more intuitive.
✅ Clear Overbought/Oversold Signals: Helps in spotting potential reversals with confidence.
✅ Versatile Trading Applications: Useful for trend confirmation, reversals, and divergence analysis.
Statistical Arbitrage Pairs Trading - Long-Side OnlyThis strategy implements a simplified statistical arbitrage (" stat arb ") approach focused on mean reversion between two correlated instruments. It identifies opportunities where the spread between their normalized price series (Z-scores) deviates significantly from historical norms, then executes long-only trades anticipating reversion to the mean.
Key Mechanics:
1. Spread Calculation: The strategy computes Z-scores for both instruments to normalize price movements, then tracks the spread between these Z-scores.
2. Modified Z-Score: Uses a robust measure combining the median and Median Absolute Deviation (MAD) to reduce outlier sensitivity.
3. Entry Signal: A long position is triggered when the spread’s modified Z-score falls below a user-defined threshold (e.g., -1.0), indicating extreme undervaluation of the main instrument relative to its pair.
4. Exit Signal: The position closes automatically when the spread reverts to its historical mean (Z-score ≥ 0).
Risk management:
Trades are sized as a percentage of equity (default: 10%).
Includes commissions and slippage for realistic backtesting.
