MA Deviation// -----------------------------------------------------------------------------
// MA Deviation Marking & Alert (MA Divergence)
// -----------------------------------------------------------------------------
// Short Title: MA Deviation Radar
// Author: zhipeng luo
// Version: 1.0
// Date: 2025-04-11
// -----------------------------------------------------------------------------
// Overview:
// This indicator identifies and highlights price bars where the closing price
// deviates significantly from its Simple Moving Average (SMA) by a user-defined
// percentage. It visually marks these bars on the chart and provides
// configurable alert conditions for threshold breaches.
//
// How it Works:
// 1. Calculates the Simple Moving Average (SMA) based on the 'MA Period' input.
// 2. Computes the percentage deviation of the closing price from the SMA value.
// Formula: `((Close - SMA) / SMA) * 100`
// 3. Compares the calculated deviation percentage against the positive and
// negative 'Threshold (%)' input values.
// 4. Marks the background of the price bars when a threshold is exceeded:
// - Red Background: Price deviation is greater than the positive threshold.
// - Green Background: Price deviation is less than the negative threshold.
// 5. Includes an optional, non-visible plot of the MA line itself.
// 6. Offers three distinct alert conditions for automation and notifications.
//
// Features:
// - Customizable Simple Moving Average period.
// - Adjustable deviation threshold percentage.
// - Clear visual signals using background colors on the main chart.
// - Built-in Alert Conditions:
// - MA Positive Deviation Alert (Triggers when price > MA + Threshold %)
// - MA Negative Deviation Alert (Triggers when price < MA - Threshold %)
// - MA Deviation Alert - Any (Triggers on either positive or negative breach)
//
// How to Use:
// - Identify Potential Extremes: Useful for spotting potential overbought (large
// positive deviation) or oversold (large negative deviation) conditions
// which might precede price corrections or mean reversion.
// - Gauge Trend Extension: Extreme deviations can sometimes indicate that a
// trend is overextended and might be due for a pause or reversal.
// - Parameter Tuning: Adjust the 'MA Period' and '(Threshold %)' settings to
// suit the specific asset, timeframe, and volatility characteristics you
// are analyzing. Lower thresholds yield more signals; higher thresholds
// focus on more significant deviations.
// - Alerts: Set up alerts via the TradingView alert menu using the provided
// conditions ("MA Positive Deviation Alert", "MA Negative Deviation Alert",
// "MA Deviation Alert - Any") to get notified of potential setups.
//
// Parameters:
// - MA Period (Default: 200): The lookback period for the SMA calculation.
// - (Threshold %) (Default: 7.0): The percentage deviation (positive and
// negative) from the MA required to trigger a background signal and alert.
//
// Alerts & Important Note:
// Three alert conditions corresponding to the signals are available:
// 1. "MA Positive Deviation Alert"
// 2. "MA Negative Deviation Alert"
// 3. "MA Deviation Alert - Any"
//
// ***Please Note:*** The value shown after "( {{plot_0}}%)" or
// "( {{plot_0}}%)" in the default alert message refers to the
// **Moving Average value** (`plot_0`), not the actual deviation percentage.
// The alert *triggers correctly* based on the deviation percentage crossing
// the threshold, but the number displayed by the `{{plot_0}}` placeholder
// in the message is the MA's value at that time due to the script's
// internal plot order.
//
// Disclaimer: This indicator is provided for informational and analytical
// purposes only. It does not constitute financial advice or a recommendation
// to buy or sell any asset. Always conduct your own research and use proper
// risk management. Trading involves significant risk.
// -----------------------------------------------------------------------------
Indicators and strategies

Volume Weighted Average PriceVWAP for VIP Group
JUST IN - Panama deal allows US to deploy troops to canal — The document, signed by top security officials from both countries, allows US military personnel to deploy to Panama-controlled facilities for training, exercises and a range of other activities
JUST IN - Panama deal allows US to deploy troops to canal — The document, signed by top security officials from both countries, allows US military personnel to deploy to Panama-controlled facilities for training, exercises and a range of other activities
JUST IN - Panama deal allows US to deploy troops to canal — The document, signed by top security officials from both countries, allows US military personnel to deploy to Panama-controlled facilities for training, exercises and a range of other activities

Volume Weighted Average PriceVWAP
JUST IN - Panama deal allows US to deploy troops to canal — The document, signed by top security officials from both countries, allows US military personnel to deploy to Panama-controlled facilities for training, exercises and a range of other activities
JUST IN - Panama deal allows US to deploy troops to canal — The document, signed by top security officials from both countries, allows US military personnel to deploy to Panama-controlled facilities for training, exercises and a range of other activities
JUST IN - Panama deal allows US to deploy troops to canal — The document, signed by top security officials from both countries, allows US military personnel to deploy to Panama-controlled facilities for training, exercises and a range of other activities
JUST IN - Panama deal allows US to deploy troops to canal — The document, signed by top security officials from both countries, allows US military personnel to deploy to Panama-controlled facilities for training, exercises and a range of other activities
JUST IN - Panama deal allows US to deploy troops to canal — The document, signed by top security officials from both countries, allows US military personnel to deploy to Panama-controlled facilities for training, exercises and a range of other activities

Volume LevelFirst and only, volume is given a level and identified as bullish or bearish.
Level A means very strong
Level B means strong
Level C means neutral
Level D means weak
Level E means very weak
And there are alerts for volume identification of Level A Bullish and Level A Bearish.
In addition, there is a line feature to identify whales and retailers transactions. For more complete information, read my indicator called "Whales & Retailers Level", a

B.TCharts That Could Help Earnings For Beginners
I share the changes made to the previously used indicators as I refer to them.
I'd like to refer to it and help!

HHVL Filtre Göstergesi by @tanrisevdirIt is derived from a free Meta Stock formula which is written as a Moving Average. I changed the formula as a filter to increase correct signals for buy and sell strategies.

Leavitt Convolution ProbabilityTechnical Analysis of Markets with Leavitt Market Projections and Associated Convolution Probability
The aim of this study is to present an innovative approach to market analysis based on the research "Leavitt Market Projections." This technical tool combines one indicator and a probability function to enhance the accuracy and speed of market forecasts.
Key Features
Advanced Indicators : the script includes the Convolution line and a probability oscillator, designed to anticipate market changes. These indicators provide timely signals and offer a clear view of price dynamics.
Convolution Probability Function : The Convolution Probability (CP) is a key element of the script. A significant increase in this probability often precedes a market decline, while a decrease in probability can signal a bullish move. The Convolution Probability Function:
At each bar, i, the linear regression routine finds the two parameters for the straight line: y=mix+bi.
Standard deviations can be calculated from the sequence of slopes, {mi}, and intercepts, {bi}.
Each standard deviation has a corresponding probability.
Their adjusted product is the Convolution Probability, CP. The construction of the Convolution Probability is straightforward. The adjusted product is the probability of one times 1− the probability of the other.
Customizable Settings : Users can define oversold and overbought levels, as well as set an offset for the linear regression calculation. These options allow for tailoring the script to individual trading strategies and market conditions.
Statistical Analysis : Each analyzed bar generates regression parameters that allow for the calculation of standard deviations and associated probabilities, providing an in-depth view of market dynamics.
The results from applying this technical tool show increased accuracy and speed in market forecasts. The combination of Convolution indicator and the probability function enables the identification of turning points and the anticipation of market changes.
Additional information:
Leavitt, in his study, considers the SPY chart.
When the Convolution Probability (CP) is high, it indicates that the probability P1 (related to the slope) is high, and conversely, when CP is low, P1 is low and P2 is high.
For the calculation of probability, an approximate formula of the Cumulative Distribution Function (CDF) has been used, which is given by: CDF(x)=21(1+erf(σ2x−μ)) where μ is the mean and σ is the standard deviation.
For the calculation of probability, the formula used in this script is: 0.5 * (1 + (math.sign(zSlope) * math.sqrt(1 - math.exp(-0.5 * zSlope * zSlope))))
Conclusions
This study presents the approach to market analysis based on the research "Leavitt Market Projections." The script combines Convolution indicator and a Probability function to provide more precise trading signals. The results demonstrate greater accuracy and speed in market forecasts, making this technical tool a valuable asset for market participants.

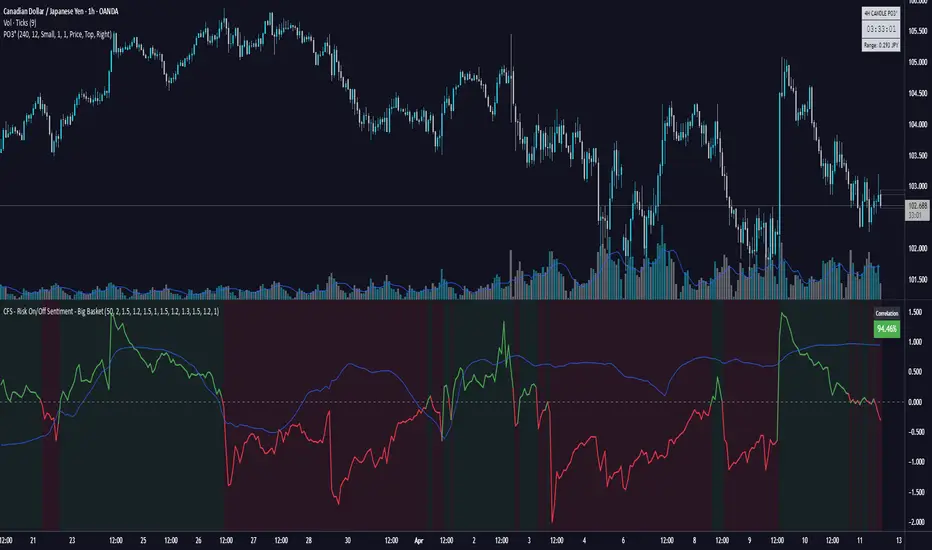
Live Risk On/Off Sentiment Big Basket🔥 Live Risk On/Off Sentiment Indicator 🔥
This indicator provides a clear and immediate assessment of global market risk sentiment by combining multiple key financial instruments across various asset classes. It helps traders quickly gauge whether the market is currently in a risk-on or risk-off environment.
📈 Included Assets:
- Risk-off indicators:** VIX, Gold, US Dollar Index (DXY), US10Y Treasury Yields, TLT (Treasury Bonds)
- Risk-on indicators:** S&P 500 (SPY), Bitcoin (BTC), High Yield Bonds (HYG), AUD/JPY (Forex), Copper/Gold ratio, and Oil (WTI)
🛠️ How it Works:
The indicator calculates a weighted Z-score for each asset, dynamically capturing its performance relative to recent history. Positive values (green) indicate a risk-on sentiment, while negative values (red) suggest a risk-off sentiment.
🚨 Features:
- Fully customizable asset selection and weighting
- Easy-to-understand visual signals
- Adaptable lookback period for short-term and long-term market analysis
💡 How to Use:
- Identify market phases quickly (bullish or bearish sentiment).
- Enhance your decision-making for entries and exits based on broader market conditions.
- Incorporate into any trading strategy to improve alignment with global risk sentiment.
Harness the power of macro analysis and elevate your trading performance!
Enjoy and trade smart! 📊📈
Riseofatrader
ATR % Oscillator - DolphinTradeBot1️⃣ Overview
🔸 This is a simplified version of ATR and TR that shows volatility as percentage changes , making it easier to compare two symbols.
🔸 The indicator compares the volatility of two different assets by calculating the percentage-based price ranges and their moving averages .
📌 This is especially useful for pair traders, as it helps identify which symbol is more volatile, allowing for strategic decisions based on relative movement rather than overall market direction.
2️⃣ How Is It Work?
🔸 For each symbol, it calculates the absolute percentage difference between either:
• Close and Open (net price change), or
• High and Low (daily price range).
🔸 The results are visualized as column bars — the taller the bar, the higher the volatility.
🔸 It also plots a moving average line (SMA) based on the selected range length.
📌 These calculations are independent of the chart you're on — they work purely based on the two selected symbols.
If no symbols are selected, it defaults to using the current chart's symbol.
3️⃣ How to Use It?
With this indicator, you can:
🔸 Compare the volatility between two assets.
🔸 Detect sudden volatility spikes that may signal upcoming momentum.
🔸 Support spread, arbitrage, or correlation-based strategies .
🔸 See which symbol is gaining market attention (a larger difference = more activity).
Example: Compare BTC vs ETH to see which one is dominating in terms of price action or volatility.
4️⃣⚙️ Settings
🔸 Symbol Settings
• Symbol-1 / Symbol-2: Choose the two assets to compare.
• Checkboxes: Enable/disable visibility for each symbol's data.
🔸 Calculation Settings
• Range Average: The number of bars used for the moving average.
• Calculation Source:
- Close-Open: Measures net price movement.
- High-Low: Measures total price range.

Entry Signals (SMA50/RSI/MACD/Vol) with Pivot TP/SLIndikator der die im 1m Chart ein Entry Signal mit TP und SL gibt.

Avg 30-min High-Low Pips (Bar Chart)Checks the Avg of User Input Days Pip Movement.
This will help in identifying times of the days where the movement can be most and times of the day when the movement on average is the least.

Niveles de 100 Pips XAUUSD - Rango Controlado300 pips above the current price
700 pips below the current price
🔎 Why?
Because normally in gold (XAUUSD), you want to see more levels below (past supports) and not as much space above where there are no levels.

avgPrice - Accum./Dist.I would explain the understanding of "FREQUENCY" and how it is built and realized in this indicator: "avgPrice - Accum./Dist" and "avgPrice - VF20".
Let's look at the explanation:
BASIC KNOWLEDGE ON FREQUENCY
FOR TRADERS
If you are a Trader, then read this article. This article means a lot to you, and will change many things about your life in the trading world.
The knowledge in this article is very secret, the main key to success for traders You would not found it anywhere, search all youtube shows, articles on websites, you would not found it. It even takes a very long time for you to realize it, most are not aware and do not know it. You would only know if you are told.
First of all, about "frequency"
Frequency is a unit in a single buy and sell transaction. In one time, for example in one minute, the number of times each transaction occurs is different. This difference will be closely related to the level of liquidity and volatility. We can see that the frequency is divided into three, 1) low frequency, 2) medium frequency, and 3) high frequency.
In one trading day, the market is open for 4 hours, or for 245 minutes. If we look at the
IDX:ADRO stock on March 5, 2022, the frequency is 50,339, and if divided by 245 minutes, then every minute there are 205 frequencies. If reduced again in seconds, it means that every second there are 3.5 frequencies or if rounded up, there are 3 buy and sell transactions every second. While the IDX:KREN stock on March 5, 2022, the frequency is 3,552, and if divided by 245 minutes, then every minute there are 14.5 frequencies. If reduced again in seconds, it means that every 4 seconds there is 1 frequency. This shows that the IDX:ADRO stock has a high frequency, while the IDX:KREN stock has a low frequency.
So the higher the frequency, the lower the risk. Because it will avoid sudden price drops. Because in high frequency, Buyer or Seller find it difficult to go to many ticks, because it has only gone down 1 tick, there are already many other Buyers and Sellers blocking it. Therefore, the higher the frequency, the more liquid a stock is, and the lower the volatility. Conversely, the lower the frequency, the less liquid a stock is and the higher the volatility.
We know that stocks with low frequency, less liquid, and high volatility are high risk stocks, less safe for your capital. Conversely, stocks with high frequency, more liquid, and low volatility are low risk stocks, very safe for your capital.
Because in high frequency stocks, when you have a stoploss target, when the price drops to your stoploss target price position, you can exit quickly. Unlike low frequency stocks, when you have a stoploss target, once it drops it can immediately fall 5% - 10% down, if you don't have time to cutloss, your capital can immediately bleed in one hit.
VOLUME & FREQUENCY
Generally, the ratio of the volume is the same as the frequency. However, if the volume is greater than the frequency, it means that each transaction of buying and selling uses big money. The use of big money in transactions is a sign that the transaction is carried out by a big player/big fund. Conversely, if the volume is smaller than the frequency, it means that each transaction of buying and selling uses small money. The use of small money in transactions is a sign that the transaction is carried out by a small player/retailer.
It can be interpreted that volume> frequency = accumulation and volume < frequency = distribution. So if volume> frequency indicates that the price in the future is highly likely to increase. Conversely, if volume < frequency indicates that the price in the future is highly likely to decrease.
To make it easier to measure the risk ratio of volume divided by frequency, we can use the symbol V/F. The smaller the V/F means "distribution", and the larger the V/F means "accumulation". See the my own indicator namely: "Frequency Crowded"
After basic knowledge about frequency and its relationship to volume, we call it VF, which is volume divided by frequency. See the my own indicator namely: avgPrice - VF20
And this indicator you see is called "avgPrice - Accum./ Dist." The point is to find out the accumulation area and distribution area. As mentioned in the description above, that volume > frequency = accumulation and volume < frequency = distribution. This indicator is built on the basis of this understanding.
If you want to discuss further, please just chat me, I would always be happy to reply. For the sake of knowledge and for everyone to be able to generate consistent profits in the trading world
Enjoy, hopefully useful.

FrequencyUntil the publication of this indicator, only here you found frequency indicator in Tradingview platform.

Pre Open and Open Range BreakoutNew York ORB 15minutes ORB
pre-open 8am-815am ORB
open market 930 pm-945am ORB
base from zzzcrypto123 ORB

Frequency AnalyzerThis indicator is called a frequency analyzer to detect whale activity. It works to detect exploding candles, before they explode.
This indicator is called Frequency Analyzer, to analyze the movement of big money in the stock market. But this indicator cannot be on the Tradingview platform, you know why, because in tradingview there is no indicator called frequency, because buy and sell transactions can only be found in securities that are directly connected to the exchange. That's why we don't find the frequency indicator on the Tradingview platform. After several attempts, I finally found the right formula to define frequency in the tradingview pine editor, and I have also released the frequency indicator in my script. That was the beginning that then developed it and made this indicator "Frequency Analyzer."
What is its use, this indicator is useful for detecting large transactions made by whales. But we don't know, it's a buy or sell transaction. The indicator only describes large transactions made by whales. Of course this has an impact on whether the candle after that occurs a rally or a drop. Therefore, I describe in the "Frequency Analyzer" indicator script because the idea of this formula by Dean Earwicker.
That this is useful for detecting exploding candles before exploding, to detect super bullish before bullish.If the candle is in the support position and there is the highest bar, that is big buying by whales and of course the exploding candle becomes a rally. Conversely, if the candle position is in the resistance and there is the highest bar, that is big selling by whale then of course the candle becomes a drop. So this is an indicator to detect exploding candles before they explode, the candles become super rally or super drop.
It is also important that you look at the trend direction, whether it is downtrend, sideways, or uptrend. If you want to be safer, I suggest pressing long after breakout resistance, or pressing short after breakdown support.

DALFXDALFX is a powerful and visually intuitive trading tool designed to identify potential trend reversals and momentum shifts in the market. It combines dynamic smoothing techniques with clear visual signals to help traders make informed decisions.
Key Features:
✔ Multi-Layered Signal System – Generates precise buy and sell signals based on momentum shifts and extreme price conditions.
✔ Smart Trend Smoothing – Incorporates customizable moving average options to filter out market noise and highlight the dominant trend.
✔ Visual Zone Recognition – Clearly defines key market conditions with gradient-based zones, allowing traders to quickly assess overextended price movements.
✔ Bollinger Bands Integration (Optional) – Enhances volatility analysis when enabled, providing additional confirmation for potential breakouts or reversals.
✔ Divergence Detection (Optional) – Identifies hidden strength or weakness in price action, offering early warnings for potential trend changes.
✔ Clean & User-Friendly Design – Focuses on clarity with minimal distractions, ensuring traders can interpret signals at a glance.
How It Works:
Buy Signals appear when momentum shifts upward from lower zones, suggesting potential entry opportunities.
Sell Signals trigger when momentum weakens in upper zones, indicating possible exits or short setups.
The gradient zones highlight extreme conditions, helping traders avoid chasing overextended moves.
Why Traders Love DALFX:
Versatile – Works across multiple timeframes and instruments (forex, stocks, crypto).
Customizable – Adjust smoothing methods and sensitivity to match different trading styles.
Actionable Alerts – Clear visual signals reduce guesswork and improve trade timing.
Ideal For: Swing traders, day traders, and investors looking for a reliable momentum-based indicator with clear visual cues.

IntraDay Zones - RaulAfisari si configurari sesiuni de tranzactionare de tip IntraDay (1-3 sesiuni disponibile)

avgPrice - VFHere I create my own indicator on Tradingview to detect whale movements in stocks, crypto, & forex, which is suitable for all trading instruments. This the best i made indicator ever.
Why is this indicator called avgPrice VF , because it is the [i average price along with the Volume and Frequency . Not only the average price, and not only the average price along with the volume, but also includes the frequency in it, what is the use for?
This indicator useful for detect the whale approach by volume and frequency analysys. it is useful for detecting increases based on whale/market maker/ smart money buying actions and detecting decreases based on whale/market maker/ smart money selling actions.
There is also an automatic analysis of "Long" and "Short" so it is easy to use, with 3 line features with different colors and different functions as explained below:
The green or red lines are the average price and volume, the yellow line is the average price & frequency, and the gray line is the average price, volume, and frequency. How to read the line like this: if the gray line is below the yellow line, then there is accumulation by whales, conversely if the gray line is above the yellow line, then there is distribution by whales, and if the price below the red line, there is downtrend and if the price above the green line, there is uptrend. It has been accompanied by information below right regarding uptrend or downtrend and accumulation or distribution. And I have summarized whale detection analysis in one simple indicator, if you want to "Long" is just "Long" and if you want to "Short" is just "Short". Long means accummulation by whale from retailer and short means distribution by whale to retailer.
I like to share and I love the world of trading, for me this is like a second life. Hopefully this description is useful and motivates friends to get consistent profits from trading.
Greetings,

Silver Strat |BASIC| [AgJ]Silver Strat |Basic by SilverJROM
Strategy for multiple assets on cryptocurrencies
The Silver Strategy is a trading approach primarily developed for a wide range of cryptocurrencies, with Bitcoin (BTC) and Solana (SOL) serving as the main assets for testing and refinement. Its effectiveness in the cryptocurrency market stems from two key characteristics of these assets: (1) their prices tend to exhibit strong trends, either upward or downward, and (2) over the long term, their value generally increases. The strategy is designed to capitalize on these traits, and it may not perform well if applied to assets that lack these behaviors.
Additionally, the Silver Strategy is built for simplicity and flexibility. It features a core trading logic that handles the primary buy and sell decisions, complemented by optional auxiliary logic that users can enable or disable as needed. To support decision-making, the strategy incorporates trend and momentum calculations, which are visually represented through bar colors indicating trend strength. It also includes performance metrics, making it easy for users to evaluate the strategy’s results on a specific asset.
🧩 Key Features
8 Indicators
The strategy combines 8 unique indicators to analyze market trends, momentum, and conditions, generating precise buy and sell signals across various cryptocurrencies:
Oscillators : Detect overbought/oversold levels to pinpoint entry and exit opportunities, particularly in range-bound markets.
Trend Following : Monitor price direction and persistence to align with sustained bullish or bearish trends.
Momentum & Strength : Evaluate the speed and force of price movements to identify strong, actionable trends versus weaker signals.
Adaptive Calculations : Dynamically adjust to volatility and asset-specific factors, ensuring reliable performance.
By integrating these indicator classes, the strategy delivers a cohesive, adaptable system for confident trading decisions.
Customizability
The strategy has a core trading logic for long and short positions, with optional supplementary logic users can toggle to adjust its behavior for specific assets. This simple design skips complex tweaks, letting users easily adapt it to various cryptocurrencies or trading styles, like momentum or trend-following, while keeping it user-friendly and flexible.
Trend Strength
The strategy uses bar color for trend strength to reflect price trends and momentum based on its 8 indicators. Green bars signal a strong upward trend with bullish momentum, while red bars indicate a downward trend or crash. This color-coding helps traders quickly identify market conditions for better entry and exit decisions. Note that the bar color is a lagged indicator, reflecting past price movements rather than real-time shifts.
Metrics
The Silver Strategy offers user-friendly metrics integrated into TradingView, displaying the strategy’s performance directly on the time series screen. These metrics provide a clear summary of historical results, enabling users to assess and customize the strategy for each asset based on its past performance. Key features include:
Sortino Ratio to assess risk-adjusted returns with a focus on downside risk
Sharpe Ratio to measure overall return per unit of risk.
Profitability indicates the success rate of trades
Net Profit highlights the total gains achieved over time.
Class rating , reflecting its overall performance quality.
By analyzing these metrics, users can make data-driven decisions when adjusting the strategy’s logic flags—such as toggling Logic1 or Logic9—to optimize its behavior for different cryptocurrencies or market conditions, ensuring better alignment with their trading objectives.
BTCUSD
SOLUSD
ETHUSD
🔵 Usage
Tailor and Test: Create a customized strategy for any cryptocurrency by toggling logic flags (e.g., Logic1 for trend focus, Logic9 for momentum filters) to suit your trading style. Use the provided metrics to test historical performance—evaluating risk-adjusted returns, win rate, and overall gains—and refine your setup before deploying the strategy in live markets.
Risk Management : Implement robust risk controls by setting appropriate position sizes, using stop-loss orders, and adjusting trade frequency based on market volatility. This ensures the strategy aligns with your risk tolerance and financial goals, especially in the unpredictable crypto market.
Disclaimer : Past results, as reflected in the metrics, do not guarantee future performance. Market conditions, volatility, and asset behavior can change, so always trade with caution and adapt to current trends.
Silver Strat is a specific tool to help managing a portfolio mainly cryptocurrencies. This is a basic version, if you like this one, appreciate it and would like to support my work a PRO version of this strategy would be available version, kindly drop me a DM.

RSI Divergence w/ Visuals + Candle ConfirmationStrategy Blueprint: RSI Divergence Reversal (1H Timeframe)
RSI Period: 10
Timeframe: 1H
Entry Logic:
Bullish Divergence:
Price makes a lower low
RSI makes a higher low
RSI is below 30 before turning upward
Bearish Divergence:
Price makes a higher high
RSI makes a lower high
RSI is above 70 before turning downward
Exit Logic:
Fixed stop loss (e.g., 40 pips)
Fixed take profit (e.g., 80 pips)
Plot divergence lines:
Green for bullish divergence
Red for bearish divergence
Candlestick confirmation:
Bullish divergence triggers only if there's a bullish candle (close > open)
Bearish divergence triggers only if there's a bearish candle (close < open)

Volume Box PressureThis is a liquidity analysis to determine support and resistance from large volumes that are automatically detected. Its use is if the candle breakout upwards from the box, then the candle would fly high. Conversely, if the candle breakdown downwards from the box, then the candle would fall deep.

Wave Analyzer - Bobal [hamgkia]The Bobal tool is a volume-based wave analyzer designed to highlight the effort behind price movement within trend waves. It is built with a focus on clarity, speed of response, and a Wyckoff-inspired philosophy, where volume and trend direction are deeply intertwined.
This script offers a unique visualization of directional volume flow — up or down — in clearly segmented waves, allowing traders to assess who is in control and how strong their effort is. It does this by calculating dynamic trend waves, accumulating volume within those waves, and comparing volume to volatility for normalization.
🔶 WHAT'S INCLUDED
Detects directional waves based on your selected moving average (SMA, EMA, WMA, or HMA).
Accumulates volume within each wave, creating a distinct "volume block" per wave.
Normalizes volume by ATR (optional) to adjust for current market volatility.
Applies a power function to volume strength for dynamic contrast (stronger waves stand out visually).
Plots volume histograms in real-time: green/orange for up waves, red/fuchsia for down waves.
Optional - displays trend strength background based on recent price expansion vs ATR.
🔷 HOW IT WORKS
Wave Definition
A wave is defined as a sequence of bars moving in the same direction based on a selected moving average:
If the MA rises → uptrend wave
If the MA falls → downtrend wave
Wave resets on direction change.
Volume Accumulation
Volume is accumulated within each wave, starting fresh at the beginning of each new wave. This clean segmentation reveals whether the current wave is attracting participation (volume).
Normalization (Optional)
Volume can be normalized by the ATR (Average True Range) to account for volatility differences across symbols and timeframes. This makes comparisons more meaningful.
Strength Calculation
Volume strength is calculated by comparing current wave volume to the maximum over a recent period (default: 50 bars), and applying a pow() function for expressive scaling. This emphasizes high-effort waves while de-emphasizing noise.
🔶 USAGE
A new wave starts when the selected MA (SMA, EMA, WMA, HMA) changes direction.
Read the Strength of the Current Wave
🟩 — strong up
🟧 — weak up
🟪 — weak down
🟥 — strong down
Look for these setups
📉 Strong down wave 🟥 followed by weak up wave 🟧 — possible lower high, selling may resume.
📈 Strong up wave 🟩 followed by weak down wave 🟪 — possible bullish absorption, look for long setups.
Wave is long, but volume fades (bars shrink) — trend may be slowing, consider tightening stops or avoiding late entries.
Trend is increasing, volumes are growing — potential entry points.
Use Background Strength for Context
🟩 — bright green — strong bullish
🟥 — bright red — strong bearish
Any dim or translucent color — no clear trend
What NOT to do
Don’t enter blindly on volume spikes — check direction and trend background first.
Don’t treat every strong bar as a signal — look for sequences and transitions, not isolated bars.
Ideal Use Cases
Confirming trend strength before entry.
Avoiding fakeouts in low-volume waves.
Spotting transitions in buyer/seller dominance.
Reading market participation in real time.

avgPriceVolumeThis is a more precise indicator than Moving Average (MA). Unlike MA which displays the average price, the avgPriceVolume indicator displays the average price along with its volume. So this indicator is a precise line based on the real market conditions.
