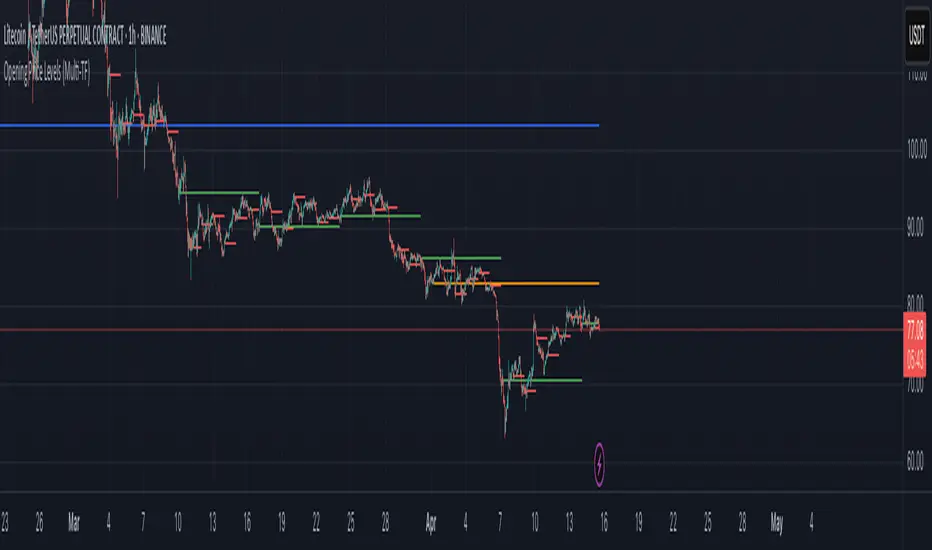
Opening Price LevelsOpening Price Levels
This simple and effective indicator automatically draws horizontal lines at the opening price of each major period:
Year
Quarter
Month
Week
Day
Each line extends until the end of its respective period, helping you quickly identify and react to key institutional price levels and market structure shifts.
🔧 Features:
Toggle visibility for each timeframe (Year, Quarter, Month, Week, Day)
Clean visual presentation using plot.style_linebr, ensuring no overlapping or vertical jumps
Automatically adapts to your chart’s timeframe and session settings
This tool is great for both discretionary and systematic traders who want to add more context and structure to their analysis.
Indicators and strategies

Opening Price Levels (by Period)This indicator draws clean horizontal lines at the opening prices of key time periods: Year, Quarter, Month, Week, and Day.
Each line is plotted only within its own time range, so there's no visual clutter or vertical jumps between periods.
Perfect for traders who want to:
Identify and react to institutional levels.
Track price behavior relative to major opens.
Keep charts clean and easy to read.
Features:
✅ Toggle visibility for each period (Year, Quarter, Month, Week, Day).
🎯 Accurate open levels, aligned with your chart's timeframe and session settings.
✨ Clean segments — each line only spans its original period.
Swing form indicatorCandle 2 and Candle 3 Swing form
This indicator for check if swing formed credit to TTrade.
This only help you to identify the swing form.
Candle 2 > Candle 3,
If C2 is not found, indicator will look for C3
⮯ - form a swing point on the top
⮭ - form a swing point on the bottom
❓- potentially form a swing point

Global Liquidity IndexThe Global Liquidity Index measures the net liquidity in the global financial system by combining central bank balance sheets and M2 money supply, subtracting liquidity drains like TGA and RRP, and smoothing the result with moving averages or rate of change.

ATR % + Pump Detector📘 **ATR % + Pump Detector (Fixed 0.10%)**
This indicator combines two powerful volatility tools in one:
- **ATR % Display (Blue):**
Calculates the Average True Range as a percentage of price. Triggers an alert when ATR % exceeds **0.10%**, signaling rising volatility and potential breakout conditions.
- **Pump % Detector (Red):**
Measures the percentage change from **open to close** of the current candle. Triggers alerts when the move exceeds **+0.10%** (pump) or **–0.10%** (dump), helping you catch sudden price spikes in real time.
🔹 **Top-right display** shows both metrics in a clean table
🔹 Works on **any timeframe**
🔹 Ideal for **momentum trading, breakout entries**, or filtering low-vol setups

FeraTrading Compression IndicatorThe FeraTrading Compression Indicator is designed to identify potential breakouts from consolidation zones or at critical support and resistance levels. It combines volatility filtering with precise candle analysis to reduce market noise and highlight high-probability setups. An arrow is formed when all criteria's are reached. This methodology aims to catch significant price movements while avoiding false breakouts, helping traders make more confident and informed decisions.
The indicator features a single adjustable setting that controls signal sensitivity. This value ranges from 0.01 to 1 (default: 0.75).
Higher values (e.g., 0.8–1) generate more signals by relaxing the detection criteria, which may include more false positives.
Lower values (e.g., 0.01–0.3) apply stricter filtering, showing fewer but potentially more reliable signals.
The indicator aims to find the upcoming trend no matter what the chart is doing. The trend may last for 15 minutes or a few hours.

Cot DeltaCOT Delta by Jacopo
Designed to visualize and analyze data related to the Commitment of Traders (COT) report, which is published by the Commodity Futures Trading Commission (CFTC) in the United States. Its primary purpose is to display the long and short positions of traders on futures contracts, divided by categories like Commercial, Noncommercial, and Nonreportable.
Main Features:
Selection Mode: The user can choose from several modes to display COT data, such as "Auto", "Root", "Base currency", or "Currency". This determines which currency will be shown on the chart.
Contract Type: It is possible to select whether to display data for Futures, Options, or both (Futures + Options).
COT Category: The user can choose one of the trader categories like Commercial Positions, Noncommercial Positions, or Nonreportable Positions to analyze positions based on the type of market participant.
Data Visualization: The chart shows long, short, and net positions (long - short) with separate lines, using different colors for each type of position:
Long positions in green.
Short positions in red.
Net difference (long - short) in white.
Data Table: A table is displayed to present the data clearly, with the following columns:
Long: Long positions.
Short: Short positions.
Total: The net sum of positions (long - short).
Changes: The difference between current and previous data (delta) in both absolute and percentage terms.
Variation Visualization: The table also shows the variations from the previous period (both in absolute and percentage terms), with conditional background colors to highlight positive or negative changes.
Optional CFTC Code: The user can input a custom CFTC code to analyze specific data, if necessary.
In Summary:
This indicator provides a clear and precise visualization of trader positions (long and short) on futures and options contracts, making it easier to analyze market dynamics related to commercial and non-commercial traders. The combination of a chart and table allows for real-time tracking of position changes.

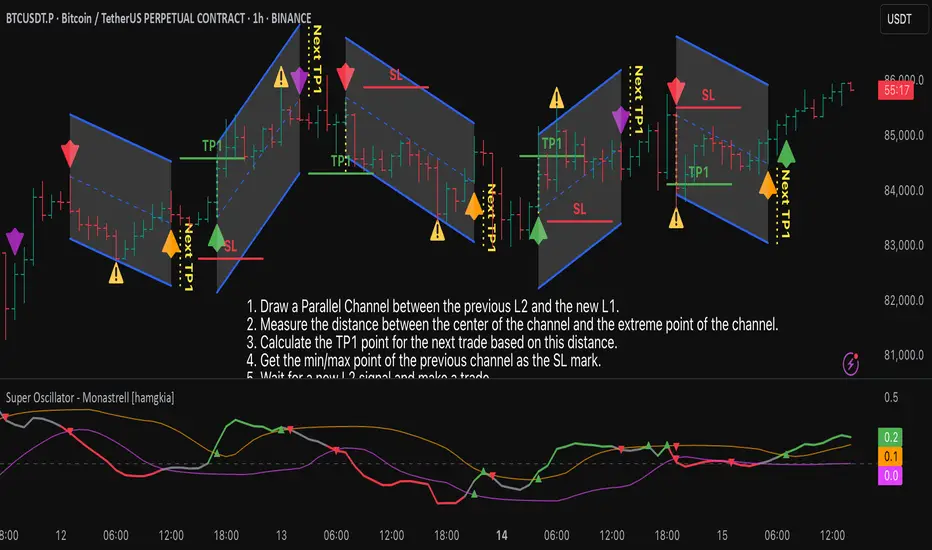
Super Oscillator - Monastrell [hamgkia]The Monastrell tool is an oscillator designed designed to track directional price movement adjusted by volume and normalized by volatility. It dynamically calculates overbought and oversold thresholds using percentiles and adapts to market conditions through trend bias and threshold smoothing.
Built with a layered, modular logic structure, the Monastrell Oscillator offers powerful analytical capabilities for both discretionary and algorithmic traders.
🔶 WHAT'S INCLUDED
Oscillator based on smoothed price change enhanced by a volume deviation factor.
Normalization through ATR to adapt readings across assets and timeframes.
Trend bias factor adjusts oscillator vertically depending on short- vs long-term EMA drift.
Overbought/Oversold zones determined by interpolation and smoothed via EMA.
Color-coded oscillator line indicating current state: green (above upper), red (below lower), gray (neutral).
Optional signal labels at key threshold crossings.
Optional informational label displaying live oscillator value, thresholds, and signal confidence.
Signal strength score based on distance to thresholds and threshold positioning.
Built-in alert conditions for 4 types of transitions.
🔷 HOW IT WORKS
Oscillator
The oscillator measures the smoothed difference between current and previous close prices, then scales this by the relative increase or decrease in volume compared to its average. This gives more weight to moves backed by participation.
Normalization
The result is normalized using ATR, turning the oscillator into a scale-independent metric. Then, trend bias is applied — calculated by comparing short- and long-term EMA slopes — shifting the oscillator up or down during trending environments.
Thresholds
Dynamic threshold levels are not static: they are calculated using percentile ranges over the lookback window. This ensures overbought and oversold zones reflect current volatility and price dynamics, rather than using fixed bands.
Signal Strength
Each bar is evaluated in relation to these adaptive thresholds, triggering label plots and alerts if conditions are met. In addition, the oscillator computes a real-time signal strength value that evaluates how actionable a signal is based on multiple internal metrics.
Labels
Stop SELL (L1) — Crossing above the oversold zone.
Stop BUY (L1) — Crossing below the overbought zone.
BUY and TP (L2) — Re-entering from below oversold.
SELL and TP (L2) — Re-entering from above overbought.
These label events are also available as alert conditions.
A dynamic scoring system rates the quality of the current signal based on:
Distance from the nearest threshold.
Width of the threshold channel.
Offset of thresholds relative to neutral zero level.
This produces a signal strength value categorized as:
💭 Weak
🔆 Average
🚀 Strong
If information label is enabled, the score and structure are displayed as a floating label on the chart.
🔶 USAGE
New signals appears when Oscillator crossing overbought/oversold zones.
L1 signals gives you advise what NOT TO DO .
L2 signals gives you advise what TO DO .
If you draw channels using my hint - you will have a very good SL level and potential TP1 level:
The indicator showed impressive results on the emulator in two formats:
1. With trailing stops.
2. With preset TP/SL, as I drew on the chart.
Tips
If the upper/lower threshold band is far from zero (> 0.3 & < -0.3), it often indicates trend exhaustion.
You can adjust Trend Bias Influence to control how sensitive the oscillator is to trend direction.
Use Signal Strength for confidence scoring or to gate trades in automation.
Draw channels, this will help to set SL and TP .
Fix profits before the trend reverses and drags you into minus, this indicator is more suitable for trades with clear ranges.
Zero-Lag Forex Buy/Sell Indicatorsimple buy and sell It Works:
Hull Moving Average (HMA) – Smoother and faster than SMA/EMA, reducing lag.
RSI Filter – Avoids buying in overbought conditions or selling in oversold.
Breakout Confirmation – Ensures the price confirms a new high/low before signaling.
Usage:
Buy Signal (Green Triangle):
✅ Price above HMA
✅ RSI below 30 (oversold)
✅ Price breaks recent high (confirmation)
Sell Signal (Red Triangle):
✅ Price below HMA
✅ RSI above 70 (overbought)
✅ Price breaks recent low (confirmation)
How to Improve Further:
Add Volume Confirmation (if trading a currency with reliable volume data).
Use Multi-Timeframe Analysis (e.g., check if the trend aligns on H4 + H1).
Combine with Support/Resistance Levels for stronger entries.

RSI Cross MA Signals Only"RSI Cross MA Signals Only"
This indicator generates clean and minimal buy/sell signals based on RSI crossing above or below its simple moving average (SMA). A buy signal is shown when the RSI crosses above its moving average, and a sell signal is shown when it crosses below — but only once per trend direction to avoid repeated alerts.
It is recommended to use an RSI MA Length of 5 for faster signal response.
Buy Signal: RSI crosses above its MA and you are not already in a trade.
Sell Signal: RSI crosses below its MA and you are in a trade.
Designed to reduce signal noise and repainting.

Buffett Indicator (Wilshire 5000 / GDP)The Buffett Indicator (Wilshire 5000 / GDP) is a macroeconomic metric used to assess whether the U.S. stock market is overvalued or undervalued. It is calculated by dividing the total market capitalization (represented by the Wilshire 5000 Index) by the U.S. Gross Domestic Product (GDP). A value above 1 (or 100%) may indicate an overvalued market, while a value below 1 suggests potential undervaluation. This indicator is best suited for long-term investment analysis.

Mebob High-Low Lines (30 Days)Here is the introduction to the rules:
1. You trade it on the SP500 Index.
2. You use a 5-min chart.
3. You only use it during Regular trading hours only (09:30am – 15:00pm
Eastern Standard time).
A more detailed explanation follows below:
1. The US stock market indices opens at 09:30am New York local time.
2. The 5-min reference bar to wait for is the 10:05am – 10:10am bar.
3. This is the 8th 5min bar into the regular trading session.
4. Observe the high and the low of the reference bar.
5. Draw a horizontal line through the high of the reference bar.
6. Draw a horizontal line through the low of the reference bar.
7. If the SP500 closes above the high of the reference bar “highest line”, it is a
BUY signal.
8. If the SP500 closes below the low of the reference bar “lowest line”, it is a SELL
SHORT signal.
9. The stop loss is placed either at the most recent swing or above/below the
reference bar.
The seemingly erratic performance of the "MeBob" (trading rule) is simply what one
would expect from a trend following system. Bob, who has a lot of good stuff, was
simply giving the newbies a "Trigger" to get them into day trades at good times.

Directional RSI Signal MapDirectional RSI Signal Map
This script analyzes RSI values across four different timeframes to detect market bias (bullish, bearish, or neutral) and trend direction. It generates:
Green up arrows for bullish signals (bias and trend are both bullish)
Red down arrows for bearish signals (bias and trend are both bearish)
Green circles when trend is bullish but bias is neutral
Red circles when trend is bearish but bias is neutral
You can adjust RSI levels, timeframes, and choose whether to enable the RSI filter. Alerts are included for the main bullish/bearish signals.

ATR % (Fixed 0.10% Alert)### 📘 **ATR % (Fixed 0.10% Alert)**
This indicator displays the **ATR as a percentage of price** in the **top-right corner** of the chart using a clean blue table. It also includes a **fixed alert** that triggers when ATR % exceeds **0.10%**, signaling increased volatility and potential breakout conditions.
🔹 Works on any timeframe
🔹 Designed for system traders using ATR-based risk or momentum filters
🔹 Ideal for confirming entry zones or filtering out low-volatility traps

Triple StochasticTriple Stochastic Elasticity Indicator
This custom indicator leverages the power of multi-timeframe analysis by combining three Stochastic Oscillators across different timeframes to identify potential trade entries based on elasticity and divergence between momentum curves.
📊 How It Works:
The indicator plots Stochastic values from three timeframes (e.g., 5m, 15m, and 1h), allowing you to observe how momentum behaves at different scales.
It highlights moments of elasticity—where the Stochastics stretch apart and then begin to converge—potentially signaling a reversion opportunity or trend continuation.
By identifying these stretches and snapbacks in momentum alignment, you can better time your entries and exits with improved confidence.
🔍 Use Case:
Look for divergence or convergence between the Stochastics.
Ideal for trend-following entries, pullback setups, and momentum reversal spotting.
Works best when combined with price action, S/R zones, or volume confirmation.
🛠 Customization:
Timeframes for each Stochastic are fully customizable.
Options to tweak %K, %D, and smoothing values to fit your strategy.
I recommend to remove the D%
And set the following settings
5 : 3 : 3
14 : 3 : 3
56 : 12 :12
Visual alerts can be added for when certain conditions are met (e.g., all three Stochs cross overbought/oversold levels).
Global Liquidity IndexGlobal Liquidity Index
This indicator tracks worldwide liquidity by aggregating global M2 money supply, the U.S. Treasury General Account (TGA), the Federal Reserve’s Reverse Repo (RRP) facility, and major central bank balance sheets. It offers insight into the overall liquidity environment, often a key driver of risk asset performance.

Moving average with different timeThis script allowing you to plot up to 6 different types of moving averages (MAs) on the chart, each with customizable parameters such as type, length, source, color, and timeframe. It also allows you to set different timeframes for each moving average.
Key Features:
Multiple Moving Averages: You can add up to 6 different moving averages to your chart.
Each MA can be one of the following types: SMA, EMA, SMMA (RMA), WMA, or VWMA.
Custom Timeframes: Each moving average can be applied to a specific timeframe, giving you flexibility to compare different periods (e.g., a 50-period moving average on the 1-hour chart and a 200-period moving average on the 4-hour chart).
Customizable Inputs:
Type: Choose between SMA, EMA, SMMA, WMA, or VWMA for each MA.
Source: You can select the price data source (e.g., close, open, high, low).
Length: Set the number of periods (length) for each moving average.
Color: Each moving average can be assigned a specific color.
Timeframe: Customize the timeframe for each moving average individually (e.g., MA1 on 15-minute, MA2 on 1-hour).
User Interface:
The script includes a data window display for each moving average, allowing you to control whether to show each MA and configure its settings directly from the settings menu.
Flexible Use:
Toggle individual moving averages on and off with the show checkbox for each MA.
Customize each MA's parameters without affecting others.
Parameters:
MA Type: You can choose between different moving averages (SMA, EMA, etc.).
Source: Price data used for calculating the moving average (e.g., close, open, etc.).
Length: Defines the period (number of bars) for each moving average.
Color: Change the line color for each moving average for better visualization.
Timeframe: Set a different timeframe for each moving average (e.g., 1-day MA vs. 1-week MA).
Example Use Case:
You might use this indicator to track short-term, medium-term, and long-term trends by adding multiple MAs with different lengths and timeframes. For example:
MA1 (20-period) might be an SMA on a 1-hour chart.
MA2 (50-period) might be an EMA on a 4-hour chart.
MA3 (100-period) might be a WMA on a daily chart.
This setup allows you to visually track the market's behavior across different timeframes and better identify trends, crossovers, and other patterns.
How to Customize:
Show/Hide MAs: Enable or disable each moving average from the input menu.
Modify Parameters: Change the MA type, source, length, and color for each individual moving average.
Timeframes: Set different timeframes for each moving average for more detailed analysis.
With this Moving Average Ribbon, you get a versatile and visually rich tool to aid in technical analysis.

RSI Multi-Timeframe StatusThis multi-timeframe RSI status indicator provides a comprehensive overview of RSI conditions across four different timeframes (1-minute, 5-minute, 15-minute, and 1-hour) in a clean, organized table format.
The indicator features:
1. **Multi-timeframe RSI Analysis**: Tracks RSI values across four timeframes simultaneously
2. **RSI Trend Detection**: Shows whether each RSI is rising or falling compared to previous bars
3. **Visual Status Indicators**: Color-coded cells instantly show bullish (green), bearish (red), or neutral (gray) conditions
4. **Momentum Tracking**: Displays the numerical change in RSI values to show strength of momentum
5. **Summary Row**: Provides an at-a-glance overview of the overall market bias and trend direction
6. **Configurable Parameters**: Adjustable RSI length, threshold levels, and momentum period
The indicator is designed to help traders identify potential trade setups where multiple timeframes align in the same direction. When more timeframes show similar conditions (all bullish or all bearish) with consistent trend direction (all rising or all falling), it can signal stronger potential trade opportunities.
The status table appears in the top-right corner of your chart and updates in real-time, allowing you to monitor multi-timeframe RSI conditions without switching between timeframes.

UniversoIntroduction
The "Universo" indicator is a sophisticated trend analysis tool designed for the TradingView platform, written in Pine Script v6. It combines multiple technical indicators into a unified system to evaluate market trends and help traders identify potential entry and exit points. By integrating fast, medium, and slow-moving components, it provides a multi-dimensional view of market momentum. The indicator is highly customizable, featuring visual plotting and an optional table for detailed analysis, making it adaptable to various trading styles.
Key Features
Multi-timeframe trend analysis combining fast ("Flash"), medium-fast ("Glide"), and medium-slow ("Echo") indicators, plus hybrid combinations ("Flow" and "Pulse"), into a final "Universus" score.
Customizable long and short thresholds, adjustable between -100 and 100, to suit individual trading preferences.
Optional interactive table displaying current and historical values of key components and metrics like trend direction, Rate of Change (RoC), volatility, and momentum.
Color-coded visualization with multiple themes (e.g., Synthwave, Outrun, Lush) to highlight bullish, bearish, and neutral conditions.
Elegant plotting of a 20-period Simple Moving Average (SMA) with subtle gradients and glow effects for improved chart readability.
How It Works
The "Universo" indicator aggregates data from various technical indicators, computes composite scores, and presents them both visually and numerically. Below is an overview of its components and mechanics.
Core Components
Flash (Fast Indicators): Averages short-term, high-frequency indicators like RSIL, WIL, RSI, STO, FMOMZ, and LLSMA to detect immediate market momentum. Formula: flash = avg(fast_highomega, fast_highsortino) * 100.
Glide (Medium-Fast Indicators): Combines medium-term indicators such as FSPMOM, CCI, AAMDMOM, and ATRF, with weighted entry and exit calculations for a balanced trend perspective. Formula: glide = avg(glide_entry_weighted, glide_exit_weighted) * 100.
Echo (Medium-Slow Indicators): Uses slower indicators like UNUM, COFFEE, UNIGHE, UNIARSIX, and HULLLOOP to assess longer-term trends. Formula: Echo = avg(UNUM.x(0.2, -0.2), COFFEE.x(), ...) * 100.
Flow: Averages Flash and Glide for a short-to-medium-term view. Formula: Flow = avg(flash, glide).
Pulse: Combines Echo and Glide for a medium-to-long-term outlook. Formula: Pulse = avg(Echo, glide).
Universus (Final Score): Averages Flow, Flash, Glide, Echo, and Pulse to provide a comprehensive market condition score. Formula: Universo = avg(Flow, flash, glide, Echo, Pulse).
Visualization
SMA Plot: A 20-period SMA of the closing price is plotted with colors based on the Universus score: bullish (Universus ≥ Long Threshold) in the long color (e.g., cyan in Synthwave), bearish (Universus < Short Threshold) in the short color (e.g., pink in Synthwave), or neutral in gray. Subtle gradients and a glow effect, scaled by trend strength (math.abs(Universus) / 100), enhance readability.
Gradient and Glow: Uses ATR-based bounds (±0.2 ATR for inner gradient, ±0.8 ATR for glow) for a refined visual effect.
Table Display
When enabled, the table shows current and historical data (up to 2 bars ago) for components labeled as Flash ("Ieunium"), Glide ("Centum"), Flow ("Tres"), Echo ("Resonare"), Pulse ("Pulsar"), and Universus ("Universo").
Additional metrics include trend direction (Bullish, Bearish, or Neutral), Rate of Change (RoC) via ta.roc(Universus, 1), volatility via normalized standard deviation over 5 bars (ta.stdev(Universus, 5) / ta.sma(Universus, 5)), and momentum surge via 3-bar momentum normalized by Universus (ta.mom(Universus, 3) / Universus).
The table adapts to light or dark mode, with color-coded cells and a customizable position (e.g., Top Right).
Customization Options
Thresholds: Long threshold (longthreshold) and short threshold (shortthreshold), both defaulting to 0.0 and adjustable from -100 to 100.
Color Themes: Options like Synthwave (#00F1FF long, #FF019A short), Outrun, Lush, selectable via input.
Table Settings: Toggle to show/hide the table (show_table) and choose its position (e.g., Top Right, Top Left).
Practical Application
Day Trading: Use Flash and Glide to spot quick momentum shifts.
Swing Trading: Leverage Echo and Pulse for longer-term trend confirmation.
Trend Following: Rely on the Universus score and SMA for overall direction. The adjustable thresholds and detailed table make it versatile across markets and strategies.
Conclusion
The "Universo" indicator is a robust, all-in-one trend analysis tool for TradingView, blending fast, medium, and slow indicators into a single actionable score. With its elegant visuals and detailed data, it empowers traders with flexibility and depth for informed decisions.
Disclaimer
This indicator is for informational and educational purposes only and is not financial advice. Trading involves risks, and users should perform their own research before relying on its signals. The creator is not liable for any financial outcomes from its use.

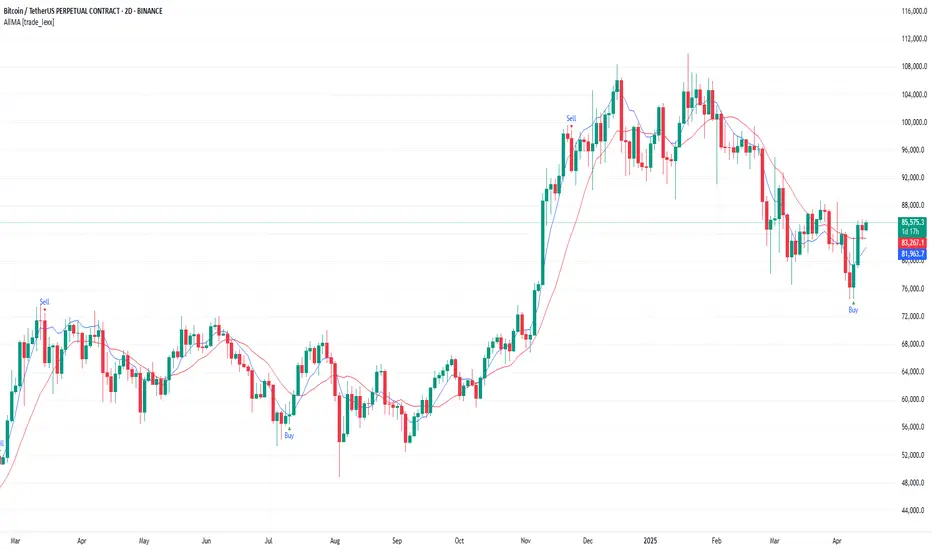
AllMA Trend Radar [trade_lexx]📈 AllMA Trend Radar is your universal trend analysis tool!
📊 What is AllMA Trend Radar?
AllMA Trend Radar is a powerful indicator that uses various types of Moving Averages (MA) to analyze trends and generate trading signals. The indicator allows you to choose from more than 30 different types of moving averages and adjust their parameters to suit your trading style.
💡 The main components of the indicator
📈 Fast and slow moving averages
The indicator uses two main lines:
- Fast MA (blue line): reacts faster to price changes
- Slow MA (red line): smoother, reflects a long-term trend
The combined use of fast and slow MA allows you to get trend confirmation and entry/exit points from the market.
🔄 Wide range of moving averages
There are more than 30 types of moving averages at your disposal:
- SMA: Simple moving average
- EMA: Exponential moving average
- WMA: Weighted moving average
- DEMA: double exponential MA
- TEMA: triple exponential MA
- HMA: Hull Moving Average
- LSMA: Moving average of least squares
- JMA: Eureka Moving Average
- ALMA: Arnaud Legoux Moving Average
- ZLEMA: moving average with zero delay
- And many others!
🔍 Indicator signals
1️⃣ Fast 🆚 Slow MA signals (intersection and ratio of fast and slow MA)
Up/Down signals (intersection)
- Buy (Up) signal:
- What happens: the fast MA crosses the slow MA from bottom to top
- What does the green triangle with the "Buy" label under the candle look
like - What does it mean: a likely upward trend reversal or an uptrend strengthening
- Sell signal (Down):
- What happens: the fast MA crosses the slow MA from top to bottom
- What does it look like: a red triangle with a "Sell" mark above the candle
- What does it mean: a likely downtrend reversal or an increase in the downtrend
Greater/Less signals (ratio)
- Buy signal (Greater):
- What happens: the fast MA becomes higher than the slow MA
- What does it look like: a green triangle with a "Buy" label under the candle
- What does it mean: the formation or confirmation of an uptrend
- Sell signal (Less):
- What happens: the fast MA becomes lower than the slow MA
- What does it look like: a red triangle with a "Sell" mark above the candle
- What does it mean: the formation or confirmation of a downtrend
2️⃣ Signals ⚡️ Fast MA (fast MA and price)
Up/Down signals (intersection)
- Buy signal (Up Fast):
- What happens: the price crosses the fast MA from bottom to top
- What does it look like: a green triangle with a "Buy" label under the candle
- What does it mean: a short-term price growth signal
- Sell signal (Down Fast):
- What happens: the price crosses the fast MA from top to bottom
- What does it look like: a red triangle with a "Sell" label above the candle
- What does it mean: a short-term price drop signal
Greater/Less signals (ratio)
- Buy signal (Greater Fast):
- What happens: the price is getting higher than the fast MA
- What does it look like: a green triangle with a "Buy" label under the candle
- What does it mean: the price is above the fast MA, which indicates an upward movement
- Sell signal (Less Fast):
- What happens: the price is getting lower than the fast MA
- What does it look like: a red triangle with a "Sell" mark above the candle
- What does it mean: the price is under the fast MA, which indicates a downward movement
3️⃣ Signals 🐢 Slow MA (slow MA and price)
Up/Down signals (intersection)
- Buy signal (Up Slow):
- What happens: the price crosses the slow MA from bottom to top
- What does it look like: a green triangle with a "Buy" label under the candle
- What does it mean: a potential medium-term upward trend reversal
- Sell signal (Down Slow):
- What happens: the price crosses the slow MA from top to bottom
- What does it look like: a red triangle with a "Sell" label above the candle
- What does it mean: a potential medium-term downward trend reversal
Greater/Less signals (ratio)
- Buy signal (Greater Slow):
- What happens: the price is getting above the slow MA
- What does it look like: a green triangle with a "Buy" label under the candle
- What does it mean: the price is above the slow MA, which indicates a strong upward movement
- Sell signal (Less Slow):
- What is happening: the price is getting below the slow MA
- What does it look like: a red triangle with a "Sell" mark above the candle
- What does it mean: the price is under the slow MA, which indicates a strong downward movement
🛠 Filters to filter out false signals
1️⃣ Minimum distance between the signals
- What it does: sets the minimum number of candles between signals of the same type
- Why it is needed: it prevents the appearance of too frequent signals, especially during periods of high volatility
- How to set it up: Set a different value for each signal type (default: 3-5 bars)
- Example: if the value is 3 for Up/Down signals, after the buy signal appears, the next buy signal may appear no earlier than 3 bars later
2️⃣ Advanced indicator filters
🔍 RSI Filter
- What it does: Checks the Relative Strength Index (RSI) value before generating a signal
- Why it is needed: it helps to avoid countertrend entries and catch reversal points
- How to set up:
- For buy signals (🔋 Buy): set the RSI range, usually in the oversold zone (for example, 1-30)
- For sell signals (🪫 Sell): set the RSI range, usually in the overbought zone (for example, 70-100)
- Example: if the RSI = 25 (in the range 1-30), the buy signal will be confirmed
📊 MFI Filter (Cash Flow Index)
- What it does: analyzes volumes and the direction of price movement
- Why it is needed: confirms signals with data on the activity of cash flows
- How to set up:
- For buy signals (🔋 Buy): set the MFI range in the oversold zone (for example, 1-25)
- For sell signals (🪫 Sell): set the MFI range in the overbought zone (for example, 75-100)
- Example: if MFI = 80 (in the range of 75-100), the sell signal will be confirmed
📈 Stochastic Filter
- What it does: analyzes the position of the current price relative to the price range
- Why it is needed: confirms signals based on overbought/oversold conditions
- How to configure:
- You can configure the K Length, D Length and Smoothing parameters
- For buy signals (🔋 Buy): set the stochastic range in the oversold zone (for example, 1-20)
- For sell signals (🪫 Sell): set the stochastic range in the overbought zone (for example, 80-100)
- Example: if stochastic = 15 (is in the range of 1-20), the buy signal will be confirmed
🔌 Connecting to trading strategies
The indicator provides various connectors to connect to your trading strategies.:
1️⃣ Individual connectors for each type of signal
- 🔌Fast vs Slow Up/Down MA Signal🔌: signals for the intersection of fast and slow MA
- 🔌Fast vs Slow Greater/Less MA Signal🔌: signals of the ratio of fast and slow MA
- 🔌Fast Up/Down MA Signal🔌: signals of the intersection of price and fast MA
- 🔌Fast Greater/Less MA Signal🔌: signals of the ratio of price and fast MA
- 🔌Slow Up/Down MA Signal🔌: signals of the intersection of price and slow MA
- 🔌Slow Greater/Less MA Signal🔌: Price versus slow MA signals
2️⃣ Combined connectors
- 🔌Combined Up/Down MA Signal🔌: combines all the crossing signals (Up/Down)
- 🔌Combined Greater/Less MA Signal🔌: combines all the signals of the ratio (Greater/Less)
- 🔌Combined All MA Signals🔌: combines all signals (Up/Down and Greater/Less)
❗️ All connectors return values:
- 1: buy signal
- -1: sell signal
- 0: no signal
📚 How to start using AllMA Trend Radar
1️⃣ Selection of types of moving averages
- Add an indicator to the chart
- Select the type and period for the fast MA (default: DEMA with a period of 14)
- Select the type and period for the slow MA (default: SMA with a period of 14)
- Experiment with different types of MA to find the best combination for your trading style
2️⃣ Signal settings
- Turn on the desired signal types (Up/Down, Greater/Less)
- Set the minimum distance between the signals
- Activate and configure the necessary filters (RSI, MFI, Stochastic)
3️⃣ Checking on historical data
- Analyze how the indicator works based on historical data
- Pay attention to the accuracy of the signals and the presence of false alarms
- Adjust the settings if necessary
4️⃣ Introduction to the trading strategy
- Decide which signals will be used to enter the position.
- Determine which signals will be used to exit the position.
- Connect the indicator to your trading strategy through the appropriate connectors
🌟 Practical application examples
Scalping strategy
- Fast MA: TEMA with a period of 8
- Slow MA: EMA with a period of 21
- Active signals: Fast MA Up/Down
- Filters: RSI (range 1-40 for purchases, 60-100 for sales)
- Signal spacing: 3 bars
Strategy for day trading
- Fast MA: TEMA with a period of 10
- Slow MA: SMA with a period of 20
- Active signals: Fast MA Up/Down and Fast vs Slow Greater/Less
- Filters: MFI (range 1-25 for purchases, 75-100 for sales)
- Signal spacing: 5 bars
Swing Trading Strategy
- Fast MA: DEMA with a period of 14
- Slow MA: VWMA with a period of 30
- Active signals: Fast vs Slow Up/Down and Slow MA Greater/Less
- Filters: Stochastic (range 1-20 for purchases, 80-100 for sales)
- Signal spacing: 8 bars
A strategy for positional trading
- Fast MA: HMA with a period of 21
- Slow MA: SMA with a period of 50
- Active signals: Slow MA Up/Down and Fast vs Slow Greater/Less
- Filters: RSI and MFI at the same time
- The distance between the signals: 10 bars
💡 Tips for using AllMA Trend Radar
1. Select the types of MA for market conditions:
- For trending markets: DEMA, TEMA, HMA (fast MA)
- For sideways markets: SMA, WMA, VWMA (smoothed MA)
- For volatile markets: KAMA, AMA, VAMA (adaptive MA)
2. Combine different types of signals:
- Up/Down signals work better when moving from a sideways trend to a directional
one - Greater/Less signals are optimal for fixing a stable trend
3. Use filters effectively:
- The RSI filter works great in trending markets
- MFI filter helps to confirm the strength of volume movement
- Stochastic filter works well in lateral ranges
4. Adjust the minimum distance between the signals:
- Small values (2-3 bars) for short-term trading
- Average values (5-8 bars) for medium-term trading
- Large values (10+ bars) for long-term trading
5. Use combination connectors:
- For more reliable signals, connect the indicator through the combined connectors
💰 With the AllMA Trend Radar indicator, you get a universal trend analysis tool that can be customized for any trading style and timeframe. The combination of different types of moving averages and advanced filters allows you to significantly improve the accuracy of signals and the effectiveness of your trading strategy!
FeraTrading Breakout IndicatorThe FeraTrading Breakout Indicator is built for universal compatibility, working seamlessly across all tickers and timeframes. Its flexibility makes it suitable for a wide range of trading strategies and market conditions. The indicator is engineered to anticipate potential breakout opportunities by combining volatility filtering with dynamic support and resistance detection.
A distinct yellow line is plotted to represent key support or resistance zones when a breakout signal is generated. These levels help confirm directional bias and provide a visual anchor for potential entries or exits.
By combining volatility cues with structural price levels, this indicator offers traders a reliable tool for identifying trend initiation and momentum shifts with clarity and precision.
The user has the option in the indicators settings to display only the first signal of the day (Which is usually the strongest) or every signal of the day.

Liquidation ZonesIntroduction
The "Liquidation Zones" is a sophisticated TradingView indicator designed to assist cryptocurrency traders by highlighting potential liquidation levels for leveraged positions. It identifies price zones where liquidations are likely to occur for various leverage ratios—5x, 10x, 25x, 50x, and 100x—based on pivot points and volume analysis. This tool aims to help traders anticipate market movements driven by liquidations, offering insights into areas of risk or opportunity.
Key Features
Multi-Leverage Visualization: Plots liquidation zones for five leverage levels (5x, 10x, 25x, 50x, 100x), with individual toggles to show or hide each level.
Volume Filtering: Incorporates a customizable volume lookback period to ensure liquidation zones are displayed only during significant market activity.
Pivot-Based Calculations: Uses pivot highs and lows to pinpoint key price levels, forming the foundation for liquidation price estimates.
Customizable Appearance: Allows adjustment of line thickness and assigns unique colors to each leverage level for better visual distinction.
Interactive Dashboard: Features a semi-transparent table displaying the status of each leverage level, using filled (◉) or empty (○) circles to indicate activity.
How It Works
The indicator combines pivot point detection, volume conditions, and leverage-specific calculations to plot liquidation zones on the chart. Here’s a breakdown of its operation:
Pivot Points: Pivot highs and lows are calculated using ta.pivothigh and ta.pivotlow. The lookback and lookforward periods adjust dynamically based on the timeframe (e.g., 2 bars for daily/weekly/monthly, 3 bars otherwise), ensuring relevant support and resistance levels.
Volume Conditions: The check_volume_conditions function analyzes volume over a user-defined lookback period (default: 40 bars). It compares the average volume to a mean volume
threshold:
5x Leverage: Volume > mean volume.
10x Leverage: Volume ≥ 1.025 × mean volume.
25x Leverage: Volume ≥ 1.05 × mean volume.
50x Leverage: Volume ≥ 1.1 × mean volume.
100x Leverage: Volume ≥ 1.2 × mean volume.
These conditions filter out low-volume periods, focusing on impactful market activity.
Liquidation Price Calculation:
For each leverage level, liquidation prices are derived from pivot points and a risk percentage:
Long Liquidations (from pivot lows): pivot_low / (1 + risk_percent)
5x: 0.20, 10x: 0.10, 25x: 0.04, 50x: 0.02, 100x: 0.01
Short Liquidations (from pivot highs): pivot_high * (1 + risk_percent)
These prices represent where leveraged positions might be liquidated based on the leverage used.
Plotting Liquidation Zones: When volume conditions are met and the toggle is enabled, horizontal lines are drawn from the pivot point to the current bar at the calculated liquidation prices. Each leverage level has a distinct color (e.g., cyan for 5x, pink for 100x), with adjustable line thickness (default: 3). Lines persist until the price crosses them or the maximum line count (500) is reached.
Dashboard: A table on the chart’s middle-right displays each leverage level’s status. A filled circle (◉) appears when the volume condition is met and the level is active; an empty circle (○) indicates inactivity. The dashboard uses matching colors for clarity.
Time Filter: The indicator activates only after a user-defined start time (default: January 1, 2023), with a gray background displayed if the chart is outside this period.
Conclusion
The "Liquidation Zones | Opus" indicator is a valuable tool for traders navigating leveraged markets. By plotting liquidation zones tied to pivot points and filtered by volume, it highlights potential areas of price instability. Its flexibility—through toggles, visual settings, and the dashboard—makes it suitable for diverse trading strategies, from scalping to swing trading. Traders can use it to enhance risk management or identify liquidation-driven opportunities.
Disclaimer
This indicator is provided for informational and educational purposes only and does not constitute financial advice. Trading involves risk, and users should perform their own analysis before making decisions. The creator is not liable for any financial outcomes resulting from its use.

Fourier Smoothed Volume Zone OscillatorIntroduction
The "Fourier Smoothed Volume Zone Oscillator" is an advanced technical analysis tool designed for traders on the TradingView platform. Its primary purpose is to help traders identify overbought and oversold conditions in the market by analyzing volume and price data through a unique combination of Fourier smoothing and oscillator techniques. By leveraging the Fast Fourier Transform (FFT) to smooth the input data and integrating a dynamically adjusted Volume Zone Oscillator (VZO), this indicator provides clear visual signals for potential trend reversals and market extremes. It is particularly useful for traders looking to enhance their decision-making process with precise, noise-reduced signals in volatile or trending markets.
Key Features
Fourier Transform Smoothing: Utilizes the Fast Fourier Transform (FFT) to smooth the input data, reducing market noise and highlighting significant price movements.
Dynamic EMA Adjustment: Adjusts the smoothing period of the VZO based on market conditions, ensuring the oscillator remains responsive to changes in momentum.
White Noise Calculation: Incorporates Ehler's Universal Oscillator to filter out white noise, providing a cleaner signal for trend analysis.
Customizable Color Themes: Offers a variety of color schemes (e.g., Synthwave, Outrun, Lush) to suit user preferences and enhance visual clarity.
Overbought/Oversold Zone Visualization: Uses gradient-filled zones and optional arrow markers to clearly indicate overbought and oversold conditions on both the oscillator and price chart.
How It Works
The "Fourier Smoothed Volume Zone Oscillator" combines several advanced techniques to deliver a refined view of market conditions:
Fourier Transform (FFT): The indicator applies the FFT to the selected input source (default: close price) over a user-defined period (default: 3). This transformation smooths the data by extracting its frequency components, reducing short-term noise while preserving significant trends. The smoothed data is then processed using a rational quadratic kernel for further refinement.
White Noise Filtering: Using Ehler's Universal Oscillator, the indicator calculates a white noise component to filter out irrelevant price fluctuations. This helps isolate meaningful market movements and improves the accuracy of the VZO.
Volume Zone Oscillator (VZO): The VZO is calculated by comparing the weighted moving average of volume (adjusted by the sign of price changes) to the simple moving average of volume. This oscillator highlights periods of accumulation (positive values) and distribution (negative values). The VZO is further smoothed using a dynamically adjusted Exponential Moving Average (EMA), which adapts based on the alignment between the Universal Oscillator and the VZO's trend.
Dynamic Smoothing: The EMA length for smoothing the VZO is adjusted dynamically based on whether the Universal Oscillator and VZO are in agreement. When both indicators suggest the same market direction, the EMA length increases for smoother signals. When they diverge, the EMA length decreases to make the VZO more responsive to potential reversals.
Visual Representation: The indicator plots the VZO and its lagged version, with color changes indicating momentum shifts. Gradient-filled zones highlight overbought (default: above 60) and oversold (default: below -60) conditions. Users can choose to display either small arrow markers on the price chart or background color highlights to indicate these zones. Additionally, diamond-shaped markers on the VZO plot signal crossovers and crossunders, providing further insight into momentum changes.
These elements work together to offer traders a clear and actionable view of market conditions, helping them identify potential entry and exit points with greater confidence.
Conclusion
The "Fourier Smoothed Volume Zone Oscillator" is a powerful tool for traders seeking to navigate market extremes with precision. By combining Fourier smoothing, dynamic EMA adjustment, and white noise filtering, it delivers noise-reduced signals that are both clear and responsive. Its customizable visualizations—ranging from color themes to overbought/oversold indicators—make it adaptable to various trading styles and preferences. Whether used for identifying reversals in trending markets or spotting accumulation and distribution phases, this indicator provides valuable insights to support informed trading decisions.
Disclaimer
This indicator is provided for informational and educational purposes only and does not constitute financial advice. Trading involves significant risk, and users should conduct their own research and analysis before making any trading decisions. The creator of this indicator is not responsible for any financial losses or gains resulting from its use.
