Scalping Strategy with Fixed CooldownThis is a sample scalping strategy is designed for short-term trading on lower timeframes.
Entry Signals: Utilizes Hull Moving Average (HullMA) crossovers to generate buy and sell signals.
Filters:
-Bollinger Bands and RSI to avoid overbought or oversold conditions.
-VWAP to confirm trend direction, ensuring trades align with momentum.
Cooldown Mechanism: Implements a bar-based cooldown period to prevent immediate re-entries after trade closures, reducing the risk of overtrading.
Indicators and strategies

BollingerBands MTF | AlchimistOfCrypto🌌 Bollinger Bands – Unveiling Market Volatility Fields 🌌
"The Bollinger Bands, reimagined through quantum mechanics principles, visualizes the probabilistic distribution of price movements within a multi-dimensional volatility field. This indicator employs principles from wave function mathematics where standard deviation creates probabilistic boundaries, similar to electron cloud models in quantum physics. Our implementation features algorithmically enhanced visualization derived from extensive mathematical modeling, creating a dynamic representation of volatility compression and expansion cycles with adaptive glow effects that highlight the critical moments where volatility phase transitions occur."
📊 Professional Trading Application
The Bollinger Bands Quantum transcends traditional volatility measurement with a sophisticated gradient illumination system that reveals the underlying structure of market volatility fields. Scientifically calibrated for multiple timeframes and featuring eight distinct visual themes, it enables traders to perceive volatility contractions and expansions with unprecedented clarity.
⚙️ Indicator Configuration
- Volatility Field Parameters 📏
Python-optimized settings for specific market conditions:
- Period: 20 (default) - The quantum time window for volatility calculation
- StdDev Multiplier: 2.0 - The probabilistic boundary coefficient
- MA Type: SMA/EMA/VWMA/WMA/RMA - The quantum field smoothing algorithm
- Visual Theming 🎨
Eight scientifically designed visual palettes optimized for volatility pattern recognition:
- Neon (default): High-contrast green/red scheme enhancing volatility transition visibility
- Cyan-Magenta: Vibrant palette for maximum volatility boundary distinction
- Yellow-Purple: Complementary colors for enhanced compression/expansion detection
- Specialized themes (Green-Red, Forest Green, Blue Ocean, Orange-Red, Grayscale): Each calibrated for different market environments
- Opacity Control 🔍
- Variable transparency system (0-100) allowing seamless integration with price action
- Adaptive glow effect that intensifies during volatility phase transitions
- Quantum field visualization that reveals the probabilistic nature of price movements
🚀 How to Use
1. Select Visualization Parameters ⏰: Adjust period and standard deviation to match market conditions
2. Choose MA Type 🎚️: Select the appropriate smoothing algorithm for your trading strategy
3. Select Visual Theme 🌈: Choose a color scheme that enhances your personal pattern recognition
4. Adjust Opacity 🔎: Fine-tune visualization intensity to complement your chart analysis
5. Identify Volatility Phases ✅: Monitor band width to detect compression (pre-breakout) and expansion (trend)
6. Trade with Precision 🛡️: Enter during band contraction for breakouts, or trade mean reversion using band boundaries
7. Manage Risk Dynamically 🔐: Use band width as volatility-based position sizing parameter

LotusThis Pine Script is designed to plot multiple moving averages (SMA and EMA) on the chart, with dynamic color changes based on whether the price is above or below each moving average. The script includes customizable inputs for different SMA and EMA lengths, and each moving average has its own color scheme, which changes depending on the market price's position relative to the moving average.
Features:
Multiple Moving Averages:
SMA (Simple Moving Average) SELL: Configured with a default length of 22. This moving average is used for determining the "SELL" zone, and its color changes based on price action.
SMA (Simple Moving Average) CONTROL: Configured with a default length of 200. This moving average is a longer-term trend indicator used as a "control" reference. It’s color changes as well depending on price action.
SMA (Simple Moving Average) BUY: Configured with a default length of 50. This moving average acts as the "BUY" zone, where color changes help signal when price is above or below this moving average.
EMA (Exponential Moving Average): Configured with a default length of 13, which reacts more quickly to price changes compared to SMA. It’s plotted but hidden by default.
Dynamic Color Changes: Each moving average has two color states:
When the price is above the moving average, the color shifts to a positive tone, signaling potential buy signals.
When the price is below the moving average, the color turns negative, signaling potential sell or warning zones.
Colors used are:
SMA SELL: Green when above, Red when below.
SMA CONTROL: Blue when above, Red when below.
SMA BUY: Blue when above, Red when below.
EMA: Dark tone when above, Blue tone when below.
Customizable Inputs:
SMA 22 (SELL), SMA 200 (CONTROL), SMA 50 (BUY), and EMA 13 can be adjusted via the input panel to suit different trading strategies.
Source for calculations: The default source for all calculations is the close price.
Plotting and Visibility:
The SMA 22 and EMA 13 are hidden by default but can be revealed as per user preferences.
The SMA 200 and SMA 50 are visible by default for comparison.
How the Script Works:
Color Logic:
The moving averages are colored based on the position of the price relative to the moving average:
Green (Up trend): Price is above the moving average.
Red (Down trend): Price is below the moving average.
Blue (Neutral): For the SMA 50 and EMA, price is either neutral or ranging.
Dynamic Indicators:
The SMA SELL (22) helps traders spot short-term selling opportunities when the price is below this line.
The SMA CONTROL (200) helps gauge the long-term trend and acts as a control line.
The SMA BUY (50) is considered a neutral or buy zone, where the price is seen as more favorable for buying when above the line.
The EMA 13 reacts quickly to price changes, providing faster signals for traders looking for a more dynamic approach.
How to Use:
Trend Confirmation: Use the SMA 200 (Control line) for long-term trend confirmation.
Entry and Exit:
Buy: Look for price above the SMA 50 (BUY) and the SMA 22 (SELL) showing an uptrend.
Sell: Watch for price below the SMA 50 (BUY) or SMA 22 (SELL) indicating a possible downtrend or a selling opportunity.
EMA 13: Acts as a faster, more responsive trend indicator that can be used for shorter time-frame trades.
Example:
SMA SELL (22): The green line suggests potential buying opportunities when the price is above it. The red line suggests possible selling when the price is below.
SMA CONTROL (200): This acts as the primary trend indicator. If the price is above this, the long-term trend is bullish. If the price is below, the long-term trend is bearish.
SMA BUY (50): When the price is above this line, it indicates a favorable buying zone. When the price is below it, it suggests a potential bearish move.
EMA 13: Often used for short-term trades, especially when the price is moving quickly either above or below it.
Customization:
You can adjust the lengths of the SMA SELL, SMA CONTROL, SMA BUY, and EMA based on your personal strategy or trading style.
Modify the colors of each moving average line to better suit your chart preferences.
This script is suitable for traders looking to combine trend-following and short-term trading strategies using moving averages. It allows for an adaptable approach with visual cues based on the price's relationship with key moving averages.

AI Trading Signals - Crypto, Stocks & Forex🧠 AI Trading Signals – Layered Confirmation System for Crypto, Stocks & Forex
The AI Trading Signals Indicator is a proprietary, closed-source script that helps traders identify structured trade setups by combining trend analysis, momentum filtering, and breakout confirmation across multiple timeframes.
This system is designed to eliminate guesswork by layering multiple validated conditions into one modular framework, helping traders adapt to a wide range of market environments.
Multi-layer trend bias detection
Momentum exhaustion and continuation filtering
Breakout zone mapping and structure validation
Bitcoin macro cycle tracking
Multi-timeframe signal confirmation (optional)
🔍 How It Works (Core Logic Overview)
Signals are only generated when multiple technical layers align:
EMA stacking (20/50/200) defines the primary directional bias
RSI combined with VWAP detects momentum exhaustion or continuation
Trend channel bands map dynamic support/resistance breakout zones
LC (Long Continuation) and SC (Short Continuation) signals validate breakout structure using price action and momentum shifts
BTC macro cycle detection based on 111-Day and 350-Day moving averages identifies longer-term tops and bottoms
Optional Multi-Timeframe filtering ensures entries on lower timeframes (1m/3m/15m) only trigger if the higher timeframe (15m/45m/4H/1D) bias confirms
No signals are based on a single condition — all trade triggers require cross-confirmation between trend, momentum, and price structure.
🎯 Strategy Modes
Users can choose a strategy that aligns with their trading goals directly from the Inputs tab.
Buy & Sell Confirmation Mode
Long Positions Only Mode
Short Positions Only Mode
Breakout Continuation Mode (LC/SC logic)
BTC Macro Cycle Mode (Bull/Bear Seasons, BTC Top Detection)
⚙️ Customization & Features
The system is modular, allowing users to configure their chart and alerts to match their style.
Toggle specific signals: Buy, Sell, TP, SL, LC, SC, Exit Long, Exit Short
Enable Multi-Timeframe Signal Dashboard (visual tracker from 3m to 1D)
Intraday Breakout Feature: Dynamic high/low levels from the largest 15m candle
Visual filtering for cleaner, non-cluttered charts
Adjustable Take Profit and Stop Loss levels based on asset behavior
🧠 What Makes This Script Unique
Unlike simple indicator mashups, the AI Trading Signals system:
Requires multiple layers of condition validation before confirming signals
Integrates directional bias + momentum exhaustion + breakout structure
Offers real-time intraday breakout levels with dynamic TP/SL handling
Uses proprietary Bitcoin macro cycle detection unavailable in public libraries
Built for real-world usability with user-centered modular design
This tool is designed for discretionary traders who want confirmation-based decision making , not raw signal automation.
📌 How to Use It:
Use this system to layer signals for higher-probability trade setups. Select a strategy mode, customize your chart view, and align multiple confirmations where possible.
Select your desired strategy mode
Enable or disable visual layers in the Style tab
Optionally use Multi-Timeframe filtering for more precise entries
Set alerts based on your strategy (Buy, Sell, TP, SL, LC, SC, BTC cycle shifts)
Use the Intraday Breakout levels to track daily momentum shifts
For best results, use multiple signal layers together — trend bias, momentum confirmation, and breakout structure — to increase trade confidence and filter weaker setups.
⚠️ Disclaimer
This script is for educational and informational purposes only. It does not constitute financial advice or imply guaranteed results. Trading involves significant risk — use at your own discretion.

Real True Value Adjusted - Saygın/IchizoOption
CPI = Inflation-adjusted asset price (CPI only)
M2= Money supply adjusted asset price (M2 only)
CPI + M2= Inflation + Money Printing adjusted price (very pure)
Gold Asset price compared to Gold price (XAUUSD)
None Original raw asset price
Works on ANY asset (coin, stock, forex) automatically.
Recommended timeframe: 4H, 1D, 1W (because CPI and M2 are monthly updated).
Extremely rare and powerful perspective for true valuation.

EMA20/50/100/200 with extended lines and labels by TradeCrafted📈 EMA20/50/100/200 with Extended Lines and Labels by TradeCrafted
Overview
This script plots four key Exponential Moving Averages (EMAs) — 20, 50, 100, and 200 — directly on the chart for enhanced trend visualization.
In addition to the standard plots, it extends each EMA forward with a projected line, helping traders anticipate potential future dynamic support and resistance zones.
Clear, color-coded labels are attached to each EMA, updating live to improve chart readability without clutter.
This tool is designed for educational and informational purposes only and does not provide financial advice or guaranteed trading results.
✨ Features
Plots EMA 20, EMA 50, EMA 100, and EMA 200 in distinct colors.
Extends each EMA line forward by a user-defined number of bars.
Dynamic floating labels show the EMA name and live value.
Minimalistic and clean design, ideal for all trading styles.
Open-source and customizable for user transparency.
📚 Usage
Use this indicator to:
Identify overall market trends across different timeframes.
Spot potential areas of dynamic support and resistance.
Observe EMA crossovers for possible trend shifts.
⚠️ Disclaimer
This script is intended for educational and informational purposes only.
It does not constitute financial advice or a recommendation to buy or sell any asset.
Always perform your own analysis before making trading decisions.
Sharpe & Sortino Ratio PROSharpe & Sortino Ratio PRO offers an advanced and more precise way to calculate and visualize the Sharpe and Sortino Ratios for financial assets on TradingView. Its main goal is to provide a scientifically accurate method for assessing the risk-adjusted performance of assets, both in the short and long term. Unlike TradingView’s built-in metrics, this script correctly handles periodic returns, uses optional logarithmic returns, properly annualizes both returns and volatility, and adjusts for the risk-free rate — all critical factors for truly meaningful Sharpe and Sortino calculations.
Users can customize the rolling analysis window (e.g., 252 periods for one year on daily data) and the long-term smoothing period (e.g., 1260 periods for five years). There’s also an option to select between linear and logarithmic returns and to manually input a risk-free rate if real-time data from FRED (the 3-Month T-Bill Rate via FRED:DGS3MO) is unavailable. Based on the chart’s timeframe (daily, weekly, or monthly), the script automatically adjusts the risk-free rate to a per-period basis.
The Sharpe Ratio is calculated by first determining the asset’s excess returns (returns after subtracting the risk-free return per period), then computing the average and standard deviation of those excess returns over the specified window, and finally annualizing these figures separately — in line with best scientific practices (Sharpe, 1994). The Sortino Ratio follows a similar approach but only considers negative returns, focusing specifically on downside risk (Sortino & Van der Meer, 1991).
To enhance readability, the script visualizes the ratios using a color gradient: strong negative values are shown in red, neutral values in yellow, and strong positive values in green. Additionally, the long-term averages for both Sharpe and Sortino are plotted with steady colors (teal and orange, respectively), making it easier to spot enduring performance trends.
Why calculating Sharpe and Sortino Ratios manually on TradingView is necessary?
While TradingView provides basic Sharpe and Sortino Ratios, they come with significant methodological flaws that can lead to misleading conclusions about an asset’s true risk-adjusted performance.
First, TradingView often computes volatility based on the standard deviation of price levels rather than returns (TradingView, 2023). This method is problematic because it causes the volatility measure to be directly dependent on the asset’s absolute price. For instance, a stock priced at $1,000 will naturally show larger absolute daily price moves than a $10 stock, even if their percentage changes are similar. This artificially inflates the measured standard deviation and, as a result, depresses the calculated Sharpe Ratio.
Second, TradingView frequently neglects to adjust for the risk-free rate. By treating all returns as risky returns, the computed Sharpe Ratio may significantly underestimate risk-adjusted performance, especially when interest rates are high (Sharpe, 1994).
Third, and perhaps most critically, TradingView doesn’t properly annualize the mean excess return and the standard deviation separately. In correct financial math, the mean excess return should be multiplied by the number of periods per year, while the standard deviation should be multiplied by the square root of the number of periods per year (Cont, 2001; Fabozzi et al., 2007). Incorrect annualization skews the Sharpe and Sortino Ratios and can lead to under- or overestimating investment risk.
These flaws lead to three major issues:
• Overstated volatility for high-priced assets.
• Incorrect scaling between returns and risk.
• Sharpe Ratios that are systematically biased downward, especially in high-price or high-interest environments.
How to properly calculate Sharpe and Sortino Ratios in Pine Script?
To get accurate results, the Sharpe and Sortino Ratios must be calculated using the correct methodology:
1. Use returns, not price levels, to calculate volatility. Ideally, use logarithmic returns for better mathematical properties like time additivity (Cont, 2001).
2. Adjust returns by subtracting the risk-free rate on a per-period basis to obtain true excess returns.
3. Annualize separately:
• Multiply the mean excess return by the number of periods per year (e.g., 252 for daily data).
• Multiply the standard deviation by the square root of the number of periods per year.
4. Finally, divide the annualized mean excess return by the annualized standard deviation to calculate the Sharpe Ratio.
The Sortino Ratio follows the same structure but uses downside deviations instead of standard deviations.
By following this scientifically sound method, you ensure that your Sharpe and Sortino Ratios truly reflect the asset’s real-world risk and return characteristics.
References
• Cont, R. (2001). Empirical properties of asset returns: stylized facts and statistical issues. Quantitative Finance, 1(2), pp. 223–236.
• Fabozzi, F.J., Gupta, F. and Markowitz, H.M. (2007). The Legacy of Modern Portfolio Theory. Journal of Investing, 16(3), pp. 7–22.
• Sharpe, W.F. (1994). The Sharpe Ratio. Journal of Portfolio Management, 21(1), pp. 49–58.
• Sortino, F.A. and Van der Meer, R. (1991). Downside Risk: Capturing What’s at Stake in Investment Situations. Journal of Portfolio Management, 17(4), pp. 27–31.
• TradingView (2023). Help Center - Understanding Sharpe and Sortino Ratios. Available at: www.tradingview.com (Accessed: 25 April 2025).


Trendinator## How to Use Trendy: A Trader's Guide
Hey there, fellow trader! Let's talk about how to actually use this Trendy indicator in your day-to-day trading. I've been working with this tool, and I want to share some practical insights that you won't find in the technical documentation.
### Getting Started
First things first, don't get overwhelmed by all the settings. Start simple:
1. **Add it to your chart** - Load up the indicator and just observe how the baseline moves with price for a few days before making any trading decisions.
2. **Watch the color changes** - Green/lime (or whatever you choose) means uptrend, red means downtrend. Simple as that!
3. **Look for crossovers** - When price crosses above the line, it's often a buy signal. When it crosses below, consider it a potential sell.
### Fixed vs. Adaptive Mode: Which One's Better?
Here's the thing about these two modes - they're both useful in different situations.
**Fixed Mode** is straightforward and reliable. It uses the length you specify, and that's it. I like to use Fixed Mode when:
- The market is clearly trending
- I want consistent signals without surprises
- I'm doing comparisons across multiple charts or timeframes
**Adaptive Mode** It automatically adjusts the length based on what the market is actually doing right now. This mode shines when:
- Markets are changing their behavior
- You're trading assets with variable volatility
- You want the indicator to "learn" the current market rhythm
### The Dual Approach (My Secret Suggestion)
Want to know what really works for me? I put BOTH on my chart. Seriously, try this:
1. Add Trendy in Fixed Mode (I usually use the "Medium" settings from the table)
2. Add a second Trendy in Adaptive Mode
3. When both lines agree on direction - that's a strong signal!
4. When they diverge - be cautious, the market might be changing character
When both lines cross price at the same time, that's often where the magic happens. Those are the high-probability entries you're looking for.
### Real Talk About Timeframes
Let me break down how this indicator feels on different timeframes:
**5-Minute Charts** - It's twitchy! Use "Slow" settings unless you're scalping. The Fixed mode actually works better here because the adaptive can get confused by noise.
**15-Minute Charts** - My personal favorite for day trading. The "Medium" settings strike a nice balance. The Adaptive mode starts becoming really valuable here.
**Hourly Charts** - This is where Trendy really shines. The indicator has enough data to work with but still responds quickly to changes. I lean more toward the "Fast" or "Medium" settings here.
**4-Hour & Daily** - Perfect for swing trading. Use "Medium" or "Slow" settings, and definitely take advantage of the Adaptive mode - it picks up those larger market cycles beautifully.
### Comparing Fixed vs. Adaptive Performance
Here's a comparison I've put together based on my own trading experience:
| Market Condition | Fixed Mode Performance | Adaptive Mode Performance | Best Choice |
|------------------|------------------------|---------------------------|-------------|
| Strong Trend | Excellent ⭐⭐⭐⭐⭐ | Very Good ⭐⭐⭐⭐ | Fixed |
| Choppy Market | Poor ⭐⭐ | Good ⭐⭐⭐⭐ | Adaptive |
| Breakouts | Good ⭐⭐⭐⭐ | Excellent ⭐⭐⭐⭐⭐ | Adaptive |
| Range-Bound | Poor ⭐⭐ | Good ⭐⭐⭐ | Adaptive |
| High Volatility | Very Good ⭐⭐⭐⭐ | Excellent ⭐⭐⭐⭐⭐ | Adaptive |
| Low Volatility | Good ⭐⭐⭐ | Good ⭐⭐⭐ | Either |
| Trend Reversals | Poor ⭐⭐ | Very Good ⭐⭐⭐⭐ | Adaptive |
### Pro Tips From the Trenches
1. **Start with the 1-Hour chart** - If you're new to Trendy, the hourly timeframe gives you the best balance between signal quality and trading frequency.
2. **Color-code your indicators** - If you're using both Fixed and Adaptive, give them different colors so you can tell them apart at a glance. I use lime/red for Fixed and blue/orange for Adaptive.
3. **Don't fight the line** - If price is below the line, think twice about going long, even if other indicators say otherwise. This baseline is surprisingly powerful as a dynamic support/resistance level.
4. **Watch for flattening** - When the line starts to flatten after a strong trend, that's often a sign that momentum is waning. Consider taking profits.
5. **Use the crossover, confirm with a retest** - The most reliable setup is when price crosses the line, pulls back to "test" it, and then continues in the new direction.
6. **Adjust for different assets** - Cryptocurrencies and tech stocks often need "Faster" settings, while forex and blue chips do better with "Medium" or "Slow" settings.
7. **Combine with volume** - Trendy doesn't look at volume, so adding a volume indicator can really complete the picture. Strong moves with high volume that push through the baseline are often the most reliable.
Remember, no indicator is perfect - but Trendy is one of the most versatile tools I've used. Give yourself some time to get familiar with how it behaves on your favorite trading instruments, and you'll develop an almost intuitive feel for it.
Happy trading!# Trendy - Technical Documentation
__________________________________________________________________________
## Overview
The Trendy indicator represents a significant advancement in technical analysis, combining Mark Jurik's proprietary JMA (Jurik Moving Average) algorithm with adaptive volatility measurement and autocorrelation-based cycle detection. This sophisticated indicator provides traders with a responsive, low-lag baseline that adapts to changing market conditions in real-time.
Unlike traditional moving averages that suffer from lag and noise issues, Trendy dynamically adjusts its parameters to optimize smoothness and responsiveness based on the current market environment. The baseline serves as a clear reference point for trend direction, potential support/resistance levels, and market regime identification.
## Technical Foundation
### Jurik Moving Average (JMA)
The core of this indicator is the JMA algorithm, developed by Mark Jurik as a superior alternative to traditional moving averages. The JMA reduces lag while minimizing noise, making it a valuable asset for traders. It employs:
- **Advanced smoothing algorithms**: Eliminates market noise without introducing significant lag
- **Phase correction**: Adjusts the leading/lagging behavior of the moving average
- **Adaptive parameters**: Automatically tunes to current market conditions
The JMA delivers a smooth line with very little delay compared to traditional moving averages like SMA or EMA, providing clearer signals for effective market analysis.
### Volatility-Adaptive Power
What makes this implementation unique is the integration of volatility measurements to dynamically adjust the JMA's behavior:
- **ATR-Normalized Volatility**: Uses Average True Range measurements that are normalized to provide a reliable volatility metric
- **Dynamic Power Factor**: Adjusts the JMA's power parameter based on current volatility
- **Adaptive Smoothing**: Increases smoothing during noisy, ranging markets and increases responsiveness during trending conditions
This volatility adaptation enables the indicator to adapt to market conditions in real-time, providing traders with a more accurate and timely tool for assessing trends.
### Autocorrelation Periodogram Algorithm (APA)
In "Autocorrelation Adaptive" mode, the indicator employs John Ehlers' Autocorrelation Periodogram Algorithm to detect the dominant market cycle:
- Uses digital signal processing techniques to determine the length of market cycles
- Calculates correlation coefficients between the current price and lagged versions of itself
- Identifies the dominant cycle period in the current market conditions
- Dynamically adjusts the indicator's length parameter based on detected cycles
This adaptive approach attempts to reveal dominant cycles in market data and measure their amplitude, allowing the indicator to automatically tune itself to the current market rhythm.
## Practical Applications
### 1. Trend Identification
The baseline provides clear trend signals through its color and direction:
- **Green/Lime Baseline**: Indicates uptrend with bullish momentum
- **Red Baseline**: Indicates downtrend with bearish momentum
### 2. Dynamic Support and Resistance
The baseline often serves as a dynamic support/resistance level:
- During uptrends, price tends to find support at the baseline
- During downtrends, the baseline frequently acts as resistance
- Stronger reactions often occur when price approaches the baseline in the direction of the larger trend
### 3. Market Regime Detection
The slope and characteristics of the baseline help identify market conditions:
- **Steep slope**: Strong trending market
- **Moderate slope**: Normal trending conditions
- **Flat baseline**: Consolidation or range-bound market
- **Oscillating baseline**: Choppy, indecisive market
### 4. Entry and Exit Points
Price interactions with the baseline can provide potential trading signals:
- **Price crossing above baseline**: Potential buy signal
- **Price crossing below baseline**: Potential sell signal
- **Failed tests of the baseline**: Potential continuation signals
- **Multiple crosses in short period**: Warning of choppy conditions
### 5. Volatility Assessment
The behavior of the baseline relative to price action provides insights about volatility:
- **Price hugging the baseline**: Low volatility, strong trend
- **Price making wide swings around baseline**: Higher volatility
- **Price making higher highs while baseline flattens**: Possible trend exhaustion
## Recommended Settings by Timeframe
The table below provides optimized settings for different timeframes and trading styles:
| Timeframe | Trading Style | Length | Phase | Min Length | Max Length | Avg Length |
|-----------|--------------|--------|-------|------------|------------|------------|
| 5 Minute | Fast | 14 | 0 | 6 | 24 | 2 |
| 5 Minute | Medium | 21 | 0 | 8 | 32 | 3 |
| 5 Minute | Slow | 30 | 0 | 12 | 48 | 3 |
| 15 Minute | Fast | 10 | 0 | 5 | 20 | 2 |
| 15 Minute | Medium | 18 | 0 | 7 | 28 | 3 |
| 15 Minute | Slow | 27 | 0 | 10 | 40 | 3 |
| 30 Minute | Fast | 8 | 0 | 4 | 16 | 2 |
| 30 Minute | Medium | 14 | 0 | 6 | 24 | 3 |
| 30 Minute | Slow | 21 | 0 | 8 | 32 | 3 |
| 1 Hour | Fast | 7 | 0 | 3 | 14 | 2 |
| 1 Hour | Medium | 12 | 0 | 5 | 20 | 2 |
| 1 Hour | Slow | 18 | 0 | 7 | 28 | 3 |
| 4 Hour | Fast | 5 | 0 | 3 | 10 | 1 |
| 4 Hour | Medium | 8 | 0 | 4 | 16 | 2 |
| 4 Hour | Slow | 14 | 0 | 6 | 24 | 2 |
*Notes:*
- **Fast**: More responsive to price changes, better for scalping and short-term trading
- **Medium**: Balanced approach suitable for swing trading
- **Slow**: More smoothed, better for position trading and longer-term trend following
- When using "Autocorrelation Adaptive" mode, the Min/Max/Avg Length parameters control the adaptive algorithm's behavior
## Advanced Trading Strategies
### 1. Multi-Timeframe Confirmation
For stronger signals, compare the Trendy baseline across multiple timeframes:
- Align trades with the direction of higher timeframe baselines
- Look for confluences where multiple timeframes show the same signal
- Use lower timeframes for precise entry while following higher timeframe trends
### 2. Volatility-Based Position Sizing
Adjust position sizes based on the relationship between price and the baseline:
- Larger positions when price is moving strongly in the direction of the baseline
- Smaller positions during consolidation periods or when the baseline is flat
- Consider reducing exposure when price makes multiple crosses of the baseline in a short period
### 3. Trend Strength Assessment
The baseline's behavior provides insights about trend strength:
- Strong trends show a consistent baseline direction with minimal flattening
- Weakening trends often show a flattening baseline before price reversal
- Baseline slope changes can provide early warning of potential trend shifts
### 4. Combining with Other Indicators
The Trendy works well when combined with complementary indicators:
- Momentum oscillators to confirm overbought/oversold conditions
- Volume indicators to validate price movements
- Volatility indicators to adjust strategy parameters dynamically
## Technical Implementation
The Trendy is built on several sophisticated algorithms:
1. **JMA Algorithm**: Provides the core smoothing functionality with adaptive parameters
2. **Volatility Measurement**: Uses ATR-based calculations normalized to current price levels
3. **Autocorrelation Periodogram**: Implements spectral analysis techniques to identify dominant market cycles
4. **Dynamic Parameter Adjustment**: Automatically tunes the indicator based on current market conditions
The implementation uses optimized calculations to ensure accuracy while maintaining computational efficiency, making it suitable for real-time trading environments.
## Conclusion
The Trendy represents a significant advancement in technical analysis tools, providing traders with a sophisticated yet practical indicator for market analysis. By combining the low-lag properties of the Jurik Moving Average with adaptive volatility measurement and cycle detection, it offers a responsive and reliable baseline for identifying trends, market regimes, and potential trading opportunities.
The indicator's ability to automatically adapt to changing market conditions makes it valuable across different timeframes and market environments, providing consistent performance where traditional moving averages often fail. Whether used as a standalone tool or as part of a comprehensive trading system, the Trendy delivers professional-grade technical analysis capabilities for modern traders.
# Adaptive Jurik Baseline (AJB) - Technical Documentation
## Overview
The Adaptive Jurik Baseline (AJB) indicator represents a significant advancement in technical analysis, combining Mark Jurik's proprietary JMA (Jurik Moving Average) algorithm with adaptive volatility measurement and autocorrelation-based cycle detection. This sophisticated indicator provides traders with a responsive, low-lag baseline that adapts to changing market conditions in real-time.
Unlike traditional moving averages that suffer from lag and noise issues, AJB dynamically adjusts its parameters to optimize smoothness and responsiveness based on the current market environment. The baseline serves as a clear reference point for trend direction, potential support/resistance levels, and market regime identification.
## Technical Foundation
### Jurik Moving Average (JMA)
The core of this indicator is the JMA algorithm, developed by Mark Jurik as a superior alternative to traditional moving averages. The JMA reduces lag while minimizing noise, making it a valuable asset for traders. It employs:
- **Advanced smoothing algorithms**: Eliminates market noise without introducing significant lag
- **Phase correction**: Adjusts the leading/lagging behavior of the moving average
- **Adaptive parameters**: Automatically tunes to current market conditions
The JMA delivers a smooth line with very little delay compared to traditional moving averages like SMA or EMA, providing clearer signals for effective market analysis.
### Volatility-Adaptive Power
What makes this implementation unique is the integration of volatility measurements to dynamically adjust the JMA's behavior:
- **ATR-Normalized Volatility**: Uses Average True Range measurements that are normalized to provide a reliable volatility metric
- **Dynamic Power Factor**: Adjusts the JMA's power parameter based on current volatility
- **Adaptive Smoothing**: Increases smoothing during noisy, ranging markets and increases responsiveness during trending conditions
This volatility adaptation enables the indicator to adapt to market conditions in real-time, providing traders with a more accurate and timely tool for assessing trends.
### Autocorrelation Periodogram Algorithm (APA)
In "Autocorrelation Adaptive" mode, the indicator employs John Ehlers' Autocorrelation Periodogram Algorithm to detect the dominant market cycle:
- Uses digital signal processing techniques to determine the length of market cycles
- Calculates correlation coefficients between the current price and lagged versions of itself
- Identifies the dominant cycle period in the current market conditions
- Dynamically adjusts the indicator's length parameter based on detected cycles
This adaptive approach attempts to reveal dominant cycles in market data and measure their amplitude, allowing the indicator to automatically tune itself to the current market rhythm.
## Practical Applications
### 1. Trend Identification
The baseline provides clear trend signals through its color and direction:
- **Green/Lime Baseline**: Indicates uptrend with bullish momentum
- **Red Baseline**: Indicates downtrend with bearish momentum
### 2. Dynamic Support and Resistance
The baseline often serves as a dynamic support/resistance level:
- During uptrends, price tends to find support at the baseline
- During downtrends, the baseline frequently acts as resistance
- Stronger reactions often occur when price approaches the baseline in the direction of the larger trend
### 3. Market Regime Detection
The slope and characteristics of the baseline help identify market conditions:
- **Steep slope**: Strong trending market
- **Moderate slope**: Normal trending conditions
- **Flat baseline**: Consolidation or range-bound market
- **Oscillating baseline**: Choppy, indecisive market
### 4. Entry and Exit Points
Price interactions with the baseline can provide potential trading signals:
- **Price crossing above baseline**: Potential buy signal
- **Price crossing below baseline**: Potential sell signal
- **Failed tests of the baseline**: Potential continuation signals
- **Multiple crosses in short period**: Warning of choppy conditions
### 5. Volatility Assessment
The behavior of the baseline relative to price action provides insights about volatility:
- **Price hugging the baseline**: Low volatility, strong trend
- **Price making wide swings around baseline**: Higher volatility
- **Price making higher highs while baseline flattens**: Possible trend exhaustion
## Recommended Settings by Timeframe
The table below provides optimized settings for different timeframes and trading styles:
| Timeframe | Trading Style | Length | Phase | Min Length | Max Length | Avg Length |
|-----------|--------------|--------|-------|------------|------------|------------|
| 5 Minute | Fast | 14 | 0 | 6 | 24 | 2 |
| 5 Minute | Medium | 21 | 0 | 8 | 32 | 3 |
| 5 Minute | Slow | 30 | 0 | 12 | 48 | 3 |
| 15 Minute | Fast | 10 | 0 | 5 | 20 | 2 |
| 15 Minute | Medium | 18 | 0 | 7 | 28 | 3 |
| 15 Minute | Slow | 27 | 0 | 10 | 40 | 3 |
| 30 Minute | Fast | 8 | 0 | 4 | 16 | 2 |
| 30 Minute | Medium | 14 | 0 | 6 | 24 | 3 |
| 30 Minute | Slow | 21 | 0 | 8 | 32 | 3 |
| 1 Hour | Fast | 7 | 0 | 3 | 14 | 2 |
| 1 Hour | Medium | 12 | 0 | 5 | 20 | 2 |
| 1 Hour | Slow | 18 | 0 | 7 | 28 | 3 |
| 4 Hour | Fast | 5 | 0 | 3 | 10 | 1 |
| 4 Hour | Medium | 8 | 0 | 4 | 16 | 2 |
| 4 Hour | Slow | 14 | 0 | 6 | 24 | 2 |
*Notes:*
- **Fast**: More responsive to price changes, better for scalping and short-term trading
- **Medium**: Balanced approach suitable for swing trading
- **Slow**: More smoothed, better for position trading and longer-term trend following
- When using "Autocorrelation Adaptive" mode, the Min/Max/Avg Length parameters control the adaptive algorithm's behavior
## Advanced Trading Strategies
### 1. Multi-Timeframe Confirmation
For stronger signals, compare the AJB baseline across multiple timeframes:
- Align trades with the direction of higher timeframe baselines
- Look for confluences where multiple timeframes show the same signal
- Use lower timeframes for precise entry while following higher timeframe trends
### 2. Volatility-Based Position Sizing
Adjust position sizes based on the relationship between price and the baseline:
- Larger positions when price is moving strongly in the direction of the baseline
- Smaller positions during consolidation periods or when the baseline is flat
- Consider reducing exposure when price makes multiple crosses of the baseline in a short period
### 3. Trend Strength Assessment
The baseline's behavior provides insights about trend strength:
- Strong trends show a consistent baseline direction with minimal flattening
- Weakening trends often show a flattening baseline before price reversal
- Baseline slope changes can provide early warning of potential trend shifts
### 4. Combining with Other Indicators
The AJB works well when combined with complementary indicators:
- Momentum oscillators to confirm overbought/oversold conditions
- Volume indicators to validate price movements
- Volatility indicators to adjust strategy parameters dynamically
## Technical Implementation
The Adaptive Jurik Baseline is built on several sophisticated algorithms:
1. **JMA Algorithm**: Provides the core smoothing functionality with adaptive parameters
2. **Volatility Measurement**: Uses ATR-based calculations normalized to current price levels
3. **Autocorrelation Periodogram**: Implements spectral analysis techniques to identify dominant market cycles
4. **Dynamic Parameter Adjustment**: Automatically tunes the indicator based on current market conditions
The implementation uses optimized calculations to ensure accuracy while maintaining computational efficiency, making it suitable for real-time trading environments.
## Conclusion
The Adaptive Jurik Baseline represents a significant advancement in technical analysis tools, providing traders with a sophisticated yet practical indicator for market analysis. By combining the low-lag properties of the Jurik Moving Average with adaptive volatility measurement and cycle detection, it offers a responsive and reliable baseline for identifying trends, market regimes, and potential trading opportunities.
The indicator's ability to automatically adapt to changing market conditions makes it valuable across different timeframes and market environments, providing consistent performance where traditional moving averages often fail. Whether used as a standalone tool or as part of a comprehensive trading system, the Adaptive Jurik Baseline delivers professional-grade technical analysis capabilities for modern traders.

Pi Cycle | AlchimistOfCrypto Pi Cycle Top Indicator - A Powerful Market Phase Detector
Developed by AlchimistOfCrypto
🧪 The Pi Cycle uses mathematical harmony to identify Bitcoin market cycle tops
with remarkable precision. Just as elements react at specific temperatures,
Bitcoin price behaves predictably when these two moving averages converge! 🧬
⚗️ The formula measures when the 111-day SMA crosses below the 350-day SMA × 2,
creating a perfect alchemical reaction that has successfully identified the
major cycle tops in 2013, 2017, and 2021.
🔬 Like the Golden Ratio in nature, this indicator reveals the hidden
mathematical structure within Bitcoin's chaotic price movements.
🧮 When the reaction occurs, prepare for molecular breakdown! 🔥


Day Trading NR4/NR7 + 2BarNR/3BarNR + ID + MomentumDay Trading Version: The High-Precision Momentum Setup
The Day Trading Version of this strategy is designed for traders who need quick, high-probability setups that work in real-time throughout the trading day. It’s a dynamic approach that blends classic price compression patterns with crucial intraday filters like VWAP and MACD, ensuring you’re only executing trades when everything lines up for success.
Price Compression: Focuses on NR4, NR7, and Inside Day patterns, offering clear signals when stocks are in tight ranges—ideal for a breakout or breakdown. These setups identify periods of compression that often precede explosive moves.
Trend Alignment: Price must be above the 20 EMA, with the 10 EMA above the 20 EMA, confirming a trend that's worthy of entering. These filters keep you on the right side of the market, ensuring you’re trading in the direction of momentum.
VWAP Filter: The price must be above VWAP for long trades, keeping you in sync with intraday institutional flow. This ensures you're aligning with the market’s overall bias.
MACD Confirmation: The fast MACD line needs to be at least 5% above or below the slow line, ensuring that the trade has sufficient momentum. For long trades, the MACD must be positive, confirming upward strength.
This strategy is built for momentum-focused traders who thrive on fast action and want to capture intraday volatility. Perfect for day traders who need to identify reliable setups on the fly, with clear rules and filters that make entering and exiting positions easier than ever.

Most Volume Candle LevelsThe script finds the candlestick with the maximum volume in the specified period (20 bars by default).
Draws levels on high and low of this candlestick.
You can set the color of the lines (yellow by default).

Relative Volume CandlesVisualizes candlesticks with transparency based on volume relative to a moving average. Higher-than-average volume makes candles more opaque, while lower volume increases transparency—helping you spot significant price movements at a glance!
Features:
Customizable up/down candle colors (default: green/red)
Adjustable lookback period for volume averaging (default: 21)
Fine-tune transparency with base transparency (default: 80) and scale (default: 2.0)
Overlay directly on your chart for seamless analysis

CM RSI-Stoch Hybrid D&K%CM RSI-Stoch Hybrid D&K% Indicator
Elevate your trading strategy with the CM RSI-Stoch Hybrid D&K% Indicator, a powerful and versatile tool designed for Trading View. This innovative indicator seamlessly blends the strengths of the Relative Strength Index (RSI) and Stochastic oscillator to deliver a unique composite signal that captures market momentum and trend dynamics with precision. Ideal for traders of all levels, it offers customizable settings and visually intuitive outputs to enhance decision-making across various markets and timeframes.
Key Features:
Hybrid Composite Signal: Combines RSI and Stochastic (%K and %D) into a single, smoothed indicator for a balanced view of market conditions, reducing noise and highlighting key trends.
Dynamic Volume Integration: Adjusts the composite signal’s appearance based on volume surges, helping traders identify high-conviction moves.
Customizable Moving Average: Choose from SMA, EMA, or WMA to overlay on the composite signal, providing additional trend confirmation tailored to your trading style.
Overbought/Oversold Zones: Clearly defined, user-adjustable levels with visual background cues to spot potential reversals or continuation patterns.
Multi-Indicator Visualization: Displays RSI, Stochastic %K, %D, and the composite signal in a single, easy-to-read panel, keeping your charts uncluttered.
Flexible Parameters: Fine-tune RSI length, Stochastic smoothing, volume MA, and overbought/oversold thresholds to suit your preferred trading approach.
Why Choose CM RSI-Stoch Hybrid D&K%?
This indicator is perfect for traders seeking a reliable, all-in-one momentum and trend tool. Whether you're scalping, swing trading, or analysing long-term trends, the CM RSI-Stoch Hybrid D&K% provides actionable insights without overwhelming complexity. Its dynamic volume-based colouring and customizable moving average make it adaptable to volatile or trending markets, while the clear overbought/oversold signals help you time entries and exits with confidence.
Unlock the power of precision trading with the CM RSI-Stoch Hybrid D&K% Indicator—your edge in navigating the markets effectively.

Swing Trading NR4/NR7 + 2BarNR/3BarNR + Inside Day + TrendSwing Trading Version: The Ultimate Momentum Setup
The Swing Trading Version of this strategy is tailored for traders looking to capture multi-day price movements in high-momentum stocks. It’s a carefully crafted approach combining classic patterns like NR4, NR7, and Inside Day with powerful trend filters to find the best opportunities for significant gains.
Price Compression: Identifies stocks in periods of consolidation using the NR4 and NR7 patterns, along with 2-Bar and 3-Bar Narrow Ranges—key indicators of potential volatility and breakout.
Trend Confirmation: The strategy ensures trades align with the broader trend by confirming that price is above the 20 EMA and that the 10 EMA is above the 20 EMA. This guarantees that you’re trading in the direction of strength.
Inside Day Filter: The Inside Day pattern is only triggered when the candlestick is within 1 ATR from the 10 EMA (or 20 EMA if below), ensuring you're not chasing a trade too far from a support level.
Clean, Powerful Signals: With a clear focus on momentum and price compression, you'll only get actionable signals backed by multiple layers of confirmation, including volatility and price structure.
This setup is perfect for traders seeking to ride out trends and capture sizeable moves, with an emphasis on simplicity and precision. Ideal for those who prefer to hold trades for multiple days while still maintaining control over their entries and exits.

Multi EMA OverlayThe Multi EMA Indicator allows you to display up to five customizable Exponential Moving Averages (EMAs) directly on your chart.
You can individually adjust the period, color, and visibility of each EMA, giving you complete flexibility to match your trading style and strategy.

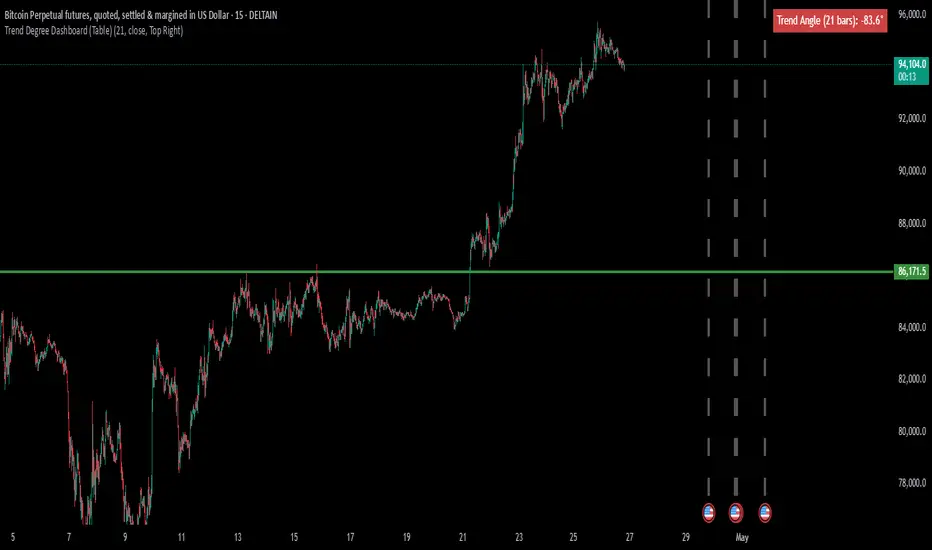
Trend Degree Dashboard (Table)📈 Trend Degree Dashboard (Table) — v1.0
This indicator calculates and displays the trend angle (in degrees) based on the linear regression of the selected source (default: close) over a user-defined lookback period (default: 21 bars).
The trend angle gives a quick visual reference of the current market slope — positive (uptrend) or negative (downtrend).
A dashboard table shows the trend angle directly on the chart, with a background color:
🟩 Green background for positive angles (uptrend)
🟥 Red background for negative angles (downtrend)
🔧 Features:
Customizable Lookback Period: Set the number of candles to consider for trend calculation.
Source Selection: Apply the analysis to close, open, high, low, or any other price series.
Dashboard Positioning: Choose where the dashboard appears (Top Left, Top Right, Bottom Left, Bottom Right).
Clean Table Design: Minimalistic and easy-to-read dashboard with automatic background color highlighting based on trend direction.
⚙️ How It Works:
It uses Linear Regression to measure the slope between two consecutive points.
Converts the slope into degrees using the arctangent function (atan) for a geometric interpretation of trend strength and direction.
Updates the dashboard table live with the latest angle value.
✅ Script Highlights:
Non-repainting: Once a bar closes, its value is fixed.
Efficient performance: Lightweight table visualization with no heavy calculations.
Clear trading signals: Positive angles suggest bullish momentum, negative angles suggest bearish momentum.
⚠️ Disclaimer:
This script is a technical analysis tool designed to assist in decision-making but does not guarantee results.
Please use it alongside other tools and practice proper risk management. Always test any indicator on demo accounts before applying it to live trading.

4H CRT Trendlines OnlyThis TradingView indicator plots 4-hour CRT (Central Range Time) trendlines based on specific session times (1AM, 5AM, 9AM, 1PM, 5PM, 9PM).
It also analyzes daily market bias to detect potential reversals or continuations at the start of each trading day.
Developed and maintained by Faisal Ali Salad.
Contact: faysalali2021@gmail.com | WhatsApp: +252 613422773.
Protected Script — source code is hidden to protect intellectual property.
Suitable for traders looking for accurate session levels and daily bias identification.

EMA golden cross strategy by Anuj Guptait just shows the golden crossovers. golden cross overs/unders are highly probable price points

Swing Trading NR4/NR7 + 2BarNR/3BarNR + Trend📜 Description:
NR4, NR7, 2-Bar NR, and 3-Bar NR Compression Scanner (Swing Trading Version)
This script spots serious price compressions (NR4, NR7, 2-Bar NR, 3-Bar NR) on the daily chart, with simple but ruthless trend confirmation.
It's leaner. It's cleaner. It's built for those who don’t like getting caught with their pants down in messy sideways markets.
The scanner conditions are:
NR4 and NR7 patterns: Today's daily range must be the narrowest compared to the last 4 or 7 days.
2-Bar and 3-Bar Narrow Ranges: The narrowest two-day or three-day ranges relative to the previous 20 sets.
Trend filter:
Closing price must be above the 20 EMA.
The 10 EMA must be above the 20 EMA.
Visuals:
Background highlights whenever a compression setup forms.
Shape markers above or below the bars to mark the opportunity.
📈 Why Use This?
Some have said swing trading is like sipping fine wine — slow, measured, deliberate.
I won’t say they’re wrong.
But there’s also the part where you grab the bottle, smash it over the head of bad setups, and only drink the good stuff.
This scanner lets you find daily compressions inside healthy trends.
The kind of coils that can explode in your favour — and not the fake-outs that empty your account while you cry into your keyboard.
🛠️ Built for Traders Who:
Trade on daily candles, not minute charts.
Want high-quality entries without second-guessing.
Understand that real breakouts come from contraction, not chaos.
Like their setups clean, focused, and simple enough to stick to under pressure.

NR4/NR7 + 2BarNR/3BarNR + Trend + Refined MACD + VWAP📜 Description:
NR4, NR7, 2-Bar NR, and 3-Bar NR Compression Scanner with Trend & Momentum Filters
This script identifies extreme price compressions (NR4, NR7, 2-Bar NR, 3-Bar NR) combined with strict trend and momentum conditions for higher-probability setups.
It’s not just about spotting contraction — it’s about ensuring the right environment for expansion.
The scanner conditions are:
NR4 and NR7 patterns: Today's range must be the narrowest compared to the last 4 or 7 days.
2-Bar and 3-Bar Narrow Ranges: The narrowest two or three day ranges compared to the last 20 sets of two/three days.
Trend filter:
Price must be above the 20 EMA.
The 10 EMA must be above the 20 EMA.
MACD proximity filter:
The MACD fast line must either be above the slow line or within 5% range below the slow line.
VWAP filter:
Price must be trading above VWAP.
Visuals:
Background colours highlight detected compression patterns aligned with trend.
Shape markers above or below bars for quick visual confirmation.
📈 Why Use This?
Some have said that trading is a waiting game. I won't say they're wrong.
This scanner doesn't just throw every tight-range day at you. It finds the coils in context — trending, gaining momentum, ready to spring.
If you chase trades like a fool in a brothel, you'll get taken for a ride.
If you wait for the right compression, at the right moment, with the right backing...
Well, let's just say, you might just start looking like you actually know what you're doing.
🛠️ Built for Traders Who:
Prefer strong trends over messy ranges.
Want systematic setups, not random guessing.
Like stacking probabilities rather than praying to the trading gods.
Enjoy catching breakouts when everyone else is still scratching their heads.

