MACD & Stochastic AlertThis code detects if the following combination has occured in the chart
if MACD has crossed over MACD Signal in the last 4 candles
and
whether the Fast Stochastic K% has exited the channel 80 & 23
Then you can set an alert based on the function call.
Indicators and strategies

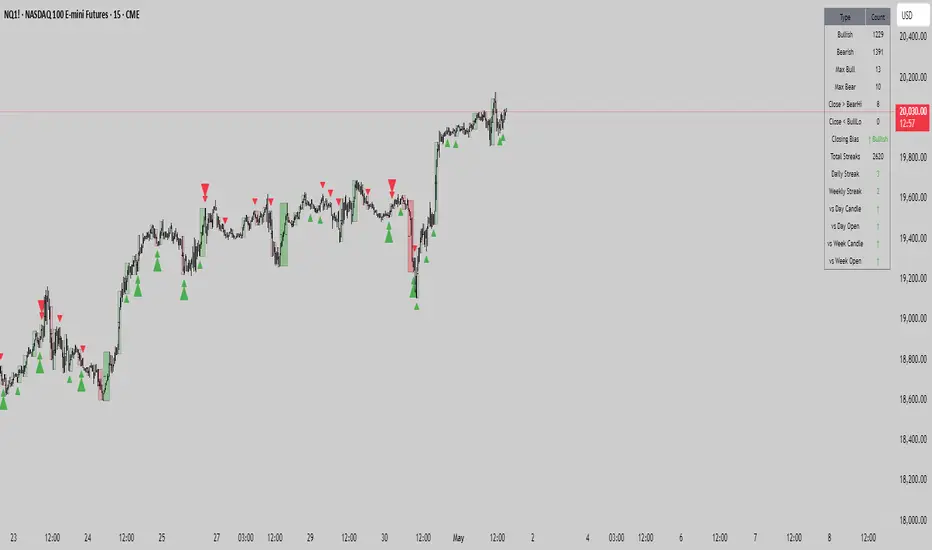
((Range||Type||Swing))Consecutive Candle range boxes with gradient and number count. Inside Outside and Engulfing color bars plus plots. Strict swing filter plus bonus filter where the 3rd bar in the swing closes below the swing candles high or low respectfully.
How I Use
I use the candle stick patterns to gauge market conditions, the consecutive candle ranges to follow order flow using a closing break of the range and retest and the filtered swings to assist in identifying stronger. If any one wants to create a strategy around this that would be cool i know nothing of coding and do everything with A.I
turns
Multi-TF T1W E1DTest
MA of 3 line cross with multi time frame
This one is for test how stock price react to each moving average

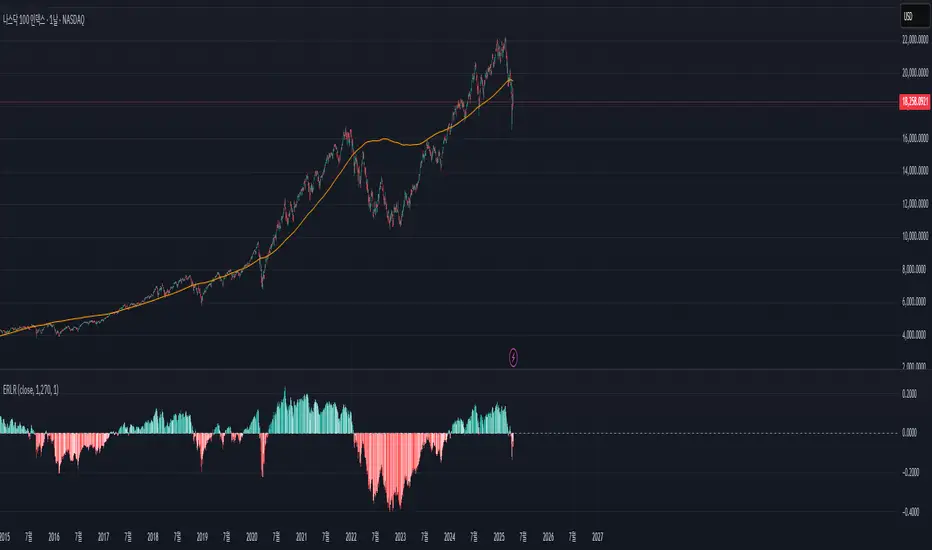
EMA Oscillating Trend📈 EMA Oscillating Trend by AI-123
The EMA Oscillating Trend indicator is a dynamic trend visualizer that enhances traditional EMA behavior by offsetting the line based on trend direction, providing a more intuitive and visually distinct representation of market momentum.
🔍 Key Features:
🔵 Bullish Color Customization – Define your preferred color for bullish trends
🔴 Bearish Color Customization – Set a different tone for bearish phases
🪄 Adjustable Line Thickness – Tailor the EMA's appearance to your chart style
📐 Offset Multiplier Input – Automatically pushes the EMA above price in a downtrend and below price in an uptrend for enhanced clarity
⚙️ User-Friendly Inputs – No coding knowledge required; full customization in the settings panel
🧠 How It Works:
Calculates a primary EMA line (OV) and a sub-component to compare against (OV2)
Determines the trend based on whether OV is above or below OV2
Shifts the EMA line above price during bearish trends and below price during bullish trends
The offset is percentage-based and scales dynamically with the price for optimal readability
✅ Ideal For:
Trend-followers seeking visual clarity
Discretionary traders who want less clutter and more signal
Anyone who likes their EMAs with a little more flair and insight
🛠️ Author: @alphainvestor123
This tool was crafted with simplicity and clarity in mind. If you enjoy the indicator, consider dropping feedback or sharing your use case!
5ma + O’Neil & Minervini Buy ConditionIndicator Overview
5ma + O’Neil & Minervini Buy Condition is an original TradingView indicator that extends beyond a simple collection of standard moving averages by offering:
- Five Fully Independent Lines : Each of MA1–MA5 can be configured as SMA, EMA, WMA, or VWMA with its own period and data source. This level of customization unlocks unique combinations no existing script provides.
- Synergy of Multiple Timeframes : Default settings (10, 21, 50, 200, 325) reflect ultra‑short, short, medium, long, and volume‑weighted long‑term perspectives. The layered structure functions as a multi‑filter, sharpening entry signals and trend confirmation beyond any single MA.
- Integrated Buy Conditions : Built‑in O’Neil and Minervini buy filters use fixed SMA‑based rules (50 & 200 SMA rising within 15% of 52‑week high; 10 > 21 > 50 SMA rising within high/low thresholds), plus a combined condition highlighting when both methods align.
- Clean Visualization & Style Controls : Background coloring for each buy condition appears only in the Style tab under clearly named parameters (O’Neil Buy Condition, Minervini Buy Condition, Both Conditions). MA lines support transparent default colors and customizable line width for optimal readability without clutter.
Calculation & Logic
SMA: (P₁ + P₂ + … + Pₙ) ÷ N
EMA: α = 2 ÷ (N + 1)
EMA_today = (Price_today – EMA_yesterday) × α + EMA_yesterday
WMA: (P₁×N + P₂×(N–1) + … + Pₙ×1) ÷
VWMA: Σ(Pᵢ×Vᵢ) ÷ Σ(Vᵢ) for i = 1…N
```
Buy Condition Logic
- O’Neil: Price > 50 SMA & 200 SMA (both rising) **and** within 15% of the 52‑week high.
- Minervini : 10 SMA > 21 SMA > 50 SMA (both short‑term SMAs rising) **and** within 25% of the 52‑week high **and** at least 25% above the 52‑week low.
- Combined : Both O’Neil and Minervini conditions true.
Usage Examples
1. Short‑Mid Cross : Observe MA1/MA2 crossover while MA3/MA4 confirm trend strength.
2. Volume‑Weighted Long‑Term : Use VWMA as MA5 to filter institutional‑strength pullbacks.
3. Multi‑Filter Entry : Look for purple background (Both Conditions) on daily chart as high‑confidence entry.
Why It’s Unique
- Not a Mash‑Up : Though built on standard MA formulas, the customizable layering and built‑in buy filters create a novel multi‑dimensional analysis tool.
- Trader‑Friendly : Detailed comments in the code explain parameter choices, calculation methods, and practical entry scenarios so that even Pine novices can understand the underlying mechanics.
- Publication‑Ready : Description and code demonstrate originality, add clear value, and comply with house‑rule requirements by explaining why and how components interact, not just listing features.
- Combined Custom MA & Buy Conditions : By integrating customizable moving averages with built-in buy filters, users can easily recognize O’Neil and Minervini recommended setups.


RUBX Индекс рубляThe ruble index, similar to the DXY, offsets the weakness or strength of the dollar in the USD/RUB
индекс рубля на подобии DXY, невелирует слабость или силу доллара в USD/RUB

Position Size ToolManual Stop Line: You are now prompted to enter an initial value to make the line visible, which can be re-opened from the indicator settings (simply select reset points). This can be helpful when switching between charts and the line falls outside of vision due to the price difference.
Limit Line :

My script1// This Pine Script® code is subject to the terms of the Mozilla Public License 2.0 at mozilla.org
2// © Lkkahar99
3
4//@version=6
5indicator("My script")
6plot(close)
7

Session Candle ColorsColors candles based on market session.
Asia = Green Candlestick
NY = Red Candlestick
London = Blue Candlestick
London x NY = Purple Candlestick

4 EMA + MTF Trend TableCreates a table on top right of chart that shows if the 4ma is bullish or bearish on different timeframes

Auto Step Horizontal LinesAuto Step Horizontal lines by custom range
Create automatic horizontal lines by specifying the price range for each line, with each line serving as an observation point for support and resistance levels.

Exponential Regression Log ResidualThis custom indicator measures the logarithmic residual between the current price and an exponential regression line, offering insights into relative overbought and oversold conditions on a logarithmic scale. It can be especially useful when analyzing assets that move exponentially over time, such as growth stocks or cryptocurrencies.
Nifty/BankNifty Scanner - RSI, MACD, BB, VWAP1. RSI (Relative Strength Index)
Purpose: Measures market momentum and identifies overbought (>70) or oversold (<30) conditions.
Benefit: Helps catch potential reversal zones or trend exhaustion points.
📈 2. MACD (Moving Average Convergence Divergence)
Purpose: Detects changes in trend direction via crossovers of the MACD line and signal line.
Benefit: Flags bullish and bearish momentum shifts, useful for confirming trade entries/exits.
📉 3. Bollinger Bands
Purpose: Shows volatility using a moving average with upper/lower bands.
Benefit: When price touches the upper/lower bands, it may indicate overextended conditions—potential reversal or breakout areas.
🟠 4. VWAP (Volume Weighted Average Price)
Purpose: Tracks the average price traded based on both volume and price.
Benefit: Acts as a dynamic support/resistance level, especially useful for intraday trading in Nifty/Bank Nifty. Crossing VWAP often signals institutional buying/selling zones.
✅ Overall Benefits
Combines momentum, trend, volatility, and volume-based signals
Helps in multi-angle analysis—confirming trades with multiple indicators
Useful for intraday and swing trading on Nifty/Bank Nifty
Clean visuals and alerts make decision-making faster


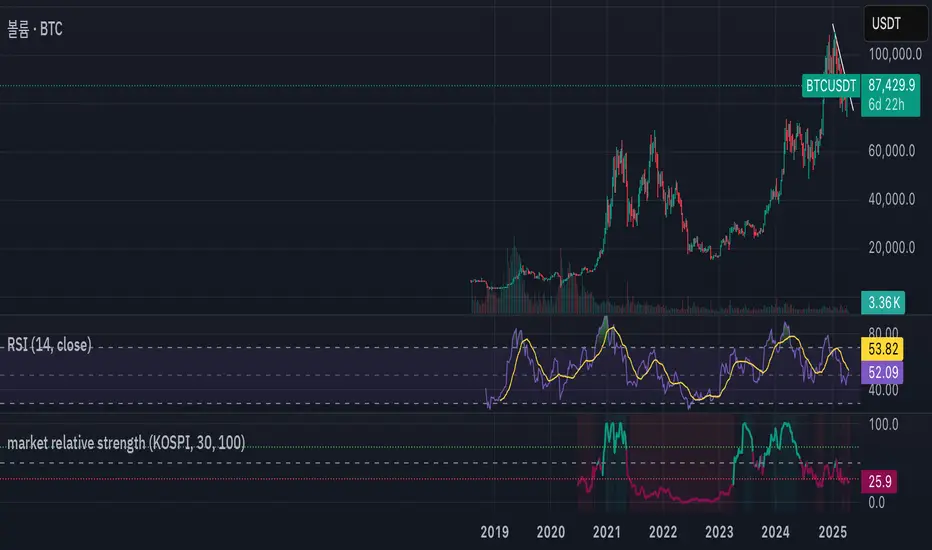
market relative strengthOverview
market relative strength is a custom indicator that visualizes how strong or weak a given asset is compared to a selected market benchmark — such as KOSPI, NASDAQ100, BTC dominance, or total crypto market cap.
How It Works
The indicator calculates the relative return between the current asset and the selected benchmark over a user-defined period. It then normalizes the difference into a 0–100 score:
Above 50 = outperforming the market
Below 50 = underperforming the market
Above 70 / Below 30 = strong divergence from market trend
Use Case
This is ideal for identifying assets with strong relative performance, detecting trend leaders or laggards, and rotating positions between sectors or assets based on strength.
Customization
Choose from a list of market indexes or crypto metrics
Set the comparison period and normalization range
Visual cues with background shading for strong/weak zones
Note
This is not the same as RSI. This indicator is based on relative performance to a benchmark, not price momentum.
SMART MONEY CheckListIndicator 4 my Twins 😍
It's meant to simplify top-down analysis.
Do you have more "Yes" than "No" and your setup is there?
Let's fckn goooo!!!
😆😆😆

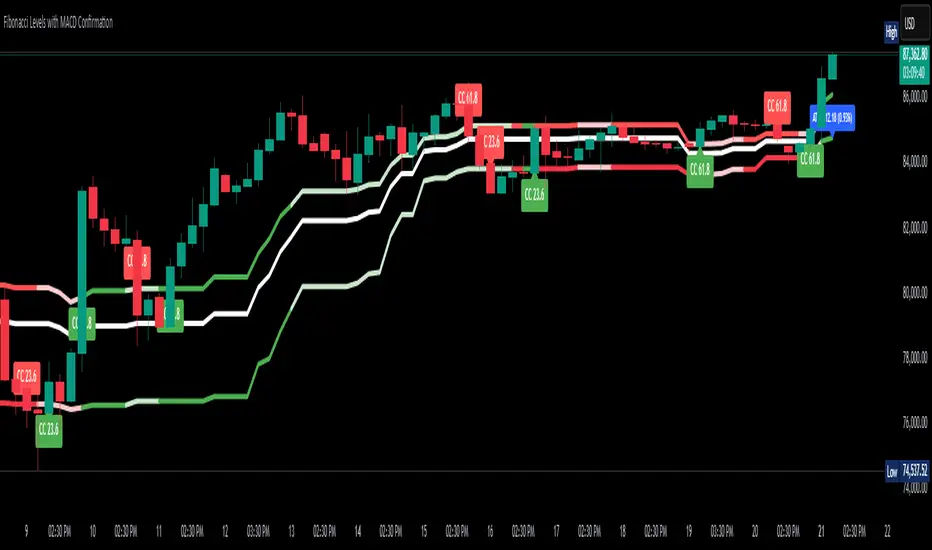
Fibonacci Levels with MACD ConfirmationHow to Understand and Use the Fibonacci Levels with MACD Confirmation Script
This custom Pine Script is designed to give traders a clear visual framework by combining dynamic Fibonacci retracement levels, MACD histogram confirmation, and volatility-based swing zones. It aims to simplify trend analysis, improve entry timing, and adapt to various market conditions.
How to Interpret the 23.6% & 61.8% Labels
These Fibonacci levels represent key retracement zones where price often reacts during trend pullbacks or reversals.
The 23.6% level indicates a shallow retracement, useful in strong trends where price resumes early.
The 61.8% level is a deeper retracement, often a "last line of defense" before trend invalidation.
The script labels these zones with "CC 23.6" and "CC 61.8" when the price crosses them with MACD histogram confirmation:
Green label (CC) = bullish confirmation
Red label (CC) = bearish confirmation
How to Modify Inputs (Manual Adjustments)
Input Purpose Default How to Use
ATR Period Measures volatility 14 Increase for smoother, slower reactions; reduce for faster swings
Min Lookback Minimum bars for swing zone 20 Avoids short-term noise
Max Lookback Cap for swing zone scan 100 Avoids excessively wide retracement levels
Inverse Candle Chart Flips high/low logic false Enable for inverted analysis or backtesting "opposite logic"
How to Use the Inverse Candle Chart Option
Activating inverse mode flips candle logic:
Highs become negative lows, and vice versa.
Useful for:
Contrarian analysis
Inverse ETFs or short-biased views
Backtesting reverse-pattern behavior
How to Adjust the Style
You can manually personalize the script’s visual appearance:
Change line width in plot(..., linewidth=2) for bolder or thinner Fib levels.
Change colors from color.green, color.red, etc., to suit your theme.
Modify label.size, label.style, and label.color for different labeling visuals.
Customize MACD histogram style from plot.style_columns to other styles like style_histogram.
How the MACD is Set and Displayed
The MACD uses non-standard values:
Fast Length = 24
Slow Length = 52
Signal Smoothing = 18
These values slow down the indicator, reducing noise and aligning better with medium- to long-term trends.
MACD histogram is plotted directly on the main chart for faster, on-screen decision making.
Color-coded histogram:
Green/Lime = Bullish momentum increasing or steady
Red/Maroon = Bearish momentum increasing or steady
How to Use the Indicator in Real-World Trading
This indicator is most effective when used to:
✅ 1. Spot High-Probability Trend Continuation Zones
In a strong trend, price will often retrace to 23.6% or 61.8%, then resume.
Wait for:
Price to cross 23.6 or 61.8
MACD histogram rising (bullish) or falling (bearish)
"CC 23.6" or "CC 61.8" label to appear
🟢 Entry Example: Price retraces to Fib 61.8%, crosses up with green MACD histogram → take long position
✅ 2. Validate Reversal or Breakout Zones
These Fib levels also act as support/resistance.
If price crosses a Fib level but MACD fails to confirm, it may be a fake breakout.
Use confirmation labels only when MACD aligns.
✅ 3. Add Volatility Context (ATR) for Risk Management
The ATR label shows both value and %.
Use ATR to:
Set dynamic stop-losses (e.g., 1.5x ATR below entry)
Decide trade size based on volatility
How to Combine the Indicator With Other Tools
You can combine this script with other technical tools for a powerful trading framework:
🔁 With Moving Averages
Use 50/200 MA for overall trend direction
Take signals only in the direction of MA slope
🔄 With Price Action Patterns
Use the Fib/MACD signals at confluence points:
Support/resistance zones
Breakout retests
Candlestick patterns (pin bars, engulfing)
🔺 With Volume or Order Flow
Combine with volume spikes or order book signals
Confirm that Fib/MACD signals align with strong volume for conviction
✅ Trade Setup Summary
Criteria Long Setup Short Setup
Price at Fib Level At or crossing Fib 23.6 / 61.8 Same
MACD Histogram Rising and above previous bar Falling and below previous bar
Label Appears Green "CC 23.6" or "CC 61.8" Red "CC 23.6" or "CC 61.8"
Optional Filters Trend direction, ATR range, volume, price pattern Same
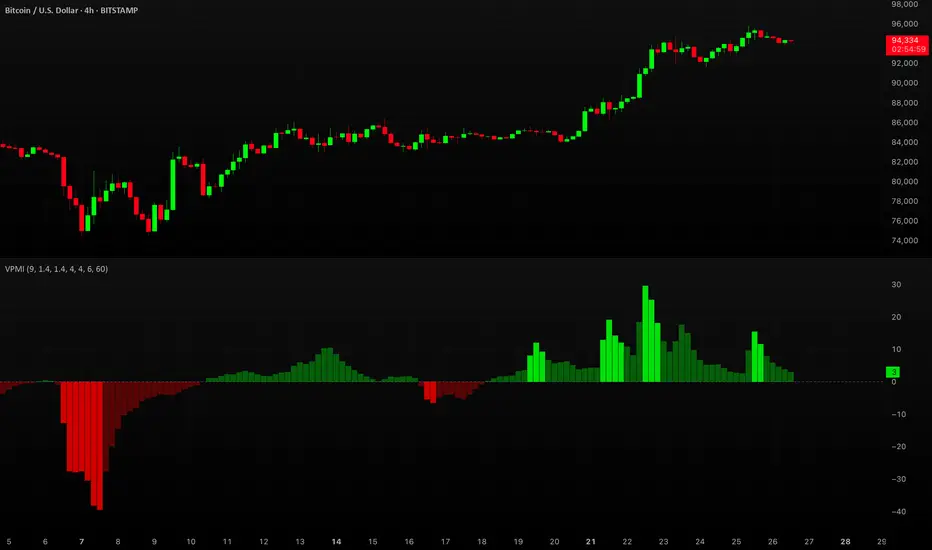
Volume-Price Momentum IndicatorVolume-Price Momentum Indicator (VPMI)
Overview
The Volume-Price Momentum Indicator (VPMI), developed by Kevin Svenson , is a powerful technical analysis tool designed to identify strong bullish and bearish momentum in price movements, driven by volume dynamics. By analyzing price changes and volume surges over a user-defined lookback period, VPMI highlights potential trend shifts and continuation patterns through a smoothed histogram, optional labels, and background highlights. Ideal for traders seeking to capture momentum-driven opportunities, VPMI is suitable for various markets, including stocks, forex, and cryptocurrencies.
How It Works
VPMI calculates the difference between volume-weighted buying and selling pressure based on price changes over a specified lookback period. It amplifies signals during high-volume periods, applies smoothing to reduce noise, and uses momentum checks to detect sustained trends.
Indicator display:
A histogram that oscillates above (bullish) or below (bearish) a zero line, with brighter colors indicating stronger momentum and faded colors for weaker signals.
Optional labels ("Bullish" or "Bearish") to mark significant momentum shifts.
Optional background highlights to visually emphasize strong trend conditions.
Alerts to notify users when strong bullish or bearish momentum is detected.
Key Features
Customizable Settings:
Adjust the lookback period, volume threshold, momentum length, and smoothing to suit your trading style.
Volume Sensitivity:
Emphasizes price movements during high-volume surges, enhancing signal reliability.
Momentum Detection: Uses linear regression and momentum change to confirm sustained trends, reducing false signals.
Visual Clarity:
Offers a clear histogram with color-coded signals, plus optional labels and backgrounds for enhanced chart readability.
Alerts:
Configurable alerts for strong momentum signals, enabling timely trade decisions.
Inputs and Customization
Lookback Period (Default: 9):
Sets the number of bars to analyze price changes. Higher values smooth signals but may lag.
Volume Threshold (Default: 1.4):
Defines the volume level (relative to a 20-period SMA) that qualifies as a surge, amplifying signals.
High Volume Multiplier (Default: 1.5):
Boosts histogram values during high-volume periods for stronger signals.
Histogram Smoothing Length (Default: 4):
Controls the EMA smoothing applied to the histogram, reducing noise.
Momentum Check Length (Default: 4):
Sets the period for momentum trend analysis (recommended to be less than Lookback Period).
Momentum Threshold (Default: 6):
Defines the minimum momentum change required for strong signals.
Show Labels (Default: Off):
Toggle to display "Bullish" or "Bearish" labels on significant momentum shifts.
Show Backgrounds (Default: Off):
Toggle to highlight chart backgrounds during strong momentum periods.
Bullish/Bearish Colors:
Customize colors for bullish (default: green) and bearish (default: red) signals.
Faded Transparency (Default: 40):
Adjusts the transparency of weaker signals for visual distinction.
How to Use
Interpret Signals:
Above Zero (Green):
Indicates bullish momentum. Bright green suggests strong, sustained buying pressure.
Below Zero (Red):
Indicates bearish momentum. Bright red suggests strong, sustained selling pressure.
Faded Colors:
Weaker momentum, potentially signaling consolidation or trend exhaustion.
Enable Visuals:
Turn on "Show Labels" and "Show Backgrounds" in the settings for additional context on strong momentum signals.
Set Alerts:
Use the built-in alert conditions ("Strong Bullish Momentum" or "Strong Bearish Momentum") to receive notifications when significant trends emerge.
Combine with Other Tools:
Pair VPMI with support/resistance levels, trendlines, or other indicators (e.g., RSI, MACD) for confirmation.
Best Practices
Timeframe:
VPMI works on all timeframes, but shorter timeframes (e.g., 5m, 15m) may produce more signals, while longer timeframes (e.g., 1h, 4h, 1D) offer higher reliability.
Market Conditions:
Most effective in trending markets. In choppy or sideways markets, consider increasing the smoothing length or momentum threshold to filter noise.
Risk Management:
Always use VPMI signals in conjunction with a robust trading plan, including stop-losses and position sizing.
Limitations
Lagging Nature:
As a momentum indicator, VPMI may lag in fast-moving markets due to smoothing and lookback calculations.
False Signals:
In low-volume or ranging markets, signals may be less reliable. Adjust the volume threshold or momentum settings to improve accuracy.
Customization Required:
Optimal settings vary by asset and timeframe. Experiment with inputs to align with your trading strategy.
Why Use VPMI?
VPMI offers a unique blend of volume and price momentum analysis, making it a versatile tool for traders seeking to identify high-probability trend opportunities. Its customizable inputs, clear visuals, and alert capabilities empower users to tailor the indicator to their needs, whether for day trading, swing trading, or long-term analysis.
Get Started
Apply VPMI to your chart, tweak the settings to match your trading style, and start exploring momentum-driven opportunities. For questions or feedback, consult TradingView’s community forums or documentation. Happy trading!
SAC indicatorThis indicator is built on a filter for candles that meet a condition "SAC." To identify them on the chart, you can set an alert when the condition applies to the current candle that matches your preferred frame.

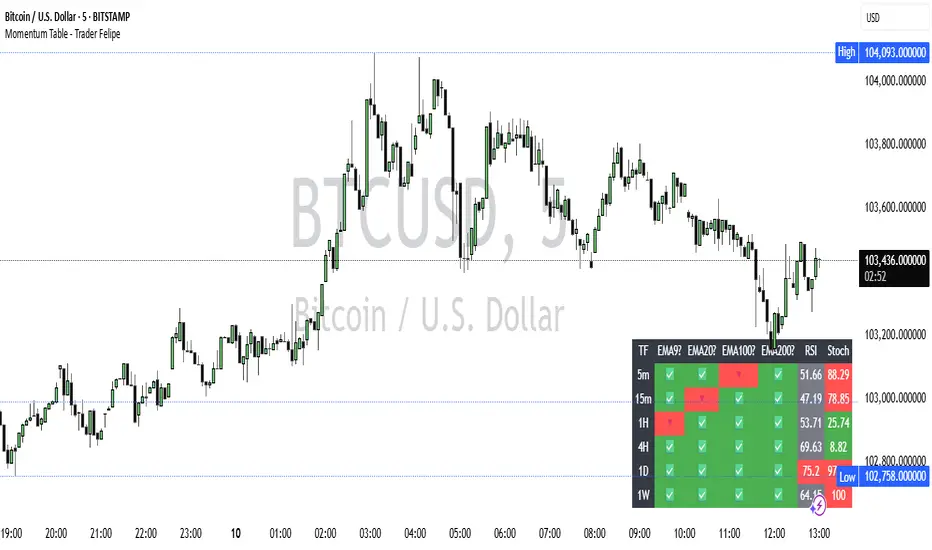
Momentum Table - Felipe📊 Momentum Table – By Felipe
This multi-timeframe momentum dashboard displays a clean and color-coded overview of key trend and momentum indicators across 6 major timeframes (5m to 1W), directly on your chart. It’s ideal for quickly identifying market strength, trend alignment, and potential reversals at a glance.
🔍 Features:
EMA Trend Check (EMA 9, 20, 100, 200):
Compares the current close against each EMA.
✅ Green check = price is above the EMA (bullish bias).
🔻 Red arrow = price is below the EMA (bearish bias).
Visual trend alignment helps you spot strong directional setups.
RSI (Relative Strength Index):
Displays current RSI (14) value per timeframe.
Background color highlights momentum conditions:
🔴 Red = Overbought (>70)
🟢 Green = Oversold (<30)
⚪ Gray = Neutral
Stochastic RSI:
Uses Stoch RSI applied to RSI (14) for sensitivity.
Background color follows the same logic as RSI for quick visual cues.
Compact Visual Table:
Located in the bottom-right corner.
Clean design with headers and rows labeled by timeframe.
Helps traders monitor trend and momentum confluence across multiple timeframes in real time.
This tool supports momentum-based strategies, EMA stacking confirmation, and multi-timeframe alignment, making it ideal for scalpers, swing traders, and trend followers alike.

US30 Smart Money 5M/4H Strategy🧠 How It Works
✅ 1. 4H Trend Bias Detection
Uses the 4-hour chart (internally) to determine if the market is in an uptrend or downtrend.
Background turns green for bullish trend, red for bearish trend.
This helps filter trades — only take longs during uptrend, shorts during downtrend.
✅ 2. Liquidity Sweeps (Stop Hunts) on 5M
Highlights candles that break previous highs/lows and then reverse (typical of institutional stop raids).
Draws a shaded red box above sweep-high candles and green box under sweep-lows.
These indicate key reversal zones.
✅ 3. Order Block Zones
Detects bullish/bearish engulfing patterns after liquidity sweeps.
Draws a supply or demand zone box extending forward.
These zones show where institutions likely placed large orders.
✅ 4. FVG Midpoint from 30-Min Chart
Detects Fair Value Gaps (imbalances) on the 30-minute chart.
Plots a line at the midpoint of the gap (EQ level), which is often revisited for entries or rejections.
✅ 5. Buy/Sell Signals (Non-Repainting)
Buy = 4H uptrend + 5M liquidity sweep low + bullish engulfing candle.
Sell = 4H downtrend + 5M liquidity sweep high + bearish engulfing.
Prints green “BUY” or red “SELL” label on the chart — these do not repaint.
📈 How to Use It
Wait for trend bias — only take trades in the direction of the 4H trend.
Watch for liquidity sweep boxes — these hint a stop hunt just occurred.
Look for a signal label (BUY/SELL) — confirms entry criteria.
Use FVG EQ lines & Order Block zones as confluence or targets.
Take trades after NY open (9:30 AM EST) for best momentum.
