GranDoc - Week, Day, Month, and Session Separator5Indicator Name: GranDoc's - Week, Day, Month, and Session Separator
Version: Pine Script v5
Author: Jonpaul Nnamdi Opara (GranDoc )
Description
The "GranDoc - Week, Day, Month, and Session Separator" is a highly customizable TradingView indicator designed to enhance chart analysis by visually marking critical time-based transitions. Developed by Jonpaul Nnamdi Opara, this tool plots vertical lines with labels or background highlights to denote the start and end of weeks, days, months, and major trading sessions (Frankfurt, London, NY Morning, NY Afternoon, Sydney, and Tokyo). Traders can tailor colors, line styles, widths, transparency, and session times to align with their strategies and timezones.
Ideal for forex, stocks, futures, and crypto traders, this indicator simplifies the identification of key market periods—such as session openings/closings or new weeks—that often signal increased volatility or trend shifts. It’s optimized for intraday timeframes for session separators but supports all timeframes for week, day, and month markers, making it a versatile addition to any trader’s toolkit.
Features
Week Separators: Marks Monday starts with customizable lines and "Week Start" labels.
Day Separators: Highlights daily openings with lines and "Day Start" labels.
Month Separators: Indicates new months with lines and "Month Start" labels.
Session Separators: Plots lines and labels for major trading sessions’ start and end:
Frankfurt (default: 07:00–15:00 UTC)
London (default: 08:00–16:00 UTC)
NY Morning (default: 13:00–16:00 UTC)
NY Afternoon (default: 16:00–21:00 UTC)
Sydney (default: 22:00–06:00 UTC)
Tokyo (default: 00:00–08:00 UTC)
Timezone Support: Adjusts session times with a UTC offset (±12 hours).
Display Flexibility : Toggle between labeled vertical lines or background highlights.
Customization: Fine-tune colors, line styles (solid, dashed, dotted), widths, and transparency.
Background Mode: Highlights periods with translucent backgrounds for cleaner charts.
[ i]Labeled Lines: Each line includes descriptive labels (e.g., "London Open", "Tokyo Closed") when not in background mode.
How to Use
Add to Chart:
Copy the script into TradingView’s Pine Editor.
Click "Add to Chart" to apply the indicator.
Customize Settings:
Open settings via double-click or the "Settings" gear icon.
Timezone Offset: Set your UTC offset (e.g., -5 for EST) to align sessions.
Toggles: Enable/disable week, day, month, or session separators.
Appearance: Adjust colors, line styles, widths, and transparency for each separator.
Session Times: Modify start/end hours and minutes if defaults don’t suit your market.
Background Mode: Enable "Show as Background" for colored backgrounds instead of lines, and tweak "Session Background Transparency."
Labels: Labeled lines (e.g., "Sydney Open") appear automatically unless background mode is active.
Chart Compatibility:
Session separators require intraday timeframes (e.g., 1-minute to 4-hour).
Week, day, and month separators work across all timeframes.
Confirm your chart’s timezone aligns with your analysis.
Analyze:
Use separators to pinpoint session transitions, daily openings, or weekly shifts for trade planning.
Labels make it easy to spot key periods on busy charts.
Pair with indicators like RSI, volume, or support/resistance for deeper insights.
Example Use Cases
Forex Trading: Highlight London and NY session opens/closes for high-liquidity entries.
Day Trading: Reset strategies at daily separators and monitor intraday volatility.
Swing Trading: Use week/month separators to track longer-term trends.
Session Focus: Isolate sessions like Tokyo for regional market analysis.
Chart Clarity: Background mode declutters charts while marking key times.
Notes
Session separators are disabled on daily+ timeframes to prevent clutter.
Verify timezone offset for accurate session alignment.
Background mode suits lower timeframes for readability.
Labels are visible only when background mode is disabled.
Feedback
Share your thoughts or suggestions to make this indicator even better! Reach out via TradingView or connect with the author for insights. Happy trading!
About the Author
Dr. Jonpaul Nnamdi Opara, a PhD graduate from Ehime University, Japan, is a researcher and developer specializing in AI and machine learning. His work on automated landslide mapping and defect detection, published in journals like GEOMATE, showcases his precision-driven approach. With the "GranDoc" indicator, Jonpaul brings intuitive, data-driven clarity to financial markets, reflecting his expertise in creating impactful tools.
Indicators and strategies
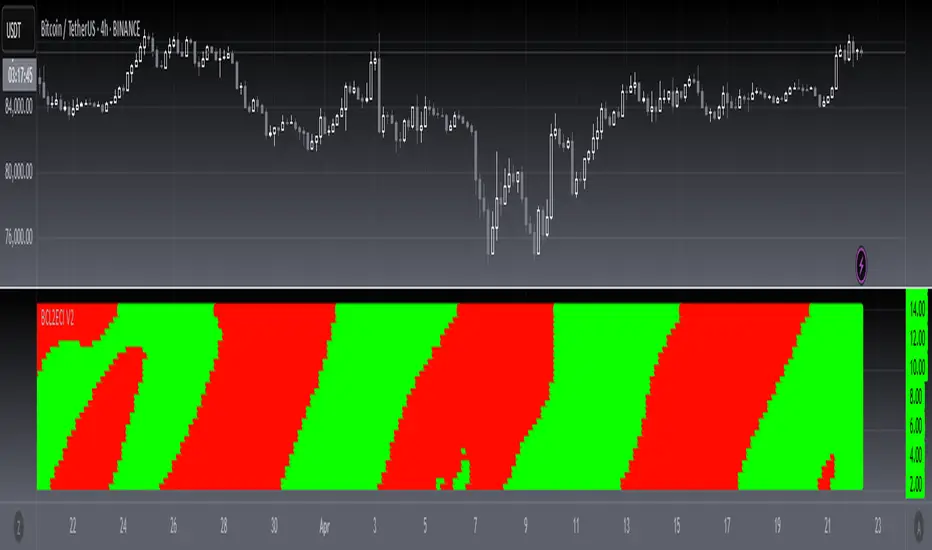
[blackcat] L2 Ehlers Convolution Indicator V2OVERVIEW The L2 Ehlers Convolution Indicator V2 is an advanced technical analysis tool that applies convolution techniques to identify market trends and potential reversal points. It uses adaptive filtering to analyze price movements across multiple timeframes.
FEATURES
• Advanced convolution algorithm based on Ehlers' methodology
• Multiple timeframe analysis (S2 through S60)
• Dynamic color coding for trend direction:
Red: Downward trend
Green: Upward trend • Adjustable sensitivity through period inputs
HOW TO USE
Input Parameters:
• ShortestPeriod: Minimum period length for calculations
• LongestPeriod: Maximum period length for calculations
Interpretation:
• Red bars indicate downward momentum
• Green bars indicate upward momentum
• Bar height corresponds to the timeframe analyzed
LIMITATIONS
• Requires sufficient historical data for accurate calculations
• May produce false signals during volatile markets
• Performance depends on selected period parameters
NOTES
• The indicator uses arrays to store correlation, slope, and convolution values
• Each bar represents a different timeframe analysis
• Color intensity varies based on the strength of the signal
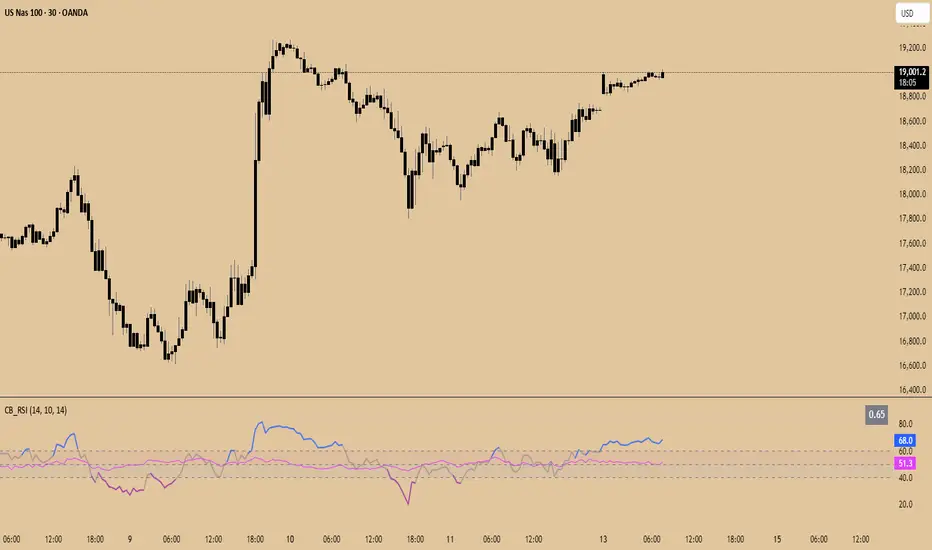
Constance Brown RSI with Composite IndexConstance Brown RSI with Composite Index
Overview
This indicator combines Constance Brown's RSI interpretation methodology with a Composite Index and ATR Distance to VWAP measurement to provide a comprehensive trading tool. It helps identify trends, momentum shifts, overbought/oversold conditions, and potential reversal points.
Key Features
Color-coded RSI zones for immediate trend identification
Composite Index for momentum analysis and divergence detection
ATR Distance to VWAP for identifying extreme price deviations
Automatic divergence detection for early reversal warnings
Pre-configured alerts for key trading signals
How to Use This Indicator
Trend Identification
The RSI line changes color based on its position:
Blue zone (RSI > 50): Bullish trend - look for buying opportunities
Purple zone (RSI < 50): Bearish trend - look for selling opportunities
Gray zone (RSI 40-60): Neutral/transitional market - prepare for potential breakout
The 40-50 area (light blue fill) acts as support during uptrends, while the 50-60 area (light purple fill) acts as resistance during downtrends.
// From the code:
upTrendZone = rsiValue > 50 and rsiValue <= 90
downTrendZone = rsiValue < 50 and rsiValue >= 10
neutralZone = rsiValue > 40 and rsiValue < 60
rsiColor = neutralZone ? neutralRSI : upTrendZone ? upTrendRSI : downTrendRSI
Momentum Analysis
The Composite Index (fuchsia line) provides momentum confirmation:
Values above 50 indicate positive momentum
Values below 40 indicate negative momentum
Crossing above/below these thresholds signals potential momentum shifts
// From the code:
compositeIndexRaw = rsiChange / ta.stdev(rsiValue, rsiLength)
compositeIndex = ta.sma(compositeIndexRaw, compositeSmoothing)
compositeScaled = compositeIndex * 10 + 50 // Scaled to fit 0-100 range
Overbought/Oversold Detection
The ATR Distance to VWAP table in the top-right corner shows how far price has moved from VWAP in terms of ATR units:
Extreme positive values (orange/red): Potentially overbought
Extreme negative values (purple/red): Potentially oversold
Near zero (gray): Price near average value
// From the code:
priceDistance = (close - vwapValue) / ta.atr(atrPeriod)
// Color coding based on distance value
Divergence Trading
The indicator automatically detects divergences between the Composite Index and price:
Bullish divergence: Price makes lower low but Composite Index makes higher low
Bearish divergence: Price makes higher high but Composite Index makes lower high
// From the code:
divergenceBullish = ta.lowest(compositeIndex, rsiLength) > ta.lowest(close, rsiLength)
divergenceBearish = ta.highest(compositeIndex, rsiLength) < ta.highest(close, rsiLength)
Trading Strategies
Trend Following
1. Identify the trend using RSI color:
Blue = Uptrend, Purple = Downtrend
2. Wait for pullbacks to support/resistance zones:
In uptrends: Buy when RSI pulls back to 40-50 zone and bounces
In downtrends: Sell when RSI rallies to 50-60 zone and rejects
3. Confirm with Composite Index:
Uptrends: Composite Index stays above 50 or quickly returns above it
Downtrends: Composite Index stays below 50 or quickly returns below it
4. Manage risk using ATR Distance:
Take profits when ATR Distance reaches extreme values
Place stops beyond recent swing points
Reversal Trading
1. Look for divergences
Bullish: Price makes lower low but Composite Index makes higher low
Bearish: Price makes higher high but Composite Index makes lower high
2. Confirm with ATR Distance:
Extreme readings suggest potential reversals
3. Wait for RSI zone transition:
Bullish: RSI crosses above 40 (purple to neutral/blue)
Bearish: RSI crosses below 60 (blue to neutral/purple)
4. Enter after confirmation:
Use candlestick patterns for precise entry
Place stops beyond the divergence point
Four pre-configured alerts are available:
Momentum High: Composite Index above 50
Momentum Low: Composite Index below 40
Bullish Divergence: Composite Index higher low
Bearish Divergence: Composite Index lower high
Customization
Adjust these parameters to optimize for your trading style:
RSI Length: Default 14, lower for more sensitivity, higher for fewer signals
Composite Index Smoothing: Default 10, lower for quicker signals, higher for less noise
ATR Period: Default 14, affects the ATR Distance to VWAP calculation
This indicator works well across various markets and timeframes, though the default settings are optimized for daily charts. Adjust parameters for shorter or longer timeframes as needed.
Happy trading!
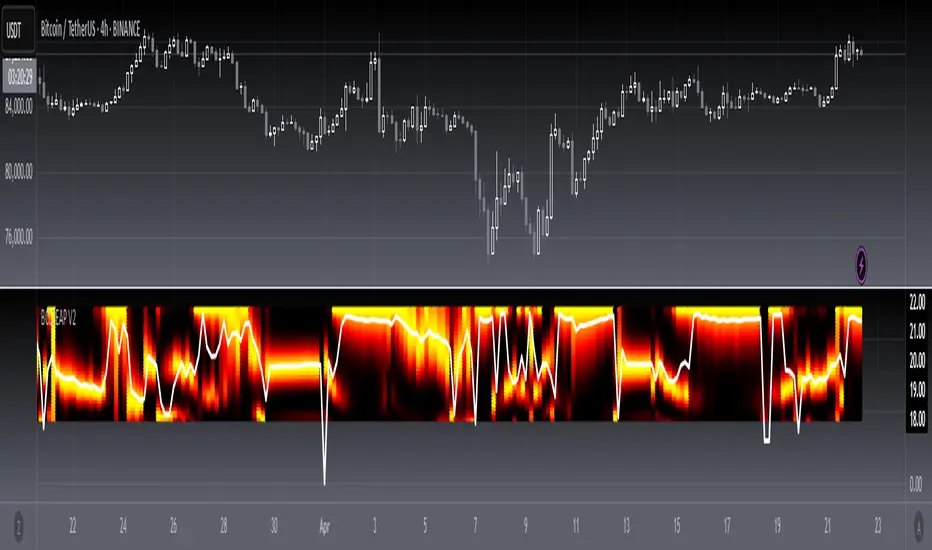
[blackcat] L2 Ehlers Autocorrelation Periodogram V2OVERVIEW
The Ehlers Autocorrelation Periodogram is a sophisticated technical analysis tool that identifies market cycles and their dominant frequencies using autocorrelation and spectral analysis techniques.
BACKGROUND
Developed by John F. Ehlers and detailed in his book "Cycle Analytics for Traders" (2013), this indicator combines autocorrelation functions with discrete Fourier transforms to extract cyclic information from price data.
FUNCTION
The indicator works through these key steps:
Calculates autocorrelation using minimum three-bar averaging
Applies discrete Fourier transform to extract cyclic information
Uses center-of-gravity algorithm to determine dominant cycle
ADVANTAGES
• Rapid response within half-cycle periods
• Accurate relative cyclic power estimation over time
• Correlation constraints between -1 and +1 eliminate amplitude compensation needs
• High resolution independent of windowing functions
HOW TO USE
Add the indicator to your chart
Adjust AvgLength input parameter:
• Default: 3 bars
• Higher values increase smoothing
• Lower values increase sensitivity
Interpret the results:
• Colored bars represent spectral power
• Red to yellow spectrum indicates cycle strength
• White line shows dominant cycle period
INTERPRETATION
• Strong colors indicate significant cyclic activity
• Sharp color transitions suggest potential cycle changes
• Dominant cycle line helps identify primary market rhythm
LIMITATIONS
• Requires sufficient historical data
• Performance may vary in non-cyclical markets
• Results depend on proper parameter settings
NOTES
• Uses highpass and super smoother filtering techniques
• Spectral estimates are normalized between 0 and 1
• Color intensity varies based on spectral power
THANKS
This implementation is based on Ehlers' original work and has been adapted for TradingView's Pine Script platform.
Auto Anchored VWAPs for FuturesAbout the Script
This indicator automatically plots five anchored VWAPs based on predefined starting times, offering traders key reference points across multiple timeframes. These starting points are hardcoded and cannot be customized, ensuring consistency across all time zones. Below are the anchored VWAPs and their respective starting times:
NY Session: Starts daily at 9:30 AM EST
Globex: Starts daily at 6:00 PM EST
Weekly: Resets every Sunday at 6:00 PM EST
Monthly: Anchored to the first session of the month at 6:00 PM EST
Yearly: Anchored to the first session of the year at 6:00 PM EST
How to Use the Script
1) Add the script to your chart.
2) Select the appropriate Daylight Savings Time format.
3) Customize the visual appearance to your preference.
4) Click "OK" to apply the changes.
Once configured, the VWAP levels will automatically adjust based on the predefined timeframes.
How the Script Works
The script calculates and plots anchored VWAPs at the predefined starting times listed above. As each session, week, month, and year progresses, the corresponding VWAP is recalculated and updated on the chart, providing traders with dynamic insights into market trends and volume-weighted price action.
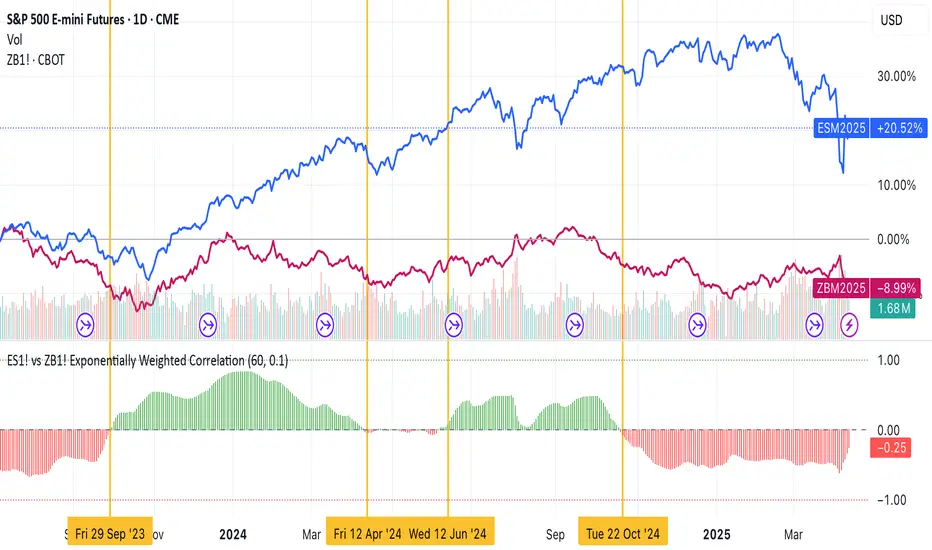
ES1! vs ZB1! Exponentially Weighted CorrelationES1! vs ZB1! Exponentially Weighted Correlation
This indicator calculates and visualizes the exponentially weighted correlation between the S&P 500 E-mini futures (ES1!) and the 30-Year U.S. Treasury Bond futures (ZB1!) over a user-defined lookback period. By using an exponential moving average (EMA) approach, it emphasizes recent price movements, providing a dynamic view of the relationship between these two key financial instruments.
Features:
- Customizable Inputs: Adjust the lookback length (default: 60) and alpha (default: 0.1) to fine-tune the sensitivity of the correlation calculation.
- Exponentially Weighted Correlation: Measures the strength and direction of the relationship between ES1! and ZB1! prices, with more weight given to recent data.
- Visual Clarity: Displays correlation as colored bars (green for positive, red for negative) for quick interpretation, with reference lines at 0, +1, and -1 for context.
- Non-Overlay Design: Plotted in a separate panel below the chart to avoid cluttering price data.
How It Works:
The indicator fetches closing prices for ES1! and ZB1!, applies an EMA to smooth the data, and computes the exponentially weighted covariance and variances. The correlation is then derived and plotted as a histogram, helping traders identify whether the two markets are moving together (positive correlation), in opposite directions (negative correlation), or independently.
Use Cases:
- Market Analysis: Gauge the relationship between equity and bond markets to inform trading strategies.
- Risk Management: Monitor correlation shifts to adjust portfolio exposure.
- Intermarket Insights: Identify trends or divergences in the stock-bond dynamic for macroeconomic analysis.
Ideal for traders and analysts tracking intermarket relationships, this indicator offers a clear, responsive tool for understanding ES1! and ZB1! correlation in real-time.
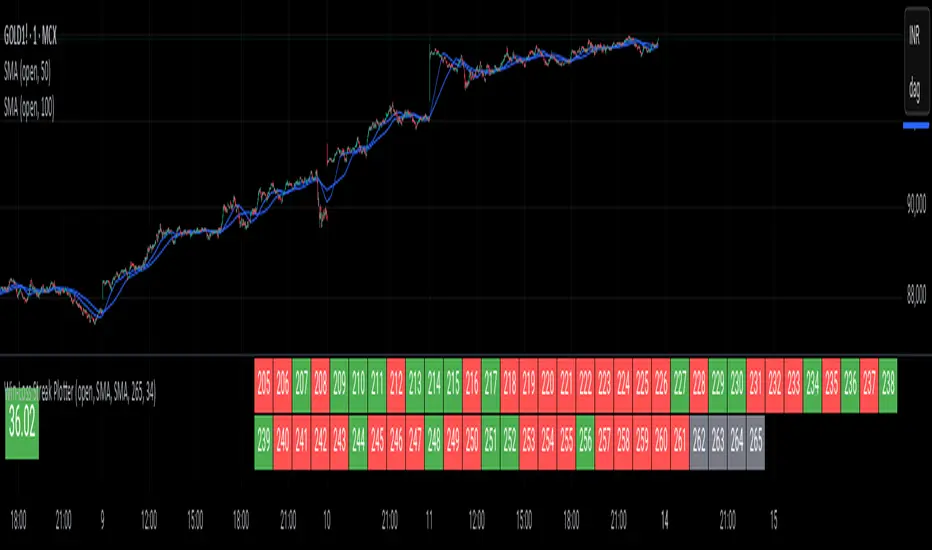
[blackcat] L2 Ehlers Autocorrelation Indicator V2OVERVIEW
The Ehlers Autocorrelation Indicator is a technical analysis tool developed by John F. Ehlers that measures the correlation between price data and its lagged versions to identify potential market cycles and reversals.
BACKGROUND
Originally introduced in Ehlers' "Cycle Analytics for Traders" (2013), this indicator leverages autocorrelation principles to detect patterns in market data that deviate from random noise or perfect sine waves.
FEATURES
• Calculates Pearson correlation coefficients for lags from 0 to 60 bars
• Visualizes correlations using colored bars ranging from red (negative correlation) to yellow (positive correlation)
• Provides minimum averaging option through AvgLength input parameter
• Displays sharp reversal signals at price turning points
• Shows variations in bar thickness and count over time
HOW TO USE
Add the indicator to your chart
Adjust the AvgLength input as needed:
• Set to 0 for no averaging
• Increase value for smoother results
Interpret the colored bars:
• Red: Negative correlation
• Yellow: Positive correlation
• Sharp transitions indicate potential reversal points
LIMITATIONS
• Requires sufficient historical data for accurate calculations
• Performance may vary across different market conditions
• Results depend on proper parameter settings
NOTES
• The indicator uses highpass filtering and super smoother filtering techniques
• Color intensity varies based on correlation strength
• Multiple lag periods are displayed simultaneously for comprehensive analysis
THANKS
This implementation is based on Ehlers' original work and has been adapted for TradingView's Pine Script platform.

Trap Zone 2 minTrap Zone 2 Min — Visual Detection of Trap and Expansion Zones
This indicator is designed to clearly identify key price zones on lower timeframes, particularly the 2-minute chart. It's ideal for scalpers and intraday traders looking for structured, high-probability setups.
Trap Zone (No Trade Zone)
A central shaded area where trading is discouraged.
Marks potential liquidity traps or manipulation zones.
Calculated using recent highs, lows, and moving averages (MA20 and MA200).
Zones + and -
Positioned two times the size of an EB (Elephant Bar) above and below the trap zone.
Represent the first expansion level.
Useful for identifying potential long or short entries based on price breakout direction.
Zones ++ and --
Extend from the first + or - level to the next line outward.
Represent a second expansion layer, often aligning with price continuation or reaction zones.
Helpful for profit-taking or adjusting risk.
Zones +++ and ---
The most extreme levels plotted.
Serve as final take-profit areas or potential reversal zones.
Additional Features
Optional display of MA20 and MA200.
Configurable ADR (Average Daily Range) labels.
Full visual customization for better chart integration.
Best For
Scalpers and intraday traders.
Identifying and reacting to structured market zones.
Mapping price expansions and potential reversal points.

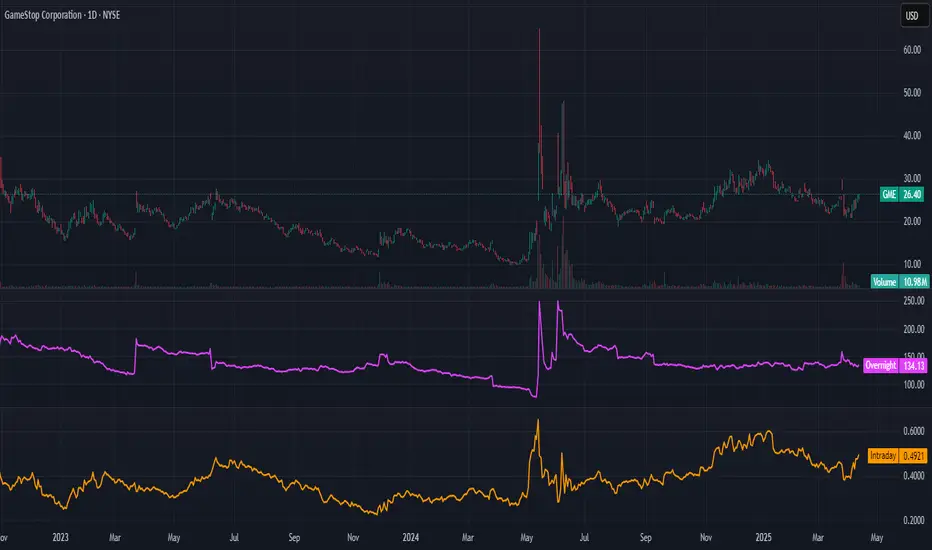
Intraday vs Overnight Change TrackerThis indicator tracks a synthetic price path based on either intraday or overnight return behavior, allowing users to analyze which component of daily price movement is contributing more to long-term performance.
***THIS INDICATOR ONLY WORKS ON THE DAILY TIMEFRAME***
Intraday mode compounds price change from market open to close: close / open
Overnight mode compounds price change from previous close to current open: open / close
The user can select one of these two modes using a dropdown input. The synthetic price series starts from the second bar of the chart and compounds forward bar-by-bar using the selected return type. The result is a line that reflects cumulative return based solely on either intraday or overnight activity.
⚙️ Inputs
Synthetic Price Type: Select between "Intraday" or "Overnight" to visualize the respective compounded price series.
📈 Usage Notes
This indicator is intended for visual comparison of intraday vs. overnight price dynamics over time. It can be useful for identifying behavioral patterns, session-based return anomalies, or testing session bias strategies.
Only one synthetic line is shown at a time based on user selection.
If you want to view both intraday and overnight lines, then you can add the indicator twice, which is shown above.
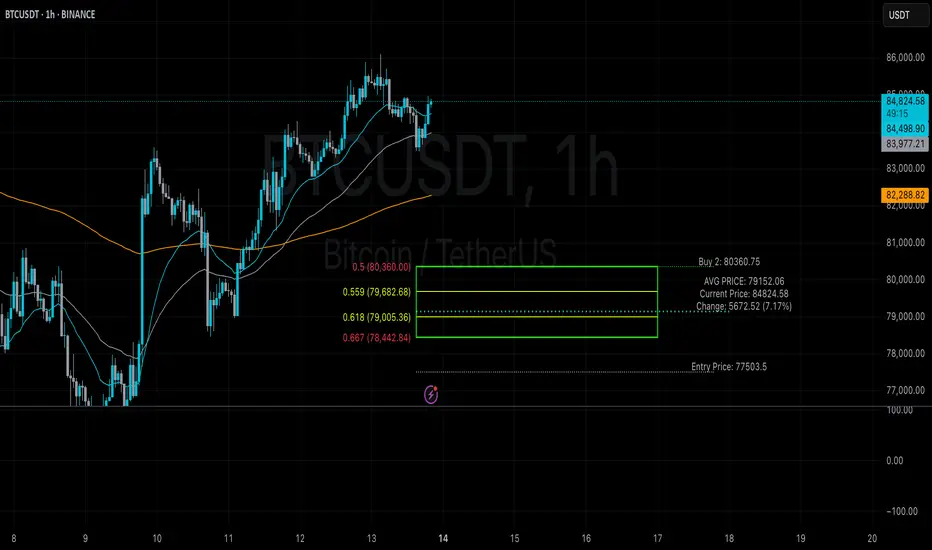
Average Entry Price Calculator# Average Entry Price Calculator
This powerful indicator helps you track your average entry price across multiple positions, displaying it clearly on your chart with customizable lines and labels.
## Features:
• Calculate average entry price for up to 5 different positions
• Display current price and profit/loss calculations
• Show percentage and absolute change from your average entry
• Customizable line styles, colors, and label positions
• Track your entry prices with clear visual references
## How It Works:
Enter your position details (entry price and amount in USDT), and the indicator will calculate your average entry price, displaying it as a horizontal line on your chart. The indicator also shows your individual entry prices as separate lines, making it easy to visualize your overall position.
## Perfect For:
• DCA (Dollar-Cost Averaging) strategies
• Position tracking across multiple entries
• Risk management and profit taking
• Visualizing entry zones on your chart
## Instructions:
1. Add the indicator to your chart
2. Enter your position details (price and amount)
3. Customize the visual appearance as needed
4. Use the displayed average entry line for decision making
All calculations are done locally in your browser - no sensitive data is transmitted or stored.
Enjoy more informed trading decisions with this essential position tracking tool!
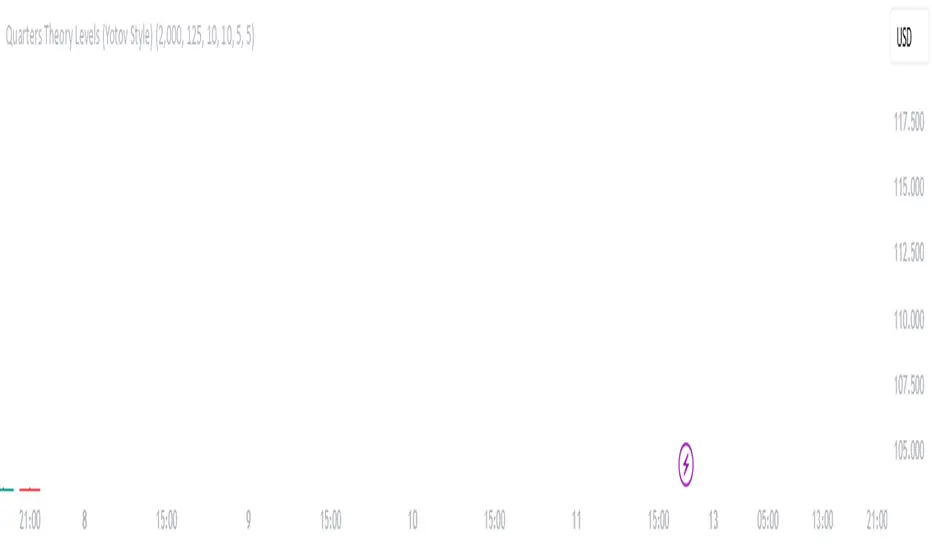
Quarters Theory Levels (Yotov Style)John Alex Sagwe's Quarters Theory Levels Script
This Pine Script, developed by John Alex Sagwe, is based on the concept of the "Quarters Theory" popularized by Illan Yotov. It aims to help traders identify key levels in the market using whole, half, and quarter-level calculations. The script plots major whole levels, half levels, and quarter levels above and below the current price, allowing traders to visualize potential price points where significant market action might occur.
The customizable parameters allow you to:
Set the base level and step size (for quarter levels),
Adjust the number of levels above and below the current price to be displayed,
Toggle between showing whole, half, or quarter levels,
Use price alerts when the market price nears these levels.
Whether you’re a novice or an experienced trader, this script can help you integrate the Quarters Theory into your trading strategy. It’s designed to be flexible and user-friendly, helping you visualize key market levels with ease.
Developed by: John Alex Sagwe, an avid trader and Pine Script enthusiast.
ScalpSwing Pro SetupScript Overview
This script is a multi-tool setup designed for both scalping (1m–5m) and swing trading (1H–4H–Daily). It combines the power of trend-following , momentum , and mean-reversion tools:
What’s Included in the Script
1. EMA Indicators (20, 50, 200)
- EMA 20 (blue) : Short-term trend
- EMA 50 (orange) : Medium-term trend
- EMA 200 (red) : Long-term trend
- Use:
- EMA 20 crossing above 50 → bullish trend
- EMA 20 crossing below 50 → bearish trend
- Price above 200 EMA = uptrend bias
2. VWAP (Volume Weighted Average Price)
- Shows the average price weighted by volume
- Best used in intraday (1m to 15m timeframes)
- Use:
- Price bouncing from VWAP = reversion trade
- Price far from VWAP = likely pullback incoming
3. RSI (14) + Key Levels
- Shows momentum and overbought/oversold zones
- Levels:
- 70 = Overbought (potential sell)
- 30 = Oversold (potential buy)
- 50 = Trend confirmation
- Use:
- RSI 30–50 in uptrend = dip buying zone
- RSI 70–50 in downtrend = pullback selling zone
4. MACD Crossovers
- Standard MACD with histogram & cross alerts
- Shows trend momentum shifts
- Green triangle = Bullish MACD crossover
- Red triangle = Bearish MACD crossover
- Use:
- Confirm swing trades with MACD crossover
- Combine with RSI divergence
5. Buy & Sell Signal Logic
BUY SIGNAL triggers when:
- EMA 20 crosses above EMA 50
- RSI is between 50 and 70 (momentum bullish, not overbought)
SELL SIGNAL triggers when:
- EMA 20 crosses below EMA 50
- RSI is between 30 and 50 (bearish momentum, not oversold)
These signals appear as:
- BUY : Green label below the candle
- SELL : Red label above the candle
How to Trade with It
For Scalping (1m–5m) :
- Focus on EMA crosses near VWAP
- Confirm with RSI between 50–70 (buy) or 50–30 (sell)
- Use MACD triangle as added confluence
For Swing (1H–4H–Daily) :
- Look for EMA 20–50 cross + price above EMA 200
- Confirm trend with MACD and RSI
- Trade breakout or pullback depending on structure

Market Session StrategyMarket Session Strategy Indicator Explanation
This is a TradingView Pine Script indicator called "Market Session Strategy" that monitors different market sessions and generates trading signals based on pattern analysis between sessions. Let me break down how it works:
Core Functionality
The indicator divides the trading day into three sessions:
Pre-Market (7:30 PM - 3:00 AM ET by default)
Regular Market (3:00 AM - 9:30 AM ET by default)
After Hours (9:30 AM - 4:00 PM ET by default)
For each session, it:
Tracks price action (open, high, low, close)
Calculates range percentages
Identifies session bias (bullish or bearish)
Draws visual session boxes on the chart
Generates trading signals based on historical patterns
Signal Generation Methodology
The indicator generates BUY/SELL signals at the beginning of the Regular Market and After Hours sessions using three main strategies:
1. Trend Continuation/Reversal Analysis
The script tracks how often a bullish/bearish trend in one session continues or reverses in the next session. For example:
If pre-market trends historically continue into regular hours 70% of the time and today's pre-market is bullish, it may generate a BUY signal.
If reversals are more common, it may generate a counter-trend signal.
2. Tight Range Breakout Signal
The indicator identifies "tight range" sessions (where price movement is unusually constrained compared to recent averages). A tight range with a bullish bias generates a BUY signal, while a bearish bias generates a SELL signal.
3. Day of Week Pattern Analysis
The script analyzes which days of the week show stronger trend continuation probabilities. If a particular day (like Monday) historically shows strong trend continuation and the threshold is met, it generates a signal accordingly.
Visual Components
The indicator provides several visual elements:
Colored session boxes showing high/low ranges
Signal labels at entry points
Session background colors with high transparency
A comprehensive dashboard showing session status, range percentages, bias, and signals
Performance Tracking
The script tracks trade success by session and day of week, which helps refine future signals. A trade is considered successful if:
A BUY signal is followed by a close higher than open
A SELL signal is followed by a close lower than open

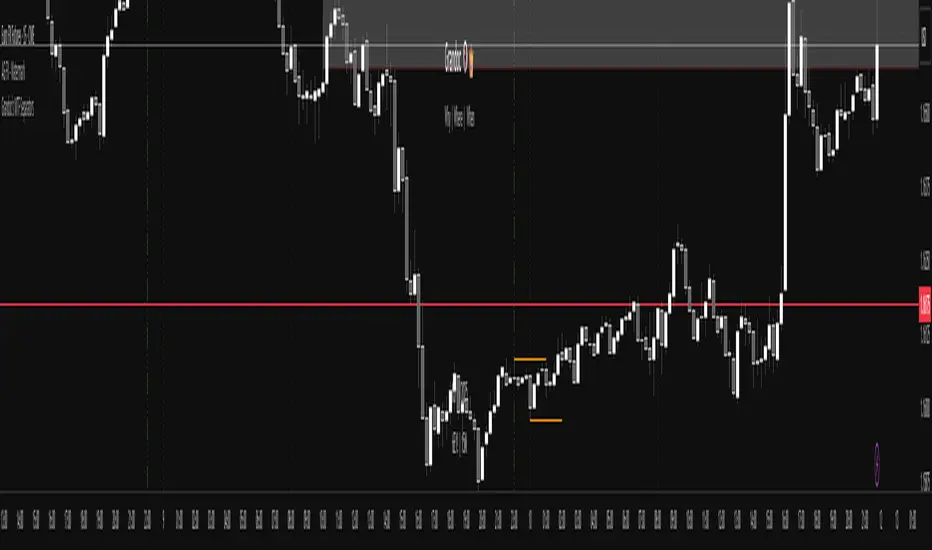
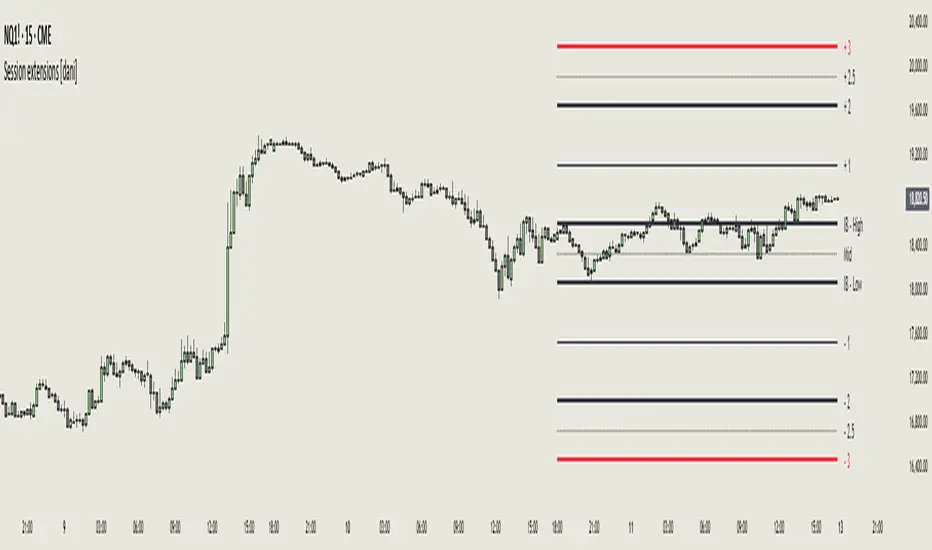
Session extensions [dani]Session Extension
Indicator Description
The Session Extensions indicator is a customizable tool designed to visually represent key price levels during a specified trading session. It calculates and displays the high, low, and midpoints of the session, along with extension levels based on user-defined multipliers. These extensions help traders identify potential support and resistance zones beyond the initial session range.
This indicator is particularly useful for intraday traders who rely on session-based analysis to make informed decisions. It overlays directly on the chart, ensuring seamless integration with price action.
Key Features
Session-Based Analysis : Tracks and highlights key price levels (high, low, midpoint) during a specific trading session.
Customizable Extension Levels : Allows users to define up to six extension levels (both above and below the session range) with unique multipliers, colors, styles, and widths.
Real-Time Updates : Automatically updates during the active session and resets at the start of a new session.
Usage Guidelines
Add the Indicator to Your Chart : Apply the Session Extensions indicator to your chart to visualize key session-based levels.
Intraday Focus : This indicator is optimized for intraday trading. Ensure that the chart's timeframe is set to an intraday interval (e.g., 1-minute, 5-minute).
Session Alignment : Verify that the session time aligns with your trading schedule and timezone. Misalignment may result in incorrect session detection. (This indicator use America - New York timezone)
Avoid Overcrowding : While the indicator supports multiple extension levels, enabling too many levels simultaneously may clutter the chart. Use discretion when configuring extension levels.
Customize Line Styles and Colors : Tailor the appearance of lines and labels to align with your trading style. Use solid, dashed, or dotted lines, and choose colors that enhance visibility without cluttering the chart.
Combine with Other Tools : Pair this indicator with other technical analysis tools (e.g., moving averages, volume profiles) to enhance decision-making.
Disclaimer & Chat
The Session Extensions indicator is intended for educational and analytical purposes only. It does not provide financial advice or guarantee trading success. Users are responsible for verifying the accuracy of session times and ensuring proper configuration before using the indicator in live trading. This indicator is not a trading signal generator.
Thank you for choosing this indicator! I hope it becomes a valuable part of your trading toolkit. Remember, trading is a journey, and having the right tools can make all the difference. Whether you're a seasoned trader or just starting out, this indicator is designed to help you stay organized and focused on what matters most—price action. Happy trading, and may your charts be ever in your favor! 😊
From, Dani.
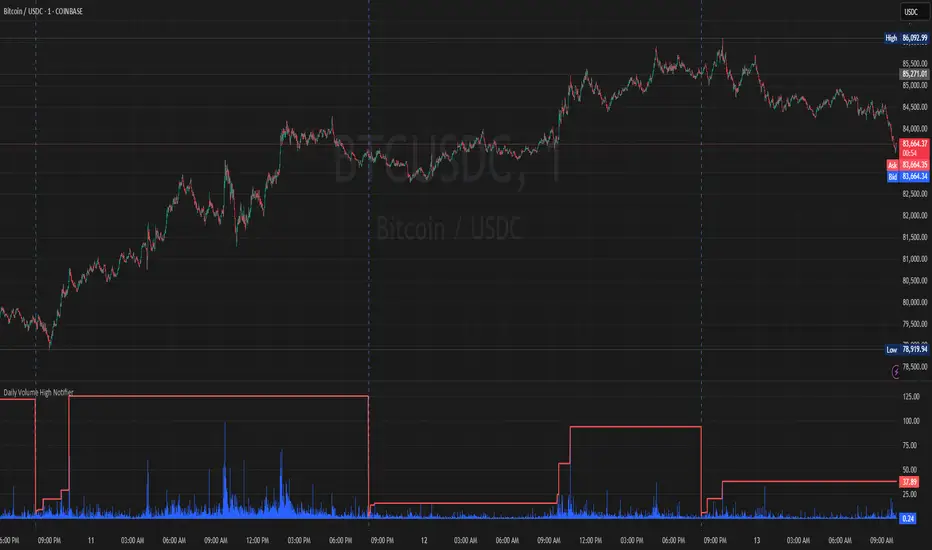
Daily Volume High Notifier📜 Script Description – Daily Volume High Notifier
This indicator monitors trade volume and sends an alert whenever a new daily high in volume is reached. The high volume is reset at the beginning of each trading day, allowing traders to stay informed of significant intraday volume spikes.
🛠️ Features:
Tracks the highest trade volume for the current day.
Resets the volume high tracker at the start of each new day.
Sends a real-time notification (alert()) whenever a new volume high is detected.
Useful for identifying unusual activity, potential breakouts, or institutional participation.
📊 Visual Elements:
Blue histogram for standard volume.
Red line showing the current day’s highest volume so far.
🔔 How to Use:
Add the script to any chart.
Enable alerts using the built-in alert() function.
Receive notifications every time volume hits a new high for the day.
🔔 Setting up Alerts in TradingView:
After adding this indicator to your chart:
Click the Alarm Clock (Alerts) icon.
Set condition: Daily Volume High Notifier → alert() function call .
Choose your alert type (app notification, email, popup, etc.).
Name it something like "Volume High Alert" and hit Create.
This tool is ideal for day traders, scalpers, and volume-based strategy traders who want to be instantly notified of spikes in market activity.
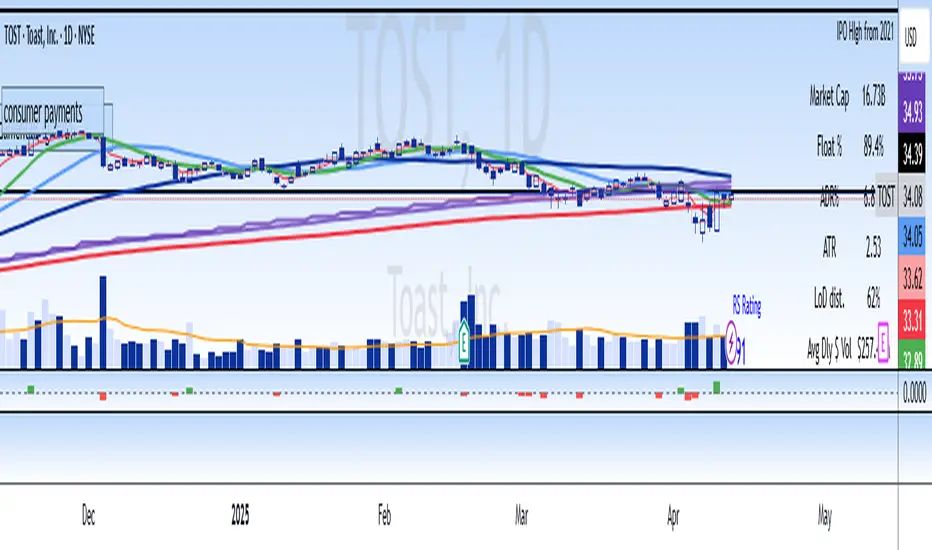
Stockbee 4% DaysStockbee 4% / -4% identifier. Helps with depicting mom bursts in either direction. I find it particularily helpful when I am looking to determine tightness and quality of a consolidation. You don't want more than one -4% day in a quality consolidation before a breakout.
RSI in pane and 3 EMAs on chartCustom RSI in Pane + 3 EMAs on Chart — with Optional RSI Divergence Detection
Combines RSI in a separate pane with 3 EMAs on the chart and optional RSI-based divergence detection. Useful for analyzing both momentum and trend structure.
Features
RSI Pane
Custom RSI calculation (not built-in ta.rsi) with adjustable source and length
Overlay optional moving average (SMA, EMA, SMMA/RMA, WMA, VWMA, or Bollinger Bands) Overbought/oversold gradient fill for visual clarity (70 / 30 zones)
Midline (50) for neutral RSI territory
RSI Divergence Detection
Optional: toggle on/off with one input
Regular Bullish Divergence : Price makes a lower low, RSI makes a higher low
Regular Bearish Divergence : Price makes a higher high, RSI makes a lower high
Customizable lookback for pivot detection
Visual markers and labels plotted on RSI
Built-in alert conditions for both divergence types
3 EMA Trend Indicators on Price Chart
Three customizable EMAs (default: 20, 50, 200)
Color-coded and clearly plotted on main chart
Use to determine short/mid/long-term trend bias
No repainting or smoothing artifacts
Why use this script?
Gives a full view of trend + momentum without cluttering the main price chart, and it helps confirm entries and exits by observing RSI behavior alongside EMAs. The optional divergence detection can act as a signal for potential exhaustion or reversal (not entry signals on their own). It is a Good fit for traders who use RSI zones, divergences, and EMA structure in their decision-making, both for intra-day and swing trades (where it performs best).
How to use
Add this script to your chart. EMAs will appear on the main price chart; RSI and divergence will appear in a separate pane.
Adjust RSI and MA settings to fit your trading style (e.g., fast RSI for scalping, slower for swing)
Enable "Show Divergence" if you want visual alerts and markers
Use alerts to get notified when a divergence occurs without watching the chart
Always check the divergences on different time frames to validate the setup, and do not consider them valid on small time frames (<15 minutes).
Built for traders who want both momentum and trend context in a single tool — without clutter, repainting, or noise. I created this script to streamline my own analysis and avoid switching between multiple indicators. It's not meant to be a "signal generator" but a visual assistant for making better decisions. If you find it useful or have feedback, feel free to reach out.

Step-Based Trailing Stop-Loss IndicatorThis indicator is built for momentum traders who want to maximize winning trades and minimize losses through a smart, step-based trailing stop-loss system. Instead of using a fixed Take Profit, this tool dynamically protects profits once the trade reaches a favorable RR (Risk-to-Reward) level.
How It Works:
Manual Entry Input
You enter your Entry Price and select Buy/Sell in the settings.
This flexibility allows backtesting or live trade tracking.
Initial Setup
Default SL: 50 ticks(Tested on us30,but works on any pair you just need to adjust SL)
TP for reference: 4R — can be used for benchmarking, but we don't limit profits with a hard TP.
Trailing Logic
Once price reaches 3R in profit:
The SL begins trailing.
It starts at 2R, keeping a 1R cushion behind the max profit.
For every 0.5R gain, SL also moves up by 0.5R:
Example: At 3.5R → SL is at 2.5R
At 5.0R → SL is at 4.0R
This trailing continues until the SL is hit or the trend exhausts.
Chart Features
🟧 Entry Line
🔴 Initial SL
🟢 Reference TP (4R, optional)
🟣 Dynamic Trailing SL
🏷️ Labels for Entry & SL levels

Consecutive Small CandlesThis script identifies relatively "small" candles based on their being smaller than a maximum size you set based on the instrument and your own criteria. Default is 5, as I use this indicator largely on CL which rarely has candles smaller than 3 ticks but frequently greater than 5.
It identifies 2 or more consecutive candles to help identify patterns similar to Bob Volman's Double Doji Break methodolgy. Written by Grok 3.

H4 Cross + LTF Candle Alignment (Short Lines)H4 Cross + LTF Candle Alignment (Short Lines)
This indicator identifies potential trade opportunities by combining two key conditions:
The current H4 candle crosses above or below the previous H4 candle's high or low.
On a lower timeframe (like 5 minutes), the price shows two consecutive candles moving in the same direction (bullish for long, bearish for short).
Once these conditions align, a short entry line is drawn on the chart and an alert is triggered, providing an early signal for potential price movements. Perfect for traders looking to capture trend continuation with a clear visual marker and timely alerts.

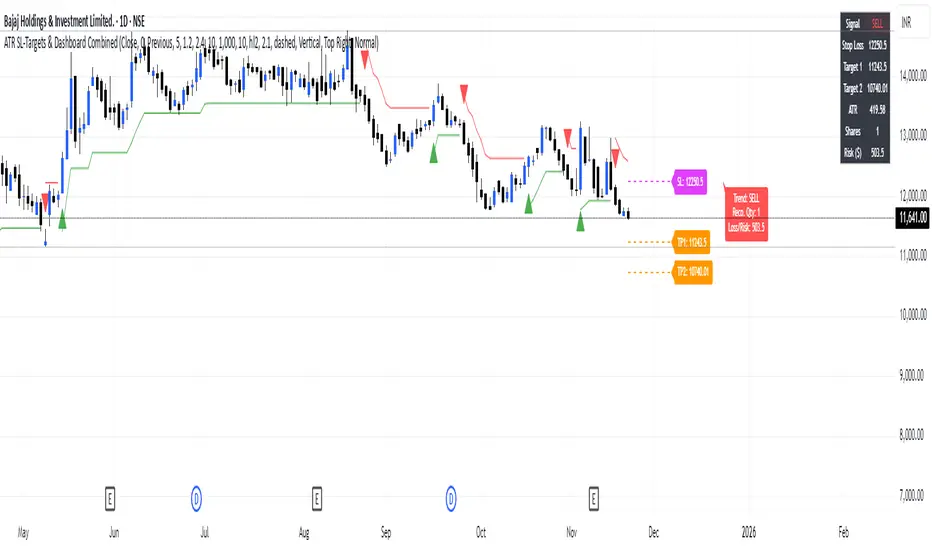
ATR Stop-Loss & TargetsATR and Supertrend-based SL/TP & Trailing System
This indicator combines Average True Range (ATR) and Supertrend logic to help traders define precise stop-loss, first target, and trailing stop-loss (TSL) levels.
⚙️ Key Features:
📏 ATR-based Stop-Loss & Target Lines:
Uses ATR (default period: 5) based on the previous day's candle for more stable risk management.
Traders can choose the price source: Close, Open, or enter a manual price.
SL and first target are calculated using multipliers:
Multiplier 1 = Stop Loss
Multiplier 2 = First Target
📉 Supertrend for Trailing Stop:
Built-in Supertrend logic for trailing stop-loss management.
Uses ATR(10) with a multiplier of 2.1, based on HL2.
Supertrend can be toggled ON/OFF from the settings.
Win-Loss Streak PlotterWin-Loss Streak Plotter
This indicator tracks the win/loss streaks of moving average crossovers (using simple moving averages for illustration purposes). It calculates the price change after each crossover, marking each as a win (green) or loss (red). The win rate is shown separately.
Inputs:
Source: Price series (default: open)
Fast MA: Fast moving average (default: open)
Slow MA: Slow moving average (default: open)
Total Crosses to Analyze: Number of crossovers to track
Crosses per Row: Number of crossovers per row in the table
Output:
A table displays each crossover’s result (win/loss).
A separate win rate table shows the percentage of wins.
Suggestions are always welcomed!
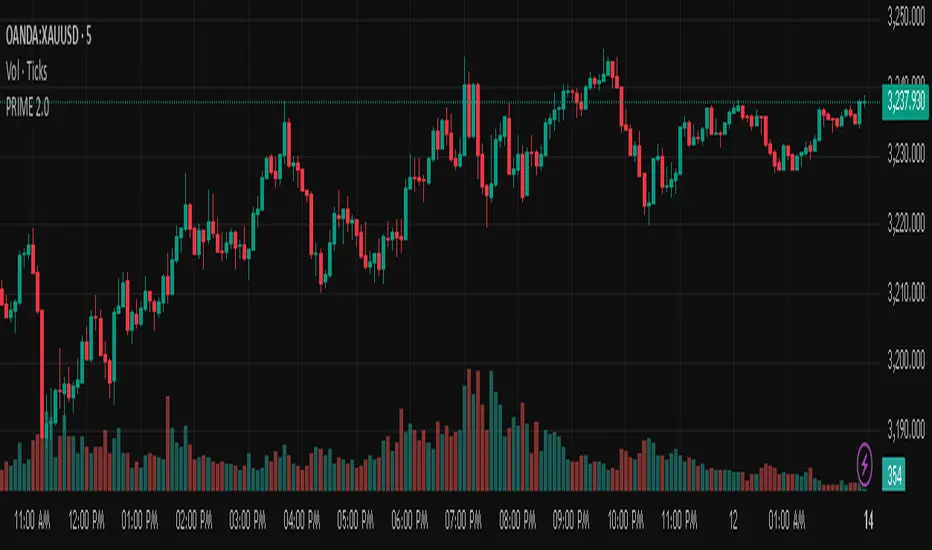
PRIME 2.0PRIME 2.0 — Precision Entry Tool
PRIME 2.0 is a smart price action-based indicator designed for intraday traders who want to catch high-probability moves during the London session. It uses a combination of market structure shifts (CHOCH – Change of Character) and session-based timing to identify potential entries.
🔍 Key Features:
Session-Based Logic: Activates after the London market opens, filtering noise from other sessions.
CHOCH Detection: Spots shifts in market structure by identifying crossover and crossunder of candle highs/lows.
Visual Entry Points: Plots real-time entry points based on structure change.
🧠 Who Is It For?
Scalpers and day traders
Traders who follow Smart Money Concepts (SMC)
Anyone looking to improve entry precision without clutter
⚠️ Disclaimer:
This indicator does not generate buy/sell signals or exit points. It is meant to be used as a tool within a broader trading strategy. Combine it with your own risk management and market knowledge for best results
Candlestick Pattern Indicator – Doji, Harami, More [algo_aakash]This Candlestick Pattern Indicator is designed to help traders identify key price action patterns like Bullish Engulfing, Bearish Engulfing, Doji, Hammer, Morning Star, Evening Star, and many more directly on your TradingView chart. With customizable options to display both bullish and bearish patterns , this indicator provides real-time visual markers and labels, helping you make informed trading decisions.
Key features of the indicator include:
Detects popular candlestick patterns such as Bullish Engulfing, Bearish Engulfing, Hammer, Morning Star, Tweezer Tops, and more.
Customizable settings for displaying pattern shapes, labels, and opacity, tailored to your trading preferences.
Option to plot signals only after a candle closes, ensuring accuracy.
Alerts for immediate notification of detected patterns.
Visual markers on the chart, including arrows and labels, for quick recognition of potential trade setups.
This indicator is ideal for traders who rely on candlestick patterns for technical analysis and want an automated tool to highlight these setups for easier decision-making.
Whether you're a beginner or an experienced trader, this tool will help you spot important patterns in real-time without cluttering your chart.
