Rally Sweep Volume RSVChecks for 3-6 consecutive candle rally, sweep of the low/high of the rally, and closes with more volume then prior candle.
Indicators and strategies

Katsu mtf RSI CloudKatsu MTF RSI and Cloud
Multi-timeframe RSI-based analytical tool for advanced traders
The Katsu MTF RSI is a sophisticated indicator that combines two RSI signals from different timeframes into one powerful toolkit. It’s perfect for those looking for multi-timeframe confluence to make more precise trading decisions.
Key Features:
Dual RSI Setup (fully customizable timeframe and length):
The first RSI behaves in a traditional way.
The second RSI uses color-coding to visually indicate the dominant trend direction:
🟢 Green = Bullish, 🔴 Red = Bearish.
RSI EMA – Smoothed RSI Average:
Used to determine short-term direction. This moving average is essential for crafting entries and forming your overall trading strategy.
Dynamic Midline – Adaptive Overbought/Oversold Levels:
The overbought/oversold zones are not fixed (like 70/30), but are dynamically adjusted based on the RSI’s average behavior.
When RSI touches these adaptive levels, a small blue arrow appears, signaling a potential momentum shift.
This provides more precise signals than traditional static thresholds (e.g., 70/30 or 80/20).
RSI-Based Cloud Visualization:
The RSI is used to generate a visual cloud that reflects market structure:
When RSI breaks out above the cloud, followed by RSI2, it can signal a strong entry point.
When RSI enters the cloud and reverses, it may indicate a potential exit or reversal zone.
The cloud uses three distinct colors to represent momentum:
Green: RSI is above the cloud → Strong bullish pressure, price well above the trend zone.
Red: RSI is below the cloud → Strong bearish pressure, price well below the trend zone.
Yellow: RSI is inside the cloud → Sideways or corrective move, often a potential exit zone, as the trend may be stalling.
Visual Momentum Feedback (Background Highlight):
The background color shifts to indicate whether RSI is moving above or below 50, giving a quick read on bullish or bearish momentum.
This indicator is especially powerful for multi-timeframe strategies where entries are made on a lower timeframe, but confirmation comes from a higher one. It provides a dynamic, visual framework to stay in sync with the market’s rhythm.

10 vs 50 SMA - Long-Only CrossoverEnters a full-size long when the 10-period simple moving average crosses above the 50-period on the chart’s current timeframe; closes the position on the opposite cross. A green “Long” label marks each entry bar.

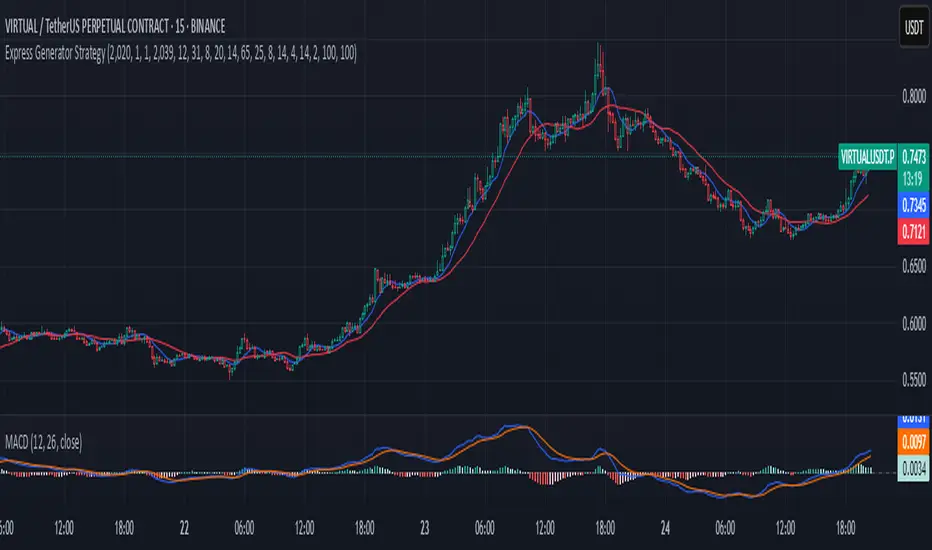
Express Generator StrategyExpress Generator Strategy
Pine Script™ v6
The Express Generator Strategy is an algorithmic trading system that harnesses confluence from multiple technical indicators to optimize trade entries and dynamic risk management. Developed in Pine Script v6, it is designed to operate within a user-defined backtesting period—ensuring that trades are executed only during chosen historical windows for targeted analysis.
How It Works:
- Entry Conditions:
The strategy relies on a dual confirmation approach:- A moving average crossover system where a fast (default 9-period SMA) crossing above or below a slower (default 21-period SMA) average signals a potential trend reversal.
- MACD confirmation; trades are only initiated when the MACD line crosses its signal line in the direction of the moving average signal.
- An RSI filter refines these signals by preventing entries when the market might be overextended—ensuring that long entries only occur when the RSI is below an overbought level (default 70) and short entries when above an oversold level (default 30).
- Risk Management & Dynamic Position Sizing:
The strategy takes a calculated approach to risk by enabling the adjustment of position sizes using:- A pre-defined percentage of equity risk per trade (default 1%, adjustable between 0.5% to 3%).
- A stop-loss set in pips (default 100 pips, with customizable ranges), which is then adjusted by market volatility measured through the ATR.
- Trailing stops (default 50 pips) to help protect profits as the market moves favorably.
This combination of volatility-adjusted risk and equity-based position sizing aims to harmonize trade exposure with prevailing market conditions.
- Backtest Period Flexibility:
Users can define the start and end dates for backtesting (e.g., January 1, 2020 to December 31, 2025). This ensures that the strategy only opens trades within the intended analysis window. Moreover, if the strategy is still holding a position outside this period, it automatically closes all trades to prevent unwanted exposure.
- Visual Insights:
For clarity, the strategy plots the fast (blue) and slow (red) moving averages directly on the chart, allowing for visual confirmation of crossovers and trend shifts.
By integrating multiple technical indicators with robust risk management and adaptable position sizing, the Express Generator Strategy provides a comprehensive framework for capturing trending moves while prudently managing downside risk. It’s ideally suited for traders looking to combine systematic entries with a disciplined and dynamic risk approach.

Advanced Cumulative Delta & VolumeAdvanced Cumulative Delta & Volume (Heuristic-Based)
This offers a powerful cumulative delta visualization based on price action heuristics—perfect for traders without access to real bid/ask volume data.
Features
Cumulative Delta Calculation
Built using estimated delta (based on close position and volume).
Includes a moving average-based surge detection system.
Surge Detection
Highlights candles where delta exceeds a multiple of its average.
Detects sustained surges across multiple bars for trend confirmation.
Visual Enhancements
Smoothed line and area chart for delta flow
Alternate background shading (light blue) for each timeframe interval—great for visual structure (e.g., every 30 minutes).
Color-coded:
Yellow for bullish surges
Black for bearish surges
Green for positive delta /red for negative delta
Customizable Inputs
Timeframe (for resampling logic)
Surge thresholds
Delta moving average length
Volume weight adjustment
Sustained bar count
Ideal For:
Order flow enthusiasts without premium data feeds
Scalpers & intraday traders
Anyone wanting a visual edge on volume-driven moves
ORB PRO | Buy & Sell | Dutch RoyalORB PRO | Buy & Sell
A turnkey Opening-Range Breakout solution that gives you breakout entries, multi-level exits, risk controls, on-chart analytics and instant backtesting—all configurable through easy dropdowns and sliders.
What You Get
Automatic Opening-Range Detection
Pick your “ORB” window (from 15 min up to 4 hr) and the indicator draws the high/low lines and shaded box for you.
Smart Breakout & Entry Logic
Choose whether to use the raw close price or an EMA for your breakout trigger.
Specify how many false–breakout retests to ignore before taking your signal.
Watch a “Buy” or “Sell” label appear exactly where your entry fires.
Three-Tier Take-Profits
Dynamic Mode: First TP at X % move; TP 2 and TP 3 at additional Y % increments.
ATR Mode: TP levels at configurable multiples of current ATR (e.g. 0.75×, 1.5×, 2.25×).
Flexible Stop-Loss Options
None (no stop at all)
Fixed % below/above entry
Safer, Balanced, or Risky price levels based on your opening range geometry
Adaptive SL toggle: automatically move your stop to breakeven once TP 1 hits
Clean Visual Controls
Turn the ORB box, historical zones, and EMA line on or off
Customize all colors and transparency with built-in pickers
No extra drawing tools required—everything lives in one indicator
Live On-Chart Dashboard
A small, movable table shows your current signal (Bullish/Bearish), entry price, real-time profit %, plus the next TP & SL levels
Perfect for seeing exactly where you stand without manual math
Instant Backtesting Summary
View total sessions, win/loss counts, win-rate, average & total profit %
Choose how much capital you “allocate” to each TP level with preset exit-ratio options (e.g. 90 %→TP 1, 5 %→TP 2, 5 %→TP 3)
Alert-Ready
Built-in alert conditions for Entry, Take-Profit, and Stop-Loss make it trivial to hook into emails, webhooks or automated execution.
How to Configure
Once you add ORB PRO to your chart, open its Inputs pane. You’ll find logically grouped controls:
Trading Logic: ORB duration, breakout source (Close/EMA), retest count, EMA length, TP style (Dynamic/ATR), SL style (None/Fixed/Safer/Balanced/Risky), Adaptive SL.
TP / SL Values: percentage thresholds or ATR multipliers for each TP, plus your fixed-SL percentage if you choose it.
Visuals: toggles for drawing the ORB box, past zones, EMA; plus color & opacity selectors.
Analytics Tables: enable and position both the live dashboard and the backtesting summary, and pick your exit-ratio breakdown for historical P&L.
ORB PRO | Buy & Sell | Dutch Royal is a technical analysis tool provided for educational and informational purposes only. It does not constitute financial, investment, or trading advice. Past performance and backtesting results are not indicative of future outcomes, and all trading involves risk—including the possible loss of capital. Always do your own due diligence, consider your personal financial situation, and consult a qualified professional before placing any trades. By using this indicator you acknowledge that you alone are responsible for your trading decisions and results.

Average Candle Size OscillatorThis indicator calculates the average size of previous candles. You can determine how far back candles you want it to calculate.

NAS fx v70NAS fx v70 — Trend-Based Entry & Exit System
Description:
The NAS fx v70 is a powerful, trend-following indicator designed to simplify trade decisions by providing clear Buy and Sell signals based on price action dynamics.
📈 Features:
Trend-Following Logic: The indicator detects market direction using a custom price action model that adapts to short-term momentum.
Visual Trade Signals: Clear Buy (green) and Sell (red) labels directly on the chart.
Dynamic Support & Resistance Lines: A green trail supports long trends and a red trail follows short trends.
TP & SL Zones: Automatic display of take-profit (TP) and stop-loss (SL) levels upon entry.
Optimized for Scalping and Intraday Trading: Works best on lower timeframes (1m–15m), especially for indices like US30, NAS100, etc.
🔧 How to Use:
Buy Signal: When a green "Buy" label appears and the trend line switches to green.
Sell Signal: When a red "Sell" label appears and the trend line switches to red.
Exit: You can close the trade when the opposite signal appears or when TP is hit.
This indicator is suitable for both beginner and professional traders who prefer price action and trend-based strategies. It filters out market noise and provides a structured entry/exit system that can be integrated into any trading plan.

RSI-WMA + EMA Trend Filter | SL/TP DynamicVery simple base on the trend from EMA and the signal-trigger from RSI-WMA

SMA's e VWAP BELOTTOENGLISH:
This script loads 3 Moving Averages and Daily VWAP:
9 periods (Black Color),
20 periods (Royal Blue Color),
200 periods (Red Color)
Daily VWAP (Gray Color)
The colors can be changed in the settings.
===

Elliott Wave + Fibonacci Strategy (Long Only)This closed-source long-only swing strategy combines Elliott Wave principles with Fibonacci-based price projections and RSI momentum confirmation. It is designed to capture impulsive upward trends by identifying potential Wave 3 and Wave 5 setups within the Elliott Wave cycle. The strategy is both educational and practical for traders interested in systematic wave-based trading.
Core Logic Overview:
Wave Structure Detection
The script dynamically identifies potential Wave 1 lows and tracks Wave 2 retracements using pivot logic based on a configurable lookback (waveLen). It uses Fibonacci retracement ratios (default: 61.8%) to estimate the ideal Wave 2 correction.
Wave 3 Entry Signal
A Wave 3 Long entry is triggered when the price exceeds both the Wave 2 high and a Fibonacci-based Wave 3 target extension (default: 1.618x the Wave 2 range), provided RSI is above 50 to confirm bullish momentum.
Wave 5 Entry Logic
After Wave 3, a second entry may trigger when the price surpasses the Wave 3 target by an additional 2%, and RSI is above 60 — suggesting a possible Wave 5 extension.
Exit Conditions
A potential ABC correction is detected when price drops below the Wave 3 target and RSI dips under 50, prompting exits.
Additional risk control exits occur if RSI exceeds 70 after entry, suggesting overbought conditions.
User Inputs:
Swing Pivot Lookback (waveLen) – Number of bars to consider for pivot detection (default: 10)
Fib Retracement (fibRetrace) – Controls the Wave 2 retracement level (default: 0.618)
Wave 3 Extension Target (fibExtension) – Projects the Wave 3 price target (default: 1.618)
RSI Period – Used for momentum confirmation (default: 14)
Backtest Conditions:
Account size: $10,000
Risk per trade: 10% of equity
Commission: 0.1%
Slippage: 1 tick
Backtest duration: 2 years
Sample size: 100+ trades depending on market conditions and timeframe used
Best Use Case:
Optimized for 1H to Daily charts in trending markets
Works best on assets showing clear impulsive structures (e.g., crypto, indices)
This strategy is intended to help traders learn and apply Elliott Wave theory in a structured and rule-based format. It avoids repainting by using confirmed swing highs/lows and gives clear visual signals for entries, exits, and targets.

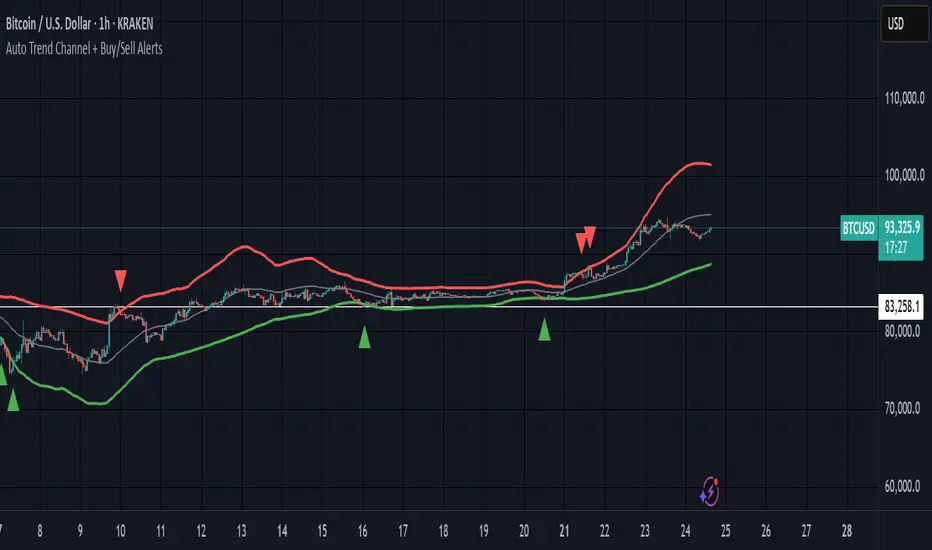
Auto Trend Channel + Buy/Sell AlertsThis indicator automatically detects trend channels using a linear regression line, and dynamically plots upper and lower channel boundaries based on standard deviation. It helps traders identify potential Buy and Sell zones with clear visual signals and customizable alerts.
💡 How It Works:
🧠 Regression-Based Channel: Calculates the central trend line using ta.linreg() over a user-defined length.
📏 Dynamic Boundaries: Upper and lower channel lines are offset by a multiplier of the standard deviation for precision volatility tracking.
✅ Buy Signals: Triggered when price crosses above the lower boundary — potential bounce entry.
❌ Sell Signals: Triggered when price crosses below the upper boundary — potential reversal exit.
🔔 Alerts Enabled: Get real-time alerts when price touches the channel lines.
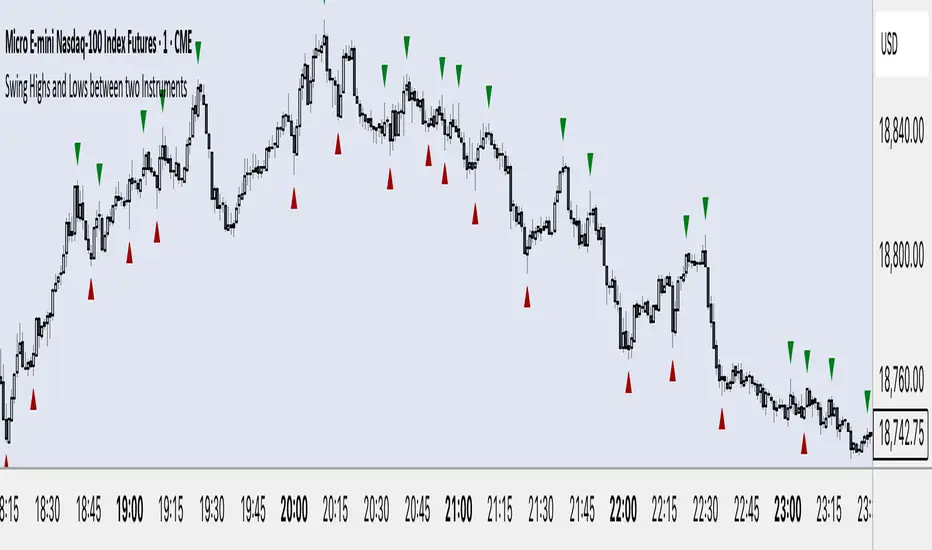
Swing Highs and Lows between two InstrumentsThis Indicator will show you common Swing Points between two different trading symbols.
You can also use it to display the Swing Points of the current symbol or another symbol only.
When applying the Indicator to your chart it will ask you to put in a symbol. This symbol is used to find common Swing Points against the symbol that you have on your screen. Should you decide not to choose any symbol the indicator will instead mark all Swing Points for the current symbol.
Settings
Symbol: Choose any symbol that you want to compare to the selected symbol on your screen.
Sensitivity: The sensitivity defines how many candles left and right of a Swing Point have to be below (Swing High) or above (Swing Low) in order for the Indicator to mark it. A lower sensitivity will give a lot more Swing points, whereas a higher sensitivity will show less, but more important Swing Points.
Equal Highs Permissible: When calculating where a Swing Point is you can decide how you want equal highs and equal lows to be handled. The default is set to "yes" which means equal highs will be counted as if they were below (Swing High) or above (Swing Low). Choosing "no" will alter the indicators behaviour and only mark a Swing Point if all values within the sensitivity are below (Swing High) or above (Swing Low). As equal highs/lows are not below/above the Swing Point, but at the same level it will not mark the Swing Point.
Options:
You can choose to display Swing Highs and Lows for each symbol individually as well as Common Swing Points, which is the default. If you choose to display different Swing Points at the same time the visual order of importance is the following: common Swing Points > current symbol Swing Points > second symbol Swing Points.
You can also change the symbols and colors that mark the Swing Points or restrict the timeframes that the Indicator works on.
MJJ122028: Reversed EMA 9/21/50 Crossover (Signals Only)The reverse 9/21/50 EMA crossover does the reverse of what a normal crossover would do in that if the lower EMA (9) crosses over the higher EMAs (21/50) it will signal a sell and vice versa. The thinking is that EMAs are a lagging indicator and in volatile markets by the time the EMAs cross the price action reverses. This was back tested and work best in the 10m TF.

ORB w/ Targets & NewsThis strategy is my interpretation of the ORB (opening range breakout) strategy.
It plots the opening range for the first 15 minutes of the RTH (regular trading hours) session, then plots this range and looks for the first 5m candle to close either above or below said range.
- If it closes above the range, then it should result in a LONG entry on the next candle.
- If it closes below the range, then it should result in a SHORT entry on the next candle.
The user has the option also of:
- Changing the timeframe where trades can occur.
- using BE+ (breakeven plus)
- using TSL (trailing stop loss)
- setting TP (take profit) as a percentage of the opening range.
SL (stop loss) is fixed at 55% of opening range (might change this in future revisions).
- Choosing to block trading before/after various impact news events.
- Blocking most news events (use at your own risk).
- Setting a MIN/MAX ATR range for filtering out low/high volatility.
- All kinds of debug filters to aid in backtesting (optimal settings will change over time).
- and more...
...and MANY more options.
Please note that (for now) this strategy is invite only and provided to members of the GOAT Algo System (at no charge), link here:
whop.com
(detail about how to subscribe are included there)
I am not an administrator of that system, but am myself a subscriber, and am providing this at no charge as a way to contribute to the group.

SynchroTrend Oscillator (STO) [PhenLabs]📊 SynchroTrend Oscillator
Version: PineScript™ v5
📌 Description
The SynchroTrend Oscillator (STO) is a multi-timeframe synchronization tool that combines trend information from three distinct timeframes into a single, easy-to-interpret oscillator ranging from -100 to +100.
This indicator solves the common problem of having to analyze multiple timeframe charts separately by consolidating trend direction and strength across different time horizons. The STO helps traders identify when markets are truly synchronized across timeframes, potentially indicating stronger trend conditions and higher probability trading opportunities.
Using either Moving Average crossovers or RSI analysis as the trend definition metric, the STO provides a comprehensive view of market structure that adapts to various trading strategies and market conditions.
🚀 Points of Innovation
Triple-timeframe synchronization in a single view eliminates chart switching
Dual trend detection methods (MA vs Price or RSI) for flexibility across different markets
Dynamic color intensity that automatically increases with signal strength
Scaled oscillator format (-100 to +100) for intuitive trend strength interpretation
Customizable signal thresholds to match your risk tolerance and trading style
Visual alerts when markets reach full synchronization states
🔧 Core Components
Trend Scoring System: Calculates a binary score (+1, -1, or 0) for each timeframe based on selected metrics, providing clear trend direction
Multi-Timeframe Synchronization: Combines and scales trend scores from all three timeframes into a single oscillator
Dynamic Visualization: Adjusts color transparency based on signal strength, creating an intuitive visual guide
Threshold System: Provides customizable levels for identifying potentially significant trading opportunities
🔥 Key Features
Triple Timeframe Analysis: Synchronizes three user-defined timeframes (default: 60min, 15min, 5min) into one view
Dual Trend Detection Methods: Choose between Moving Average vs Price or RSI-based trend determination
Adjustable Signal Smoothing: Apply EMA, SMA, or no smoothing to the oscillator output for your preferred signal responsiveness
Dynamic Color Intensity: Colors become more vibrant as signal strength increases, helping identify strongest setups
Customizable Thresholds: Set your own buy/sell threshold levels to match your trading strategy
Comprehensive Alerts: Six different alert conditions for crossing thresholds, zero line, and full synchronization states
🎨 Visualization
Oscillator Line: The main line showing the synchronized trend value from -100 to +100
Dynamic Fill: Area between oscillator and zero line changes transparency based on signal strength
Threshold Lines: Optional dotted lines indicating buy/sell thresholds for visual reference
Color Coding: Green for bullish synchronization, red for bearish synchronization
📖 Usage Guidelines
Timeframe Settings
Timeframe 1: Default: 60 (1 hour) - Primary higher timeframe for trend definition
Timeframe 2: Default: 15 (15 minutes) - Intermediate timeframe for trend definition
Timeframe 3: Default: 5 (5 minutes) - Lower timeframe for trend definition
Trend Calculation Settings
Trend Definition Metric: Default: “MA vs Price” - Method used to determine trend on each timeframe
MA Type: Default: EMA - Moving Average type when using MA vs Price method
MA Length: Default: 21 - Moving Average period when using MA vs Price method
RSI Length: Default: 14 - RSI period when using RSI method
RSI Source: Default: close - Price data source for RSI calculation
Oscillator Settings
Smoothing Type: Default: SMA - Applies smoothing to the final oscillator
Smoothing Length: Default: 5 - Period for the smoothing function
Visual & Threshold Settings
Up/Down Colors: Customize colors for bullish and bearish signals
Transparency Range: Control how transparency changes with signal strength
Line Width: Adjust oscillator line thickness
Buy/Sell Thresholds: Set levels for potential entry/exit signals
✅ Best Use Cases
Trend confirmation across multiple timeframes
Finding high-probability entry points when all timeframes align
Early detection of potential trend reversals
Filtering trade signals from other indicators
Market structure analysis
Identifying potential divergences between timeframes
⚠️ Limitations
Like all indicators, can produce false signals during choppy or ranging markets
Works best in trending market conditions
Should not be used in isolation for trading decisions
Past performance is not indicative of future results
May require different settings for different markets or instruments
💡 What Makes This Unique
Combines three timeframes in a single visualization without requiring multiple chart windows
Dynamic transparency feature that automatically emphasizes stronger signals
Flexible trend definition methods suitable for different market conditions
Visual system that makes multi-timeframe analysis intuitive and accessible
🔬 How It Works
1. Trend Evaluation:
For each timeframe, the indicator calculates a trend score (+1, -1, or 0) using either:
MA vs Price: Comparing close price to a moving average
RSI: Determining if RSI is above or below 50
2. Score Aggregation:
The three trend scores are combined and then scaled to a range of -100 to +100
A value of +100 indicates all timeframes show bullish conditions
A value of -100 indicates all timeframes show bearish conditions
Values in between indicate varying degrees of alignment
3. Signal Processing:
The raw oscillator value can be smoothed using EMA, SMA, or left unsmoothed
The final value determines line color, fill color, and transparency settings
Threshold levels are applied to identify potential trading opportunities
💡 Note:
The SynchroTrend Oscillator is most effective when used as part of a comprehensive trading strategy that includes proper risk management techniques. For best results, consider using the oscillator in conjunction with support/resistance levels, price action analysis, and other complementary indicators that align with your trading style.


MFF:Reversed EMA 9/21/50 CrossoverThis EMA crossover strategy does the reverse by selling when the lowest (9) crosses over the higher(21/50) EMAs and vice versa. The thinking is that EMAs are lagging and in volatile markets by the time normal signals arise price action reverses.

Volume USDTName:
USDT Volume Bars (Directional Colors)
Description:
This indicator visualizes trading volume in USDT by multiplying the candle's volume by the average of its open and close prices. The result reflects a more realistic estimation of the traded value per candle.
🟩 Green bars: Bullish or neutral candles (close ≥ open)
🟥 Red bars: Bearish candles (close < open)
Useful for spotting high-value inflows and outflows based on actual price-weighted volume.

Multi Scanner Plot & Table V1Here's how to interpret each column in the table:
Price vs MAs:
What it shows: Where the current price is relative to the short-term (e.g., 20-period) and long-term (e.g., 50-period) Simple Moving Averages (SMAs) calculated on your current chart's timeframe.
Interpretation:
Above Both (Green background): Price is above both the short and long MAs. Generally considered a bullish sign for the current trend.
Below Both (Red background): Price is below both MAs. Generally considered a bearish sign.
Mixed (Gray background): Price is between the two MAs (e.g., above the short but below the long, or vice-versa). Indicates indecision or a potential trend change.
RSI Value:
What it shows: The actual numerical value of the Relative Strength Index (RSI) calculated on your current chart's timeframe.
Interpretation: Just the raw RSI number (e.g., 65.32). The background is always gray. You compare this value to standard overbought/oversold levels (like 70/30) or the levels defined in the script's inputs.
RSI Status:
What it shows: Interprets the RSI Value based on the Overbought/Oversold levels set in the script's inputs (default 70/30). Calculated on your current chart's timeframe.
Interpretation:
Overbought (Red background): RSI is above the overbought level (e.g., > 70). Suggests the asset might be due for a pullback or reversal downwards. Red indicates a potentially bearish condition.
Oversold (Green background): RSI is below the oversold level (e.g., < 30). Suggests the asset might be due for a bounce or reversal upwards. Green indicates a potentially bullish condition.
Neutral (Gray background): RSI is between the oversold and overbought levels.
Last Sig Price:
What it shows: The price level where the last "SIG NOW" Buy or Sell signal occurred on your current chart's timeframe.
Interpretation: Helps you see the entry price of the most recent short-term signal generated by this script. The background color matches the signal type: Green for the last Buy signal, Red for the last Sell signal. N/A if no signal has occurred yet.
SIG NOW:
What it shows: This is the main short-term signal generated by the script based on conditions on your current chart's timeframe. It combines the "Price vs MAs" status and specific RSI conditions (price must be above/below both MAs and RSI must be within a certain range defined in the inputs).
Interpretation:
BUY (Green background): The specific buy conditions are met right now. (Price above both MAs AND RSI is strong but not necessarily overbought).
SELL (Red background): The specific sell conditions are met right now. (Price below both MAs AND RSI is weak but not necessarily oversold).
NEUTRAL (Gray background): Neither the Buy nor the Sell conditions are currently met.
ALERT:
What it shows: Flags unusual volume activity on the current bar compared to the recent average volume (calculated on your current chart's timeframe).
Interpretation:
SPIKE (Yellow background, black text): Current volume is significantly higher than the recent average (defined by the Volume Spike Multiplier). Can indicate strong interest or a potential climax.
DUMP (Purple background): Current volume is significantly lower than the recent average (defined by the Volume Dump Multiplier). Can indicate fading interest.
NONE (Gray background): Volume is within the normal range for the lookback period.
SD$:
What it shows: The price level where the last Volume Spike or Dump occurred on your current chart's timeframe.
Interpretation: Shows the price associated with the most recent significant volume event. The background color indicates the type of the last event: Green if the last event was a Spike, Red if the last event was a Dump. N/A if no Spike/Dump has occurred yet.
BB Value (%B):
What it shows: This relates to Bollinger Bands, but specifically calculated on a Higher Timeframe (HTF) that you can set in the inputs (e.g., Daily BBs while viewing an Hourly chart). It shows the Bollinger Band Percent B (%B) value for that HTF. %B measures where the HTF closing price is relative to the HTF upper and lower bands.
Interpretation:
Value > 1: HTF price closed above the HTF upper Bollinger Band.
Value < 0: HTF price closed below the HTF lower Bollinger Band.
Value between 0 and 1: HTF price closed within the HTF Bollinger Bands (e.g., 0.5 is exactly on the middle band).
The background is always gray.
LTS (Long Term Signal):
What it shows: A signal derived only from the Higher Timeframe (HTF) Bollinger Bands.
Interpretation:
BUY (Green background): The HTF price closed above the HTF upper Bollinger Band (see BB Value > 1). Considered a strong bullish signal from the higher timeframe perspective.
SELL (Red background): The HTF price closed below the HTF lower Bollinger Band (see BB Value < 0). Considered a strong bearish signal from the higher timeframe perspective.
NEUTRAL (Gray background): The HTF price closed within the HTF Bollinger Bands.
How to Understand Bollinger Bands and Signals in this Context:
Bollinger Bands are primarily used for the Long Term Signal (LTS) column. This script calculates BBs on a higher timeframe (you choose which one, or it defaults to the chart's timeframe if left blank).
The "LTS" signal triggers:
A BUY when the price on that higher timeframe closes above its upper Bollinger Band. This often indicates strong momentum or a potential breakout.
A SELL when the price on that higher timeframe closes below its lower Bollinger Band. This often indicates strong negative momentum or a potential breakdown.
The "BB Value" column gives you the raw %B number from that same higher timeframe, showing you exactly where the price is relative to the bands (is it just barely above/below, or way outside?).
The script does not directly use Bollinger Bands from the current chart timeframe for the "SIG NOW" or other table signals. The main short-term signals ("SIG NOW") rely on Moving Averages and RSI on the current timeframe. The LTS provides a longer-term perspective using HTF Bollinger Bands.
In summary: Look at the table to quickly gauge:
Short-term trend (Price vs MAs).
Short-term momentum (RSI Status, SIG NOW).
Recent short-term entry points (Last Sig Price).
Current volume anomalies (ALERT).
Long-term strength/weakness based on HTF Bollinger Bands (LTS, BB Value).
Combine these pieces of information to get a more rounded view of the current market conditions according to this specific script's logic.

Sniper_GPt con Probabilità Aggiustata + Stop/Take Dinamico📈 Sniper_GPt with Adjusted Probability + Dynamic Stop/Take
This strategy combines advanced technical analysis with a dynamic risk management system, based on an adjusted probability calculated from RSI, ATR, and Volume.
A trade signal is triggered only when the probability exceeds a user-defined threshold. Entry is based on the candle's direction and the probability signal.
🔹 Key Features:
Adjusted probability (%) algorithm.
Dynamic Stop Loss and Take Profit levels based on ATR and volatility.
Filter to prevent opposite positions from being open simultaneously.
Configurable pyramiding support.
Real-time display of Entry/Stop/Take levels.
Compatible with webhook alerts for integration with external platforms like Bybit.
✅ Ideal for automated strategies and external trading system integration.

EMA/VWAP Signal with AlertsEMA + VWAP with alerts to identify entry and exit points. Recommended for stocks.

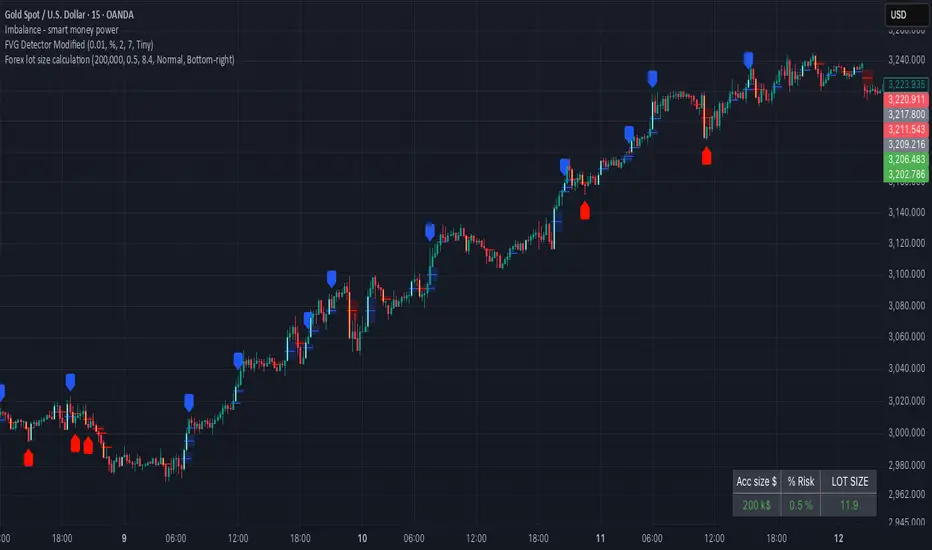
FVG Detector Modified# FVG Detector Modified
## Description
The FVG Detector Modified is an advanced technical analysis tool designed to identify Fair Value Gaps (FVGs) in the market with enhanced filtering capabilities. FVGs represent imbalances between buyers and sellers, indicating potential areas where price may return to "fill the gap" in the future.
This indicator not only identifies traditional bullish and bearish FVGs but also features a unique pattern recognition system that highlights significant FVGs by detecting consecutive occurrences within a customizable lookback period. The smart visualization system prevents visual clutter by avoiding duplicate markers in close proximity.
## Key Features
- **Bullish & Bearish FVG Detection**: Automatically identifies and displays both bullish (blue) and bearish (red) Fair Value Gaps
- **Customizable Appearance**: Adjust colors, transparency, and extension of FVGs to match your chart setup
- **Width Filtering**: Filter out insignificant FVGs using minimum width thresholds with multiple measurement methods (Points, Percentage, or ATR)
- **Smart Pattern Recognition**: Highlights significant FVGs when multiple gaps occur within a customizable lookback period
- **Anti-Clutter Technology**: Prevents visual overload by avoiding duplicate markers within a 5-candle window
- **Circle Size Options**: Choose from five different circle marker sizes (Tiny to Huge) to suit your chart setup
- **Multiple Alert Types**: Set alerts for basic FVG formations, pattern-based FVGs, and actual circle marker appearances
## Trading Applications
- Identify potential price reversal zones where market may return to "fill the gap"
- Recognize high-probability trading opportunities when multiple FVGs form in succession
- Use as confluence with other indicators for more precise entry and exit points
- Spot market structure shifts by monitoring the frequency and size of FVGs
## Settings
The indicator features comprehensive customization options:
- Toggle FVG visibility and appearance
- Set minimum width filters using various measurement methods
- Adjust lookback periods for pattern recognition
- Customize circle marker appearance and size
- Configure FVG extension for better visibility
*Note: This indicator is based on original work by LuxAlgo, modified with enhanced filtering capabilities to improve signal quality and reduce false positives.*