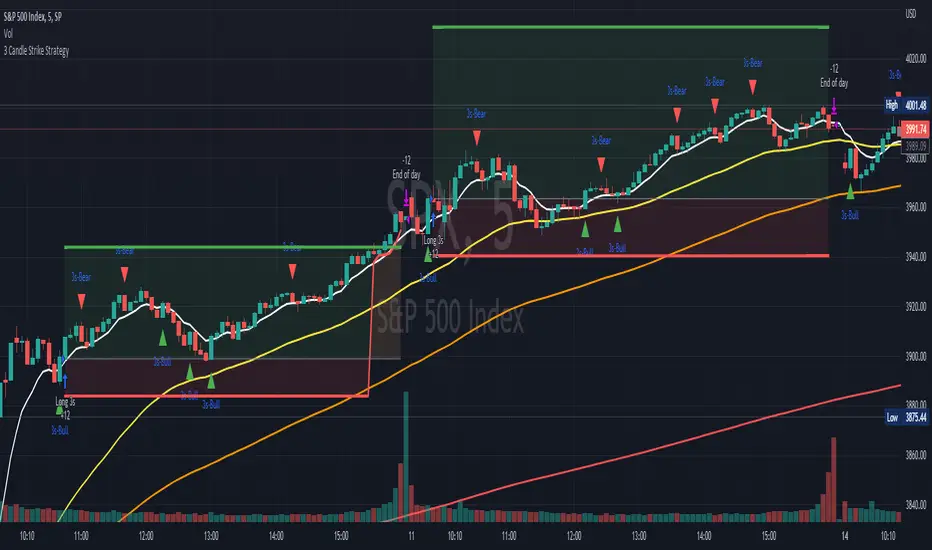
3 Candle Strike StretegyMainly developed for AMEX:SPY trading on 1 min chart. But feel free to try on other tickers.
Basic idea of this strategy is to look for 3 candle reversal pattern within trending market structure. The 3 candle reversal pattern consist of 3 consecutive bullish or bearish candles,
followed by an engulfing candle in the opposite direction. This pattern usually signals a reversal of short term trend. This strategy also uses multiple moving averages to filter long or short
entries. ie. if the 21 smoothed moving average is above the 50, only look for long (bullish) entries, and vise versa. There is option change these moving average periods to suit your needs.
I also choose to use Linear Regression to determine whether the market is ranging or trending. It seems the 3 candle pattern is more successful under trending market. Hence I use it as a filter.
There is also an option to combine this strategy with moving average crossovers. The idea is to look for 3 candle pattern right after a fast moving average crosses over a slow moving average.
By default , 21 and 50 smoothed moving averages are used. This gives additional entry opportunities and also provides better results.
This strategy aims for 1:3 risk to reward ratio. Stop losses are calculated using the closest low or high values for long or short entries, respectively, with an offset using a percentage of
the daily ATR value. This allows some price fluctuation without being stopped out prematurely. Price target is calculated by multiplying the difference between the entry price and the stop loss
by a factor of 3. When price target is reach, this strategy will set stop loss at the price target and wait for exit condition to maximize potential profit.
This strategy will exit an order if an opposing 3 candle pattern is detected, this could happen before stop loss or price target is reached, and may also happen after price target is reached.
*Note that this strategy is designed for same day SPY option scalping. I haven't determined an easy way to calculate the # of contracts to represent the equivalent option values. Plus the option
prices varies greatly depending on which strike and expiry that may suits your trading style. Therefore, please be mindful of the net profit shown. By default, each entry is approximately equal
to buying 10 of same day or 1 day expiry call or puts at strike $1 - $2 OTM. This strategy will close all open trades at 3:45pm EST on Mon, Wed, and Fri.
**Note that this strategy also takes into account of extended market data.
***Note pyramiding is set to 2 by default, so it allows for multiple entries on the way towards price target.
Remember that market conditions are always changing. This strategy was only able to be back-tested using 1 month of data. This strategy may not work the next month. Please keep that in mind.
Also, I take no credit for any of the indicators used as part of this strategy.
Enjoy~
Search in scripts for "scalping"
Gold Scalping BOS & CHoCHThis strategy is designed for scalping gold (XAU/USD) on the 3-minute timeframe, utilizing Break of Structure (BOS) and Change of Character (CHoCH) to identify high-probability trade setups. Unlike traditional SMA crossover strategies, this method focuses purely on price action and market structure shifts, allowing for early entries and better risk management.
Core Concepts:
Break of Structure (BOS) – Confirms a continuation of the trend when price breaks the last swing high (bullish) or last swing low (bearish).
Change of Character (CHoCH) – Detects possible trend reversals by identifying a shift in market momentum.
Dynamic Support & Resistance – Uses the last 10-bar highs and lows to determine adaptive stop-loss (SL) and take-profit (TP) levels.
Risk-to-Reward Ratio (1:2 RR) – Ensures trades are executed with a favorable risk/reward ratio.
Entry Conditions:
Buy Entry:
BOS (Bullish) confirmed (price breaks the previous swing high).
CHoCH (Bullish) confirms trend shift.
Price crosses back above the last swing low (confirmation of support).
Sell Entry:
BOS (Bearish) confirmed (price breaks the previous swing low).
CHoCH (Bearish) confirms trend shift.
Price crosses back below the last swing high (confirmation of resistance).
Exit Conditions:
Stop Loss (SL): Set at the most recent dynamic support (for buys) or resistance (for sells).
Take Profit (TP): 2x the risk (1:2 risk-reward ratio).
Advantages of This Strategy:
✅ No lagging indicators – Uses price action for real-time entries.
✅ High probability setups – Focuses only on strong structural breaks.
✅ Adaptive SL/TP – Uses real market structure instead of fixed values.
✅ Optimized for Scalping – Best suited for quick in-and-out trades.
Best Time to Trade:
🔹 London & New York Sessions (High volatility for gold).

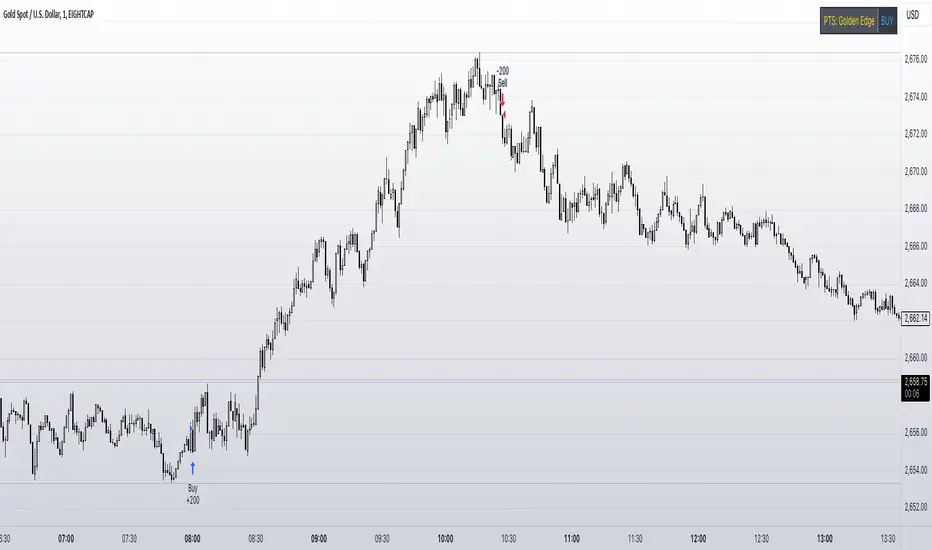
Precision Trading Strategy: Golden EdgeThe PTS: Golden Edge strategy is designed for scalping Gold (XAU/USD) on lower timeframes, such as the 1-minute chart. It captures high-probability trade setups by aligning with strong trends and momentum, while filtering out low-quality trades during consolidation or low-volatility periods.
The strategy uses a combination of technical indicators to identify optimal entry points:
1. Exponential Moving Averages (EMAs): A fast EMA (3-period) and a slow EMA (33-period) are used to detect short-term trend reversals via crossover signals.
2. Hull Moving Average (HMA): A 66-period HMA acts as a higher-timeframe trend filter to ensure trades align with the overall market direction.
3. Relative Strength Index (RSI): A 12-period RSI identifies momentum. The strategy requires RSI > 55 for long trades and RSI < 45 for short trades, ensuring entries are backed by strong buying or selling pressure.
4. Average True Range (ATR): A 14-period ATR ensures trades occur only during volatile conditions, avoiding choppy or low-movement markets.
By combining these tools, the PTS: Golden Edge strategy creates a precise framework for scalping and offers a systematic approach to capitalize on Gold’s price movements efficiently.
Demo GPT - Day Trading Scalping StrategyOverview:
This strategy is designed for day trading and scalping, utilizing a combination of technical indicators, candlestick patterns, and volume analysis to determine entry and exit points. It focuses on capturing short-term price movements while ensuring that trades are executed under specific market conditions.
Key Components:
Technical Indicators Used:
Exponential Moving Average (EMA): The strategy uses the 20-period EMA to identify the trend direction. The EMA smooths out price data, helping traders make more informed decisions about potential buy or sell signals.
Volume Weighted Average Price (VWAP): VWAP is used to measure the average price a security has traded at throughout the day, based on both volume and price. This indicator helps assess whether the current price is above or below the average trading price.
Camarilla Pivot Points: The strategy calculates four levels of Camarilla pivots (S2, S3, R2, R3) based on the highest and lowest prices over the last 14 daily candles. These levels act as potential support and resistance zones, guiding entry and exit decisions.
Candlestick Analysis:
Buy Condition: A buy signal is triggered when:
The first candle (previous candle) is green (close > open).
The second candle (current candle) is also green and opens above the first candle.
The volume of the current candle exceeds the 20-period moving average of volume, indicating strong buying interest.
Sell Condition: A sell signal is triggered when:
The first candle is red (close < open).
The second candle opens below the first red candle.
The volume of the current candle also exceeds the 20-period moving average of volume, indicating strong selling pressure.
Position Management:
The strategy enters a long position (buy) when the buy condition is met and closes the long position when the sell condition is met. This approach aims to capture upward momentum while avoiding extended exposure to downside risks.
Trading Settings:
Capital Management: The strategy uses 100% of available capital for each trade, allowing for maximum exposure to potential gains.
Commission and Slippage: The script includes settings for a commission rate of 0.1% and slippage of 3, accounting for trading costs and potential price changes during order execution.
Date Filtering: The strategy allows users to set a start date (January 1, 2018) and an end date (December 31, 2069) for trade execution, providing flexibility in backtesting and live trading.
Visualization:
The script plots the 20 EMA, VWAP, and the Camarilla pivot levels on the chart for visual reference.
Buy and sell signals are visually represented with shapes on the chart, making it easy to identify potential trade opportunities at a glance.
Volume is plotted in a separate pane to assess trading activity, and a horizontal line at zero provides a reference point.
Summary:
This Day Trading Scalping Strategy is designed to exploit short-term price movements by using a combination of EMAs, VWAP, and Camarilla pivot levels, alongside candlestick patterns and volume analysis. It is well-suited for traders looking to make quick trades based on real-time market conditions while maintaining a disciplined approach to entry and exit points. The strategy is highly visual, allowing traders to quickly assess market conditions and make informed trading decisions.
Feel free to modify or adjust any aspects of the strategy according to your specific trading goals or preferences!

DRSI DMA Scalping Strategy No RepaintThis strategy compares the slope of a Moving Average (of your choosing) to the slope of a Momentum Indicator (of your choosing). Zero is the center line because 0 slope means sideways movement. When both lines cross your buy threshold, it buys. When both lines cross your Sell threshold, it sells. The lines may look choppy, but that is probably because it is referencing a different timeframe than what the chart is set to. I left as many settings adjustable by the user as possible so you can tune this strategy to the relative behavior of whatever you are trading.
This also includes a No Repaint function so the backtest should be as close to live trading as possible.

Adaptive MA Scalping StrategyAdaptive MA Scalping Strategy
The Adaptive MA Scalping Strategy is an innovative trading approach that merges the strengths of the Kaufman's Adaptive Moving Average (KAMA) with the Moving Average Convergence Divergence (MACD) histogram. This combination results in a momentum-adaptive moving average that dynamically adjusts to market conditions, providing traders with timely and reliable signals.
How It Works
Kaufman's Adaptive Moving Average (KAMA): Unlike traditional moving averages, KAMA adjusts its sensitivity based on market volatility. It becomes more responsive during trending markets and less sensitive during periods of consolidation, effectively filtering out market noise.
MACD Histogram Integration: The strategy incorporates the MACD histogram, a momentum indicator that measures the difference between a fast and a slow exponential moving average (EMA). By adding the MACD histogram values to the KAMA, the strategy creates a new line—the momentum-adaptive moving average (MOMA)—which captures both trend direction and momentum.
Signal Generation:
Long Entry: The strategy enters a long position when the closing price crosses above the MOMA. This indicates a potential upward momentum shift.
Exit Position: The position is closed when the closing price crosses below the MOMA, signaling a potential decline in momentum.
Cloud Calculation Detail
The MOMA is calculated by adding the MACD histogram value to the KAMA of the price. This addition effectively adjusts the KAMA based on the momentum indicated by the MACD histogram. When momentum is strong, the MACD histogram will have higher values, causing the MOMA to adjust accordingly and provide earlier entry or exit signals.
Performance on Stocks
This strategy has demonstrated excellent performance on stocks when applied to the 1-hour timeframe. Its adaptive nature allows it to respond swiftly to market changes, capturing profitable trends while minimizing the impact of false signals caused by market noise. The combination of KAMA's adaptability and MACD's momentum detection makes it particularly effective in volatile market conditions commonly seen in stock trading.
Key Parameters
KAMA Length (malen): Determines the sensitivity of the KAMA. A length of 100 is used to balance responsiveness with noise reduction.
MACD Fast Length (fast): Sets the period for the fast EMA in the MACD calculation. A value of 24 helps in capturing short-term momentum changes.
MACD Slow Length (slow): Sets the period for the slow EMA in the MACD calculation. A value of 52 smooths out longer-term trends.
MACD Signal Length (signal): Determines the period for the signal line in the MACD calculation. An 18-period signal line is used for timely crossovers.
Advantages of the Strategy
Adaptive to Market Conditions: By adjusting to both volatility and momentum, the strategy remains effective across different market phases.
Enhanced Signal Accuracy: The fusion of KAMA and MACD reduces false signals, improving the accuracy of trade entries and exits.
Simplicity in Execution: With straightforward entry and exit rules based on price crossovers, the strategy is user-friendly for traders at all experience levels

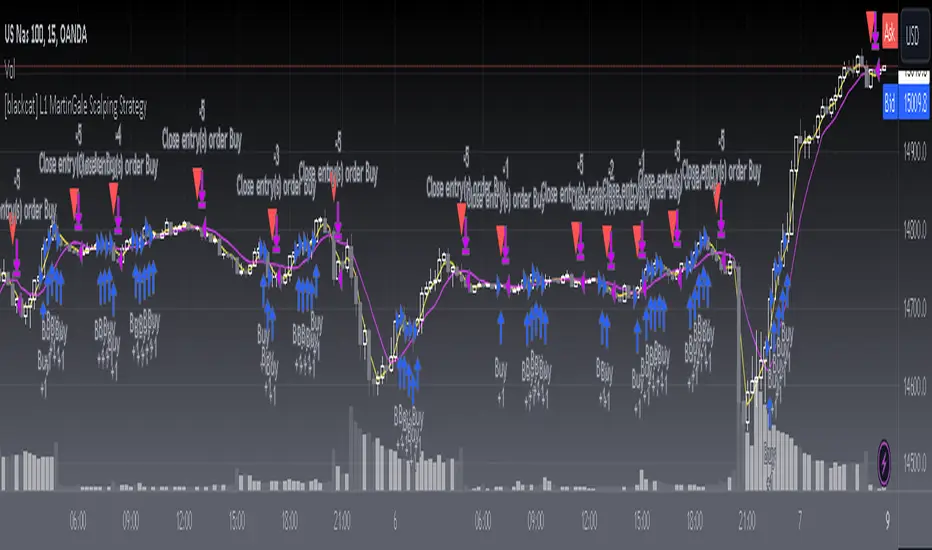
[blackcat] L1 MartinGale Scalping Strategy**MartinGale Strategy** is a popular money management strategy used in trading. It is commonly applied in situations where the trader aims to recover from a losing streak by increasing the position size after each loss.
In the MartinGale Strategy, after a losing trade, the trader doubles the position size for the next trade. This is done in the hopes that a winning trade will eventually occur, which will not only recover the previous losses but also generate a profit.
The idea behind the MartinGale Strategy is to take advantage of the law of averages. By increasing the position size after each loss, the strategy assumes that eventually, a winning trade will occur, which will not only cover the previous losses but also generate a profit. This can be especially appealing for traders looking for a quick recovery from a losing streak.
However, it is important to note that the MartinGale Strategy carries significant risks. If a trader experiences a prolonged losing streak or lacks sufficient capital, the strategy can lead to substantial losses. The strategy's reliance on the assumption of a winning trade can be dangerous, as there is no guarantee that a winning trade will occur within a certain timeframe.
Traders considering implementing the MartinGale Strategy should carefully assess their risk tolerance and thoroughly understand the potential drawbacks. It is crucial to have a solid risk management plan in place to mitigate potential losses. Additionally, traders should be aware that the strategy may not be suitable for all market conditions and may require adjustments based on market volatility.
In summary, the MartinGale Strategy is a money management strategy that involves increasing the position size after each loss in an attempt to recover from a losing streak. While it can offer the potential for quick recovery, it also comes with significant risks that traders should carefully consider before implementing it in their trading approach.
The MartinGale Scalping Strategy is a trading strategy designed to generate profits through frequent trades. It utilizes a combination of moving average crossovers and crossunders to generate entry and exit signals. The strategy is implemented in TradingView's Pine Script language.
The strategy begins by defining input variables such as take profit and stop loss levels, as well as the trading mode (long, short, or bidirectional). It then sets a rule to allow only long entries if the trading mode is set to "Long".
The strategy logic is defined using SMA (Simple Moving Average) crossover and crossunder signals. It calculates a short-term SMA (SMA3) and a longer-term SMA (SMA8), and plots them on the chart. The crossoverSignal and crossunderSignal variables are used to track the occurrence of the crossover and crossunder events, while the crossoverState and crossunderState variables determine the state of the crossover and crossunder conditions.
The strategy execution is based on the current position size. If the position size is zero (no open positions), the strategy checks for crossover and crossunder events. If a crossover event occurs and the trading mode allows long entries, a long position is entered. The entry price, stop price, take profit price, and stop loss price are calculated based on the current close price and the SMA8 value. Similarly, if a crossunder event occurs and the trading mode allows short entries, a short position is entered with the corresponding price calculations.
If there is an existing long position and the current close price reaches either the take profit price or the stop loss price, and a crossunder event occurs, the long position is closed. The entry price, stop price, take profit price, and stop loss price are reset to zero.
Likewise, if there is an existing short position and the current close price reaches either the take profit price or the stop loss price, and a crossover event occurs, the short position is closed and the price variables are reset.
The strategy also plots entry and exit points on the chart using plotshape function. It displays a triangle pointing up for a buy entry, a triangle pointing down for a buy exit, a triangle pointing down for a sell entry, and a triangle pointing up for a sell exit.
Overall, the MartinGale Scalping Strategy aims to capture small profits by taking advantage of short-term moving average crossovers and crossunders. It incorporates risk management through take profit and stop loss levels, and allows for different trading modes to accommodate different market conditions.
Soheil PKO's 5 min Hitman Scalp - 3MA + Laguerre RSI + ADX [Pt]Someone sent me this strategy found on YouTube. It is Soheil PKO's "The Best and Most Profitable Scalping Strategy" Best way to find out is to code it =)
This strategy uses Moving Average Ribbon, Laguerre RSI, and ADX. This script only displays the MA ribbon, you will need to add Laguerre RSI and ADX separately.
Long Entry Criteria:
- 16 EMA > 48 EMA > 200 SMA
- Laguerre RSI > 80
- ADX > 20
Long Exit Criterion:
- 16 EMA < 48 EMA
Short Entry Criteria:
- 16 EMA < 48 EMA < 200 SMA
- Laguerre RSI < 20
- ADX > 20
Short Exit Criterion:
- 16 EMA > 48 EMA
As mentioned in the video, risk management is very important, especially for scalping strategies. Therefore, I've added option for setting Stop Loss and Price Target in the options for you guys to play with.
All parameters are configurable.
Enjoy~~

Simple and Profitable Scalping Strategy (ForexSignals TV)Strategy is based on the "SIMPLE and PROFITABLE Forex Scalping Strategy" taken from YouTube channel ForexSignals TV.
See video for a detailed explaination of the whole strategy.
I'm not entirely happy with the performance of this strategy yet however I do believe it has potential as the concept makes a lot of sense.
I'm open to any ideas people have on how it could be improved.
Strategy incorporates the following features:
Risk management:
Configurable X% loss per stop (default to 1%)
Configurable R:R ratio
Trade entry:
Based on stratgey conditions outlined below
Trade exit:
Based on stratgey conditions outlined below
Backtesting:
Configurable backtesting range by date
Trade drawings:
Each entry condition indicator can be turned on and off
TP/SL boxes drawn for all trades. Can be turned on and off
Trade exit information labels. Can be turned on and off
NOTE: Trade drawings will only be applicable when using overlay strategies
Debugging:
Includes section with useful debugging techniques
Strategy conditions
Trade entry:
LONG
C1: On higher timeframe trend EMAs, Fast EMA must be above Slow EMA
C2: On higher timeframe trend EMAs, price must be above Fast EMA
C3: On current timeframe entry EMAs, Fast EMA must be above Medium EMA and Medium EMA must be above Slow EMA
C4: On current timeframe entry EMAs, all 3 EMA lines must have fanned out in upward direction for previous X candles (configurable)
C5: On current timeframe entry EMAs, previous candle must have closed above and not touched any EMA lines
C6: On current timeframe entry EMAs, current candle must have pulled back to touch the EMA line(s)
C7: Price must break through the high of the last X candles (plus price buffer) to trigger entry (stop order entry)
SHORT
C1: On higher timeframe trend EMAs, Fast EMA must be below Slow EMA
C2: On higher timeframe trend EMAs, price must be below Fast EMA
C3: On current timeframe entry EMAs, Fast EMA must be below Medium EMA and Medium EMA must be below Slow EMA
C4: On current timeframe entry EMAs, all 3 EMA lines must have fanned out in downward direction for previous X candles (configurable)
C5: On current timeframe entry EMAs, previous candle must have closed above and not touched any EMA lines
C6: On current timeframe entry EMAs, current candle must have pulled back to touch the EMA line(s)
C7: Price must break through the low of the last X candles (plus price buffer) to trigger entry (stop order entry)
Trade entry:
Calculated position size based on risk tolerance
Entry price is a stop order set just above (buffer configurable) the recent swing high/low (long/short)
Trade exit:
Stop Loss is set just below (buffer configurable) trigger candle's low/high (long/short)
Take Profit calculated from Stop Loss using R:R ratio
Credits
"SIMPLE and PROFITABLE Forex Scalping Strategy" taken from YouTube channel ForexSignals TV

ComiCo - Joel on Crypto - MACD ScalpingThis is a modified (hopefully improved) version of the "Joel on Crypto - MACD Scalping" indicator. It got turned into a strategy, and added some extra filters, like number of trades after EMA cross, minimal EMA distance (EMA 50's distance from the EMA 200). It is just an experiment to see how good this scalping strategy can get.
Play around with it and let me know if you found good settings, or just have a comment on it.
I could get fairly good results on BTCUSDT 5m with these settings (all others left on default values):
Ticks Avg. Multiplier = 1.4
Max trades after EMA cross = 16
Limit Price Difference = 0
Take Profit = 0.0065
Stop Loss = 0.0085
Min EMA difference = 110
Pyramiding = 3
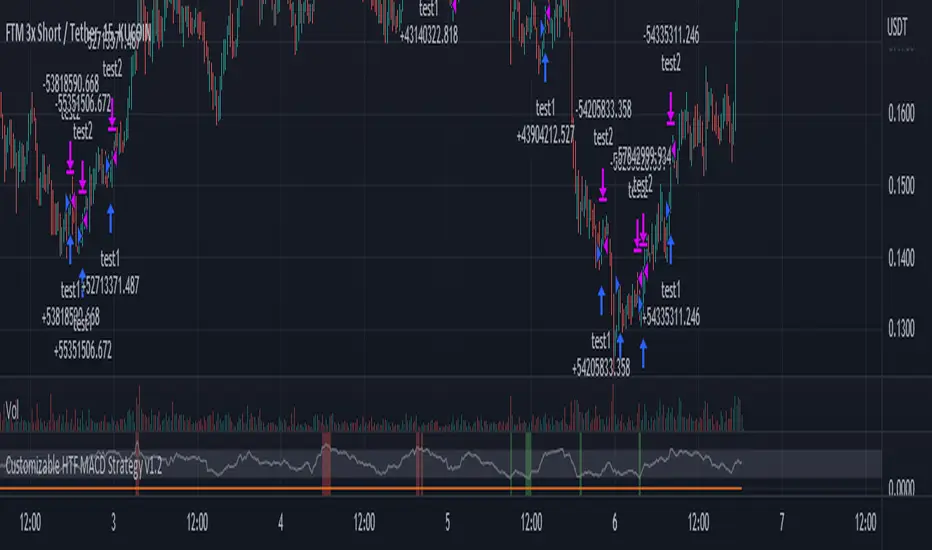
Customizable Non-Repainting HTF MACD MFI Scalper Bot StrategyThis script was originally shared by Wunderbit as a free open source script for the community to work with.
WHAT THIS SCRIPT DOES:
It is intended for use on an algorithmic bot trading platform but can be used for scalping and manual trading.
This strategy is based on the trend-following momentum indicator . It includes the Money Flow index as an additional point for entry.
HOW IT DOES IT:
It uses a combination of MACD and MFI indicators to create entry signals. Parameters for each indicator have been surfaced for user configurability.
Take profits are fixed, but stop loss uses ATR configuration to minimize losses and close profitably.
HOW IS MY VERSION ORIGINAL:
I started trying to deploy this script myself in my algorithmic trading but ran into some issues which I have tried to address in this version.
Delayed Signals : The script has been refactored to use a time frame drop down. The higher time frame can be run on a faster chart (recommended on one minute chart for fastest signal confirmation and relay to algotrading platform.)
Repainting Issues : All indicators have been recoded to use the security function that checks to see if the current calculation is in realtime, if it is, then it uses the previous bar for calculation. If you are still experiencing repainting issues based on intended (or non intended use), please provide a report with screenshot and explanation so I can try to address.
Filtering : I have added to additional filters an ABOVE EMA Filter and a BELOW RSI Filter (both can be turned on and off)
Customizable Long and Close Messages : This allows someone to use the script for algorithmic trading without having to alter code. It also means you can use one indicator for all of your different alterts required for your bots.
HOW TO USE IT:
It is intended to be used in the 5-30 minute time frames, but you might be able to get a good configuration for higher time frames. I welcome feedback from other users on what they have found.
Find a pair with high volatility (example KUCOIN:ETH3LUSDT ) - I have found it works particularly well with 3L and 3S tokens for crypto. although it the limitation is that confrigurations I have found to work typically have low R/R ratio, but very high win rate and profit factor.
Ideally set one minute chart for bots, but you can use other charts for manual trading. The signal will be delayed by one bar but I have found configurations that still test well.
Select a time frame in configuration for your indicator calculations.
Select the strategy config for time frame. I like to use 5 and 15 minutes for scalping scenarios, but I am interested in hearing back from other community memebers.
Optimize your indicator without filters (trendFilter and RSI Filter)
Use the TrendFilter and RSI Filter to further refine your signals for entry. You will get less entries but you can increase your win ratio.
I will add screenshots and possibly a video provided that it passes community standards.
Limitations: this works rather well for short term, and does some good forward testing but back testing large data sets is a problem when switching from very small time frame to large time frame. For instance, finding a configuration that works on a one minute chart but then changing to a 1 hour chart means you lose some of your intra bar calclulations. There are some new features in pine script which might be able to address, this, but I have not had a chance to work on that issue.
5min Williams Fractals scalping (3commas)Another strategy I'm learning Pine Script on. It is inspired by a MoneyZG youtube strategy called "Easy 5 Minute Scalping Strategy (Simple to Follow Scalping Trading Strategy)".
Again this is a one order per trade strategy compatible with the 3commas bot (works also with the free 3commas subscription). This strategy is based on the signals from Williams Fractals, taking the signals in reverse - red triangle indicates a bottom and hence we go long. The green triangle indicates a top so we go short. By default these signals are only accepted if they occur between the two Emas. However, you can also turn this off and when a WF signal comes in, only the current price has to be between the Emas. Stop loss is set to the current Ema slow and the take profit is a multiple of the distance to the slow ema.
Like previously I have added different filters as well as the ability to view essential things like the WF signal and Emas. I hope the script will help you to be more successful and if so it would be great if you could share here your setups, or tips on what would be good to refine to make it an even a more profitable strategy. Kind of a community approach so that we help each other out :).
Instructions for the 3commas connector:
1. First, you need to prepare 3commas Long/Short bots that will only listen to custom TV signals.
2. Inputs for the 3commas bot can be found at the end of the user inputs.
3. Once you have entered the required details into the inputs, turn on 3commas comments. They should appear on the chart (looks messy).
4. Now you can add the alert where you should paste the 3commas Webhook URL: 3commas.io
5. For the alert message text insert the placeholder {{strategy.order.comment}} and delete the rest.
6. Once the alert is saved, you can turn off those 3commas comments to have a clearer chart.
7. With a new alert, the bot and trade should launch.
In the near future I would like to publish more scripts that will carry similar elements as the first two, incl. compatibility with 3commas (I don't have access to another bot system). I will choose some strategies myself, but I will also be glad for some tips on what strategy would be good to do and is still missing here on Tradingview (short youtube videos or brief strategy manuals would be great).
Thanks and keep it up
PS: My screen values starting at Long Target Profit and ending at Pullback NOT greater than: 1.5; 1.5; 0; ON; 1; 2; OFF; 17; 36; ON; 0.05; ON; Chart; 14; 46; 50; 48.5; 51; OFF; 1; ON; 4; 2.

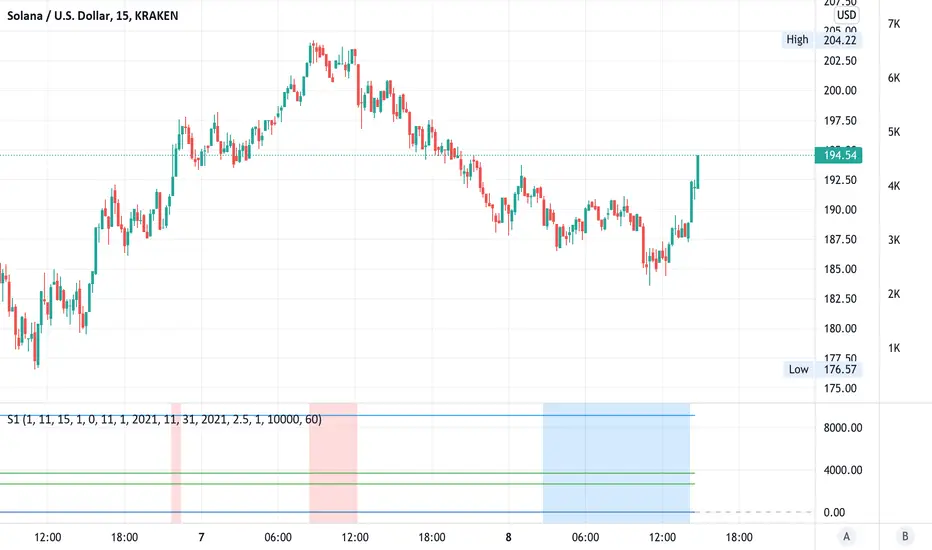
Simple scalping strategy for SOLThis is a simple scalping strategy for trading SOL made on top of the Rebalance Oscillator and the Rebalance Bear/Bull market indicators.
It is intended mostly as proof that these two indicators have their benefits even in simpler strategies.
This strategy in particular works well for the Bear months (check Nov. in the data window) but considerably underperforms Buy&Hold for the Bull months.
It tries to do a market operation per candle whenever the candle happens in a buy/sell trading window of the
Rebalance Bear/Bull indicator ().
It always buys/sells the same amount by default (you can set it in the cog menu in the option "Base Crypto Amount To Trade"),
for SOL this is set to 1.0SOL.
This is my first attempt at scalping, it differs slightly from the standards because it does not require fast
response candles or immediate market operations (it can work well with limit trading) and on top of this it also
does not require a stop loss since it uses an indicator that provides the trading windows (surprises can still happen though).
The profit that this strategy tries to take for each buy/sell pair is not configurable and is set at 12% each way when it happens.
[New series!] [Consistent Losing Strategies] 34 EMA Scalping//---------------------------INTRO------------------------------
Hi All!
Let me introduce myself as a semi-successful forex trader & lover of automation.
I've taken to algo trading and have been hunting down strategies (that usually use indicators) to automate, backtest, and hopefully implement in MT4.
Unfortunately, most strategies are complete bulls*** and the select cases that are shown to "prove" success are limited.
These strategy sources often do not provide useful analytics either.
I want to change that approach to trading! We can really benefit each other and the community by being methodical about backtesting
as well as evaluating our results with some kind of scoring heuristic.
As for what that standardized process looks like..well I'm still working on it.
I'm pretty much on Tv for multiple hours of the day, screening strategies via Pinescript and I'd like to start sharing my progress!
This is a new series I'd like to start on consistently losing strategies. I'll make all the code public, so if you think I've made a blunder
or approached a problem the wrong way, then drop me a DM or paste your fix into the comments.
//---------------------------STRAT------------------------------
34 EMA Scalping strategy (ref. forextradingstrategies4u )
How you're supposed to trade it:
BUY:
1. Market is in an down trend as shown by the 34 EMA
2. Price breaks above a downwards trend line
3. Price breaks above the 34 EMA
4. Look for a very bullish candlestick or chart pattern
SELL:
1. Look for the 34 EMA to show we are in an uptrend
2. Price breaks below an upwards sloping trend line
3. Price breaks below 34 EMA
4. Look for a bearish candlestick or a chart pattern
//---------------------------CONC------------------------------
Q: Why does it fail?
A: I believe this strategy relies too much on subjective input (aka, trendlines).
Q: Why does it fail as an algo?
A: The 34 EMA is no more predictive than any other EMA, although it does a good job at filtering out noise.
Q: Should I try it out?
A: No, it's trash. This is the proof that it is trash.
ChopFlow ATR Scalp StrategyA lean, high-velocity scalp framework for NQ and other futures that blends trend clarity, volume confirmation, and adaptive exits to give you precise, actionable signals—no cluttered bands or lagging indicators.
⸻
🔍 Overview
This strategy locks onto rapid intraday moves by:
• Filtering for directional momentum with the Choppiness Index (CI)
• Confirming conviction via On-Balance Volume (OBV) against its moving average
• Automatically sizing stops and targets with a multiple of the Average True Range (ATR)
It’s designed for scalp traders who need clean, timely entries without wading through choppy noise.
⸻
⚙️ Key Features & Inputs
1. ATR Length & Multiplier
• Controls exit distances based on current volatility.
2. Choppiness Length & Threshold
• Measures trend strength; only fires when the market isn’t “stuck in the mud.”
3. OBV SMA Length
• Smoothes volume flow to confirm genuine buying or selling pressure.
4. Custom Session Hours
• Avoid overnight gaps or low-liquidity periods.
All inputs are exposed for rapid tuning to your preferred scalp cadence.
🚀 How It Works
1. Long Entry triggers when:
• CI < threshold (strong trend)
• OBV > its SMA (positive volume flow)
• You’re within the defined session
2. Short Entry mirrors the above (CI < threshold, OBV < SMA)
3. Exit uses ATR × multiplier for both stop-loss and take-profit
⸻
🎯 Usage Tips
• Start with defaults (ATR 14, multiplier 1.5; CI 14, threshold 60; OBV SMA 10).
• Monitor signal frequency, then tighten/loosen CI or OBV look-back as needed.
• Pair with a fast MA crossover or price-action trigger if you want even sharper timing.
• Backtest across different sessions (early open vs. power hours) to find your edge.
⸻
⚠️ Disclaimer
This script is provided “as-is” for educational and research purposes. Always paper-trade any new setup extensively before deploying live capital, and adjust risk parameters to your personal tolerance.
⸻
Elevate your scalp game with ChopFlow ATR—where trend, volume, and volatility converge for clear, confident entries. Happy scalping!

Morning Scalp StrategyThe Morning Scalp Strategy combines the 50EMA with the Stochastic Momentum Index. The morning period is when penny stocks usually have the highest volatility, so the strategy works between 10:00 AM and 12:10 PM.
***It opens only long positions. The ideal timeframe for this scalping strategy is 5 minutes on low-price stocks. The stock should spike in the morning with momentum and Volume.
***Look for a daily or intraday support area, close to the open position, to increase the confidence in the play
The components are:
- EMA50: Exponential Moving Average (EMA50)
- Stochastic Momentum Index (SMI)
Rules:
- Period: 10:00 AM and 12:10 PM
- if SMI Crossover and SMI < 0, open a position
- If close < EMA50, close the position
- Profit target: To be decided by the user, default value = 10% above the entry price
If you have any questions, let me know!

Andean ScalpingAndean Scalping Implementation - BETA
- Uses Andean Oscillator: alpaca.markets
- Implements a threshold moving average (SMA 1000) on the Andean Signal line at 1.1 factor to filter out small moves
- TP/SL using ATR bands at 3x multiplier

Bollinger Bands + EMA 9A 1 minute scalping strategy.
Uses Bollinger Bands (no basis line) and a 9 period EMA.
Waits for price to close below the lower Bollinger Band and the next candle to close bullish above the lower Bollinger Band but below the 9 Period EMA.
If all conditions are met, the script enters a long position with TP at the 9 Period EMA.

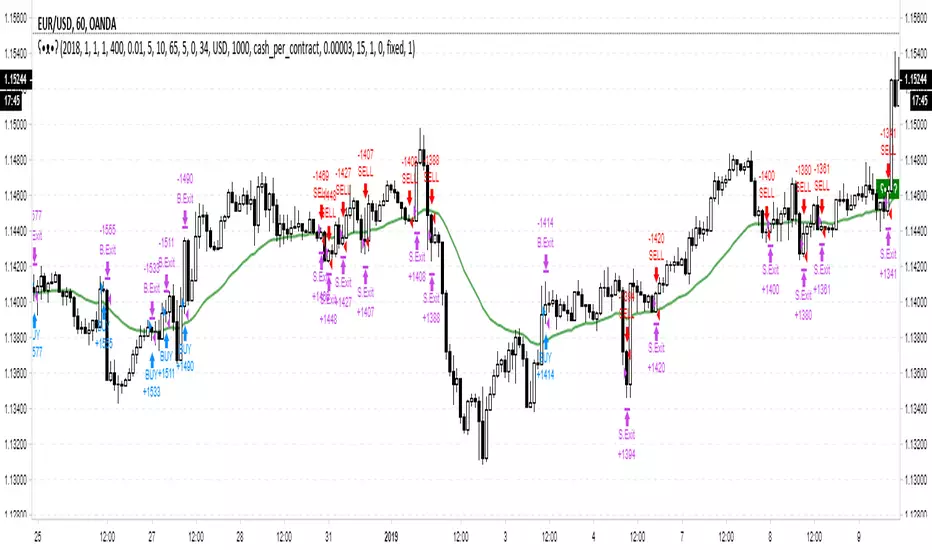
MACD Willy StrategyThis strategy is mainly developed for scalping / intraday trading. It could potentially be used to identify entry/exit signals for short term options trading. It performs decently well on popular stocks when used on time frames between 5 min to 15 min using regular session bar data. It combines 3 popular indicators, EMA, MACD, and William %range, to generate both long and short signals.
EMA:
Default is 200 EMA line.
MACD:
Default is 12/26 lengths for fast/slow signal inputs.
William %R - Smoothed (Published):
This is a custom indicator that generates two moving average lines from the original William %R line.
How it works:
Entry conditions:
1. Long/short entries when bar closes above/below EMA line
2. Long/short entries when MACD line is above/below signal line (histogram > 0 for long, < 0 for short)
3. Long/short entries when William %R fast MA line is above/below slow MA line
Exit conditions:
1. Exit long when MACD line is below signal line, vise versa for exit short
2. Exit long when William %R fast MA line is below slow MA line, vise versa for exit short
3. Exit long when William %R fast MA line must in below the overbought (-20) limit, exit short when above the oversold (-80) limit.
***Note that parameters are NOT optimized for any particular stocks / instruments.
Enjoy~~!!

EDMA Scalping Strategy (Exponentially Deviating Moving Average)This strategy uses crossover of Exponentially Deviating Moving Average (MZ EDMA ) along with Exponential Moving Average for trades entry/exits. Exponentially Deviating Moving Average (MZ EDMA ) is derived from Exponential Moving Average to predict better exit in top reversal case.
EDMA Philosophy
EDMA is calculated in following steps:
In first step, Exponentially expanding moving line is calculated with same code as of EMA but with different smoothness (1 instead of 2).
In 2nd step, Exponentially contracting moving line is calculated using 1st calculated line as source input and also using same code as of EMA but with different smoothness (1 instead of 2).
In 3rd step, Hull Moving Average with 2/3 of EDMA length is calculated using final line as source input. This final HMA will be equal to Exponentially Deviating Moving Average.
EDMA Defaults
Currently default EDMA and EMA length is set to 20 period which I've found better for higher timeframes but this can be adjusted according to user's timeframe. I would soon add Multi Timeframe option in script too. Chikou filter's period is set to 25.
Additional Features
EMA Band: EMA band is shown on chart to better visualize EMA cross with EDMA .
Dynamic Coloring: Chikou Filter library is used for derivation of dynamic coloring of EDMA and its band.
Trade Confirmation with Chikou Filter: Trend filteration from Chikou filter library is used as an option to enhance trades signals accuracy.
Strategy Default Test Settings
For backtesting purpose, following settings are used:
Initial capital=10000 USD
Default quantity value = 5 % of total capital
Commission value = 0.1 %
Pyramiding isn't included.
Backtesting data never assures that the same results would occur in future and also above settings use very less of total portfolio for trades, which in a way results less maximum drawdown along with less total profit on initial capital too. For example, increasing default quantity value will definity increase maximum drawdown value. The other way is also to use fix contracts in backtesting but it all depends on users general practice. Best option is to explore backtesting results with manually modified settings on different charts, before trusting them for other uses in future.
Usage and In-Detail Backtesting
This strategy has built-in option to enable trade confirmations with Chikou filter which will reduce the total number of trades increasing profit factor.
Symmetrically Weighted Moving Average (SWMA) on input source, may risk repainting in real-time data. Better option is to run a trade on bar close or simply left this optin unchecked.
I've set Chikou filter unchecked to increase number of trades (greater than 100) on higher timeframe (12H) and this can be changed according to your precision requirement and timeframe.
Timeframes lower than 4H usually have more noise. So its better to use higher EDMA and EMA length on lower timeframes which will decrease total number of offsetting trades increasing average total number of bars within a single trade.
Original "Exponentially Deviating Moving Average (MZ EDMA )" Indicator can be found here.

Contrarian Scalping Counter Trend Bb Envelope Adx and StochasticContrarian Scalping is an trading strategy designed to take advanted of a counter-trend.
The advantage of these strrategies types is that they have a good profitability but with do not great gain (in relation at the time frame).
Indicators used:
Bollinger
Envelope
ADX
Stochastic
Rules for entry
For short: close of the price is above upper band from bb and envelope, adx is below 30 and stochastic is above 50
For long: close of the price is below lower band from bb and envelope, adx is below 30 and stochastic is below 50
Rules for exit
For short: either close of the candle is below lower band of bb or enveloper or stochastic is below 50
For long: either close o the candle is above upper band of bb or envelope or stochastic is above 50
If there are any questions let me know !

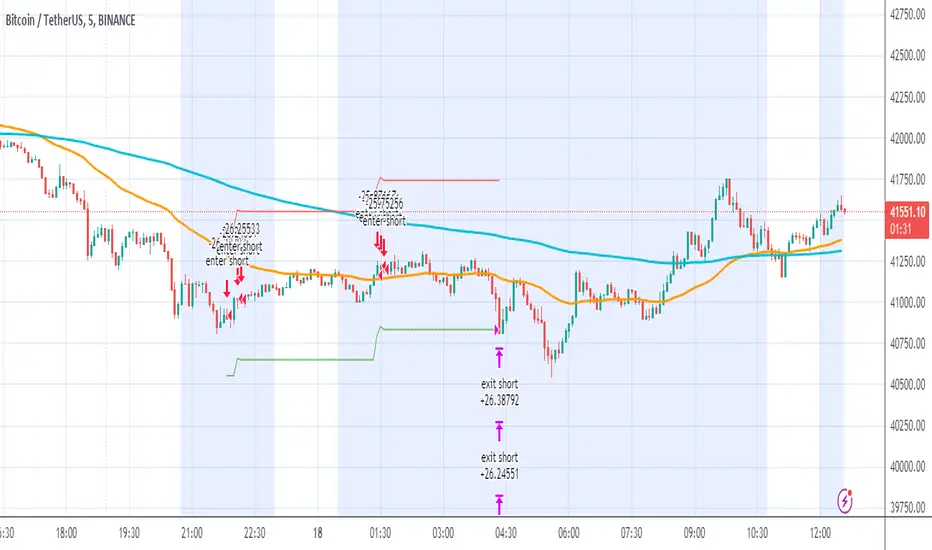
5min MACD scalp by JoelThis strategy is inspired by a youtuber called Joel on Crypto. He trades this using Ema, MACD indicators and his own experience. For more information, check out his Best Crypto Scalping Strategy for the 5 Min Time Frame video. I have tried to automate this a little.
Long or Short trades are determined with a crossing of the fast Ema over the slow Ema for Long and the opposite for Short. Trades should only happen close to the crossovers. Then for Long we use the MACD indicator with a 1min TF (I had better results using the 5min) where we look for high peaks in negative values for Long and vice versa for Shorts. These should be significantly higher than other peaks (or if you will lower peaks for a Long).
Hence, the key is to detect high peaks on the histogram, which I try to achieve by checking if the last 2 values were higher than X bars back. If you want to make it even more specific, then you can turn on the additional checkbox which compares the current value to the average value of X bars back, and if it is greater than, say, 50% the value of the average (= 1.5x the average), then it's ok for the trade.
I also noticed that the strategy often bought at the top or bottom, so I added a check that compares whether the last evaluated bar is the first rising bar (for Long) or falling bar (for Short). This can be turned on or off.
Target profit 0,5% and stop loss 0,4% are based on his recommendation. The strategy is set to take only 1 trade at a time , and you can have a back tester table on.
I'm still a pine script beginner, so the strategy is certainly not perfect and could be improved. If you have any tips on how to improve it further, please let me know. I will try to update it when I have time.
I would also like to thank Joel on Crypto for sharing the strategy and @ZenAndTheArtOfTrading for his great library and code (thanks to him we have a back tester table in here), but especially his educational videos on youtube, which taught me a lot about pine script.

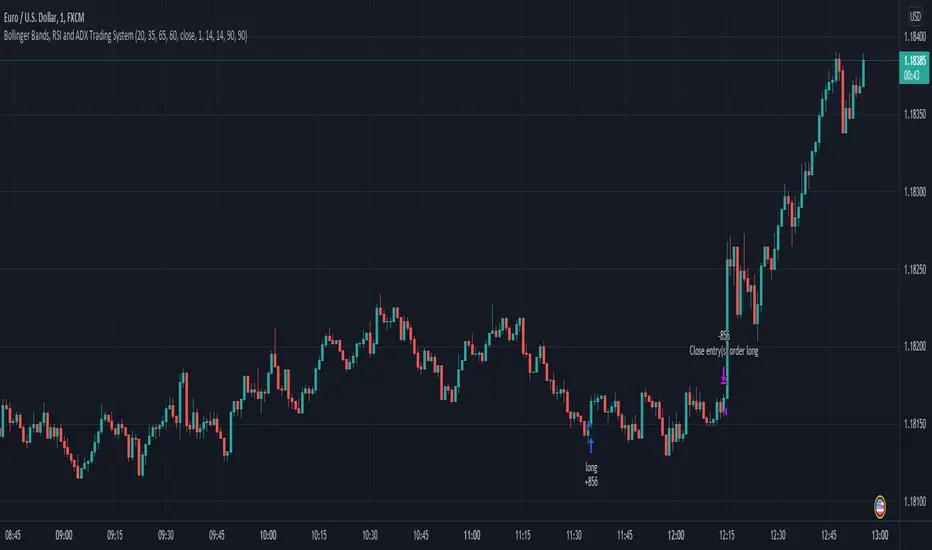
Forex Scalping 1min Bollinger Bands, RSI and ADX Trading SystemThis is a Forex Scalping Trading Sytem based on the Bollinger Bands.
Its suited for major pairs, with lowest possible comission (below 1 pip) and with timeframes ranging between 1-15 min.
Indicators:
Bollinger bands
ADX
RSI
Rules for entry:
Long Entry: price to move below the upper Bollinger Bands RSI raise above the 30 line and ADX<32 at the same time.
Short Entry: price to move above the upper Bollinger Bands, RSI raise below the 70 line and ADX<32 at the same time.
Rules for exit
Profit Exit: 3 options: 1, exit position when the price touches the middle band, 2) when the price touches the opposite band, X pips target profit.
Loss Exit: X pips loss
CCI Scalping Strategy---From the "Bitcoin Trading Strategies" book, by David Hanson---
After testing, works better with an ATR stop instead of the Strategy Stop. This parameter
can be changed from the strategy Inputs panel.
"CCI Scalping Strategy
Recommended Timeframe: 5 minutes
Indicators: 20 Period CCI, 20 WMA
Long when: Price closes above 20 WMA and CCI is below -100, enter when CCI crosses above -100.
Stop: Above 20 WMA"
