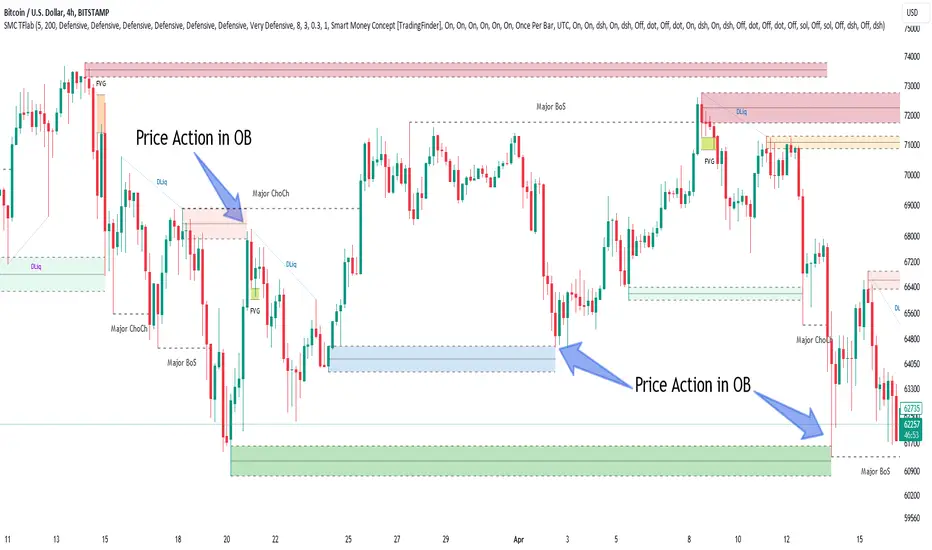
Smart Money Setup 07 [TradingFinder] Liquidity Hunts & Minor OB🔵 Introduction
The Smart Money Concept relies on analyzing market structure, tracking liquidity flows, and identifying order blocks. Research indicates that traders who apply these methods can improve their accuracy in predicting market movements by up to 30%.
These elements allow traders to understand the behavior of market makers, including banks and large financial institutions, which have the ability to influence price movements and shape major market trends. By recognizing how these entities operate, traders can align their strategies with Smart Money actions and better anticipate shifts in the market.
Smart Money typically enters the market at points of high liquidity where trading opportunities are more attractive. By following these liquidity flows, professional traders can position themselves at market reversal points, leading to profitable trades.
The Smart Money Setup 07 indicator has been specifically designed to detect these complex patterns. Using advanced algorithms, this indicator automatically identifies both bullish and bearish trading setups, assisting traders in discovering hidden market opportunities.
As a powerful technical analysis tool, the Smart Money Setup indicator helps predict the actions of major market participants and highlights optimal entry and exit points. Essentially, this tool enables traders to act like institutional investors and market makers, making the most of price fluctuations in their favor.
Ultimately, the Smart Money Setup 07 indicator transforms complex technical analysis into a simple and practical tool. By detecting order blocks and liquidity zones, this tool helps traders execute their strategies with greater precision, leading to more informed and successful trading decisions.
🟣 Bullish Setup
🟣 Bearish Setup
🔵 How to Use
One of the key strengths of the Smart Money Setup 07 indicator is its ability to accurately identify order blocks and analyze liquidity flows. Order blocks represent areas where large buy or sell orders are placed by Smart Money investors, which often indicate key reversal points in the market. Traders can use these order blocks to pinpoint potential entry and exit opportunities.
The Smart Money Setup indicator detects and visually displays these order blocks on the chart, helping traders identify the best zones to enter or exit trades. Since these zones are frequently used by large institutional investors, following these blocks allows traders to capitalize on price fluctuations and trade with confidence.
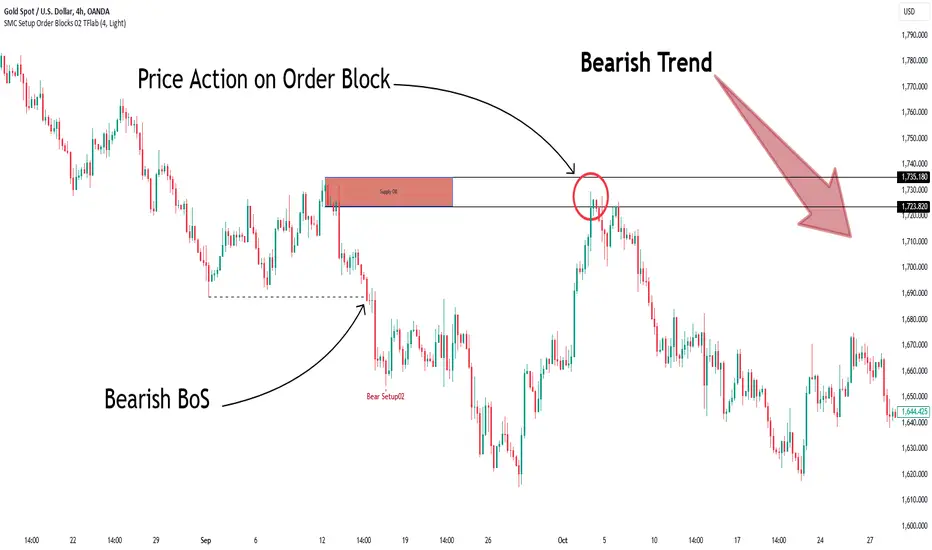
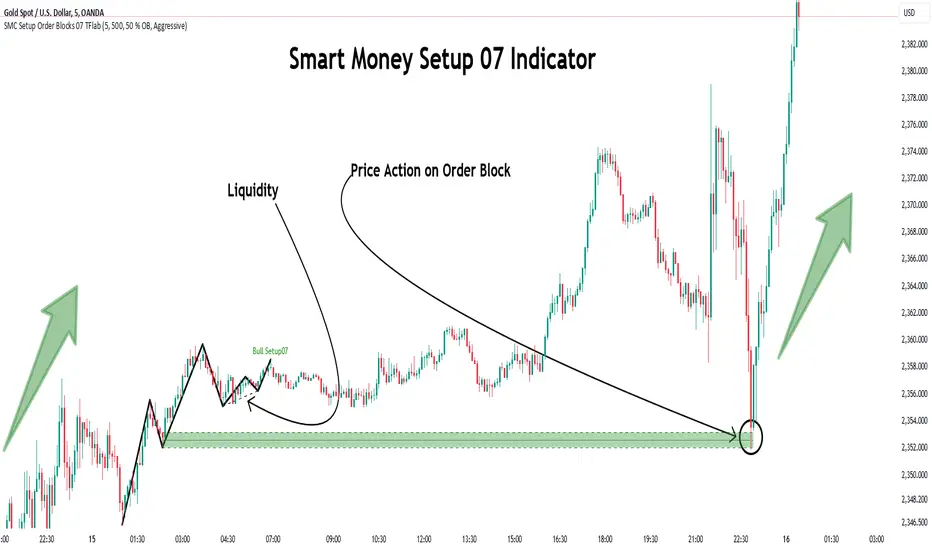
🟣 Bullish Smart Money Setup
A Bullish Smart Money Setup forms when the market creates Higher Lows and Higher Highs. In this situation, the indicator analyzes pivot points, liquidity flows, and order blocks to identify buy opportunities. Liquidity points in these setups indicate areas where Smart Money is likely to enter long positions.
In the bullish setup image, multiple Higher Lows and Higher Highs are formed. The green zone represents a Bullish Order Block, signaling traders to enter a long trade. The Smart Money Setup indicator displays a green arrow, indicating a high-probability upward price movement from this liquidity zone.
🟣 Bearish Smart Money Setup
A Bearish Smart Money Setup occurs when the market structure shows Lower Highs and Lower Lows, indicating weakness in price. The indicator identifies these patterns and highlights potential sell opportunities. Liquidity points in this setup mark areas where Smart Money enters sell positions.
In the bearish setup image, a Lower High is followed by a Lower Low, with the red liquidity zone acting as a Bearish Order Block. The Smart Money Setup indicator shows a red arrow, signaling a likely downward move, offering traders an opportunity to enter short positions.
🔵 Settings
Pivot Period : This setting determines how many candles are needed to form a pivot point. A default value of 2 is optimal for quickly identifying key pivot points in price action.
Order Block Validity Period : This parameter defines the lifespan of an order block. Traders can adjust how long each order block remains valid. For instance, setting it to 500 means that an order block will be valid for 500 bars after its formation.
Mitigation Level OB : This setting allows traders to select whether order blocks should be based on the "Proximal," "50% OB," or "Distal" levels, helping traders manage risk more effectively.
Order Block Refinement : Traders can refine the order blocks with precision. The indicator offers two refinement modes: Defensive and Aggressive. The Defensive mode identifies safer order blocks, while the Aggressive mode targets higher-risk blocks with the potential for larger reversals.
🔵 Conclusion
The Smart Money Setup 07 indicator is a powerful tool for identifying key Smart Money movements in the market. It provides traders with essential insights for making informed trading decisions, particularly when combined with technical analysis and liquidity flow analysis. This indicator allows traders to accurately pinpoint entry and exit points, helping them maximize profits and minimize risk.
By offering a range of customizable settings, the Smart Money Setup indicator adapts to different trading styles and strategies. Furthermore, its ability to detect order blocks and identify supply and demand zones makes it an indispensable tool for any trader looking to enhance their strategy.
In conclusion, the Smart Money Setup 07 is a crucial tool for traders aiming to optimize their trading performance. By utilizing the concepts of Smart Money in technical analysis, traders can make more precise decisions and take advantage of market fluctuations.
SMC
SMT Divergences [OutOfOptions]Smart Money Technique (SMT) Divergence is designed to identify discrepancies between correlated assets within the same timeframe. It occurs when two related assets exhibit opposing signals, such as one forming a higher low while the other forms a lower low. This technique is particularly useful for anticipating market shifts or reversals before they become evident through other Premium Discount (PD) Arrays.
This indicator works by identifying the highs and lows that have formed for an asset on the current chart and the correlated symbol defined in the settings. Once a pivot on either asset is formed, it checks if the pivot has taken liquidity as identified by the previous pivot in the same direction (i.e., a new high taking out a previous high). If this is the case and the corresponding asset has not taken a similar pivot, the condition is determined to be a potential valid divergence. The indicator will then filter out SMTs formed by adjacent candles, requiring at least one candle difference between the candles forming the SMT.
If the “Candle Direction Validation” setting is enabled, the indicator will further check both assets to ensure that for bullish SMTs, the last high on both assets was formed by down candle, and for bearish SMTs, the low was formed by an up candle. This check can often eliminate low-probability SMTs that are frequently broken.
The referenced chart shows divergence between Nasdaq (NQ) and S&P 500 (ES) futures, which are normally closely correlated assets that move in the same direction. The lines shown represent bullish and bearish divergences between the two when they are formed. As you can see from the chart, SMT Divergences may not always indicate a reversal, or a reversal might be just a short-term retrace. Therefore, SMT Divergences should not be used independently. However, in conjunction with other PD arrays, they can provide strong confirmation of a change in market direction.
Configurability:
Pivot strength - Indicates how many bars to the left/right of a high for pivot to be considered, recommended to keep at 1 for maximum detection speed
Candle Direction Validation - Additional SMT validation to filter out weak/low-probability SMTs be examining candle direction
Line Styling for Bullish/Bearish SMTs - Ability to customize line style, color & width for bullish/bearish SMTs
Label Control - Whether or not to show SMT label and if shown what font size & color should be used
What makes this indicator different:
Unlike other SMT indicators, this indicators has additional built-in controls to remove low-probability SMTs

ICT Professional Accumulation DistributionICT Professional Accumulation Distribution (ICT AD) provides a x-ray view into market accumulation and distribution. You can literally see the institutions at work.
The indicator consists of two cumulative lines derived from:
Cumulative change from open to close
Cumulative change from previous close to new open
By overlaying these two cumulative lines, you can detect real meaningful divergence that is narrative based not mathematically derived. You're seeing the real works of algorithms in play working in this area.
These divergences are only useful at extremes (topping or bottoming formations), not while trending. It will probably confirm your suspicion about making a important high or low.
This works on all timeframes but is most impactful on the daily.
How to use:
Method 1:
Enable the option for "Show Open vs Close."
Calculate the shift by subtracting the "Open vs Close" line value from the ICT Accumulation/Distribution (AD) line value.
Look for divergences between the two cumulative lines.
Method 2:
Switch the chart's display mode to "Line View" (representing the Open vs Close).
look for divergences between the line chart and the ICT AD line.
Price Action Analyst [OmegaTools]Price Action Analyst (PAA) is an advanced trading tool designed to assist traders in identifying key price action structures such as order blocks, market structure shifts, liquidity grabs, and imbalances. With its fully customizable settings, the script offers both novice and experienced traders insights into potential market movements by visually highlighting premium/discount zones, breakout signals, and significant price levels.
This script utilizes complex logic to determine significant price action patterns and provides dynamic tools to spot strong market trends, liquidity pools, and imbalances across different timeframes. It also integrates an internal backtesting function to evaluate win rates based on price interactions with supply and demand zones.
The script combines multiple analysis techniques, including market structure shifts, order block detection, fair value gaps (FVG), and ICT bias detection, to provide a comprehensive and holistic market view.
Key Features:
Order Block Detection: Automatically detects order blocks based on price action and strength analysis, highlighting potential support/resistance zones.
Market Structure Analysis: Tracks internal and external market structure changes with gradient color-coded visuals.
Liquidity Grabs & Breakouts: Detects potential liquidity grab and breakout areas with volume confirmation.
Fair Value Gaps (FVG): Identifies bullish and bearish FVGs based on historical price action and threshold calculations.
ICT Bias: Integrates ICT bias analysis, dynamically adjusting based on higher-timeframe analysis.
Supply and Demand Zones: Highlights supply and demand zones using customizable colors and thresholds, adjusting dynamically based on market conditions.
Trend Lines: Automatically draws trend lines based on significant price pivots, extending them dynamically over time.
Backtesting: Internal backtesting engine to calculate the win rate of signals generated within supply and demand zones.
Percentile-Based Pricing: Plots key percentile price levels to visualize premium, fair, and discount pricing zones.
High Customizability: Offers extensive user input options for adjusting zone detection, color schemes, and structure analysis.
User Guide:
Order Blocks: Order blocks are significant support or resistance zones where strong buyers or sellers previously entered the market. These zones are detected based on pivot points and engulfing price action. The strength of each block is determined by momentum, volume, and liquidity confirmations.
Demand Zones: Displayed in shades of blue based on their strength. The darker the color, the stronger the zone.
Supply Zones: Displayed in shades of red based on their strength. These zones highlight potential resistance areas.
The zones will dynamically extend as long as they remain valid. Users can set a maximum number of order blocks to be displayed.
Market Structure: Market structure is classified into internal and external shifts. A bullish or bearish market structure break (MSB) occurs when the price moves past a previous high or low. This script tracks these breaks and plots them using a gradient color scheme:
Internal Structure: Short-term market structure, highlighting smaller movements.
External Structure: Long-term market shifts, typically more significant.
Users can choose how they want the structure to be visualized through the "Market Structure" setting, choosing from different visual methods.
Liquidity Grabs: The script identifies liquidity grabs (false breakouts designed to trap traders) by monitoring price action around highs and lows of previous bars. These are represented by diamond shapes:
Liquidity Buy: Displayed below bars when a liquidity grab occurs near a low.
Liquidity Sell: Displayed above bars when a liquidity grab occurs near a high.
Breakouts: Breakouts are detected based on strong price momentum beyond key levels:
Breakout Buy: Triggered when the price closes above the highest point of the past 20 bars with confirmation from volume and range expansion.
Breakout Sell: Triggered when the price closes below the lowest point of the past 20 bars, again with volume and range confirmation.
Fair Value Gaps (FVG): Fair value gaps (FVGs) are periods where the price moves too quickly, leaving an unbalanced market condition. The script identifies these gaps:
Bullish FVG: When there is a gap between the low of two previous bars and the high of a recent bar.
Bearish FVG: When a gap occurs between the high of two previous bars and the low of the recent bar.
FVGs are color-coded and can be filtered by their size to focus on more significant gaps.
ICT Bias: The script integrates the ICT methodology by offering an auto-calculated higher-timeframe bias:
Long Bias: Suggests the market is in an uptrend based on higher timeframe analysis.
Short Bias: Indicates a downtrend.
Neutral Bias: Suggests no clear directional bias.
Trend Lines: Automatic trend lines are drawn based on significant pivot highs and lows. These lines will dynamically adjust based on price movement. Users can control the number of trend lines displayed and extend them over time to track developing trends.
Percentile Pricing: The script also plots the 25th percentile (discount zone), 75th percentile (premium zone), and a fair value price. This helps identify whether the current price is overbought (premium) or oversold (discount).
Customization:
Zone Strength Filter: Users can set a minimum strength threshold for order blocks to be displayed.
Color Customization: Users can choose colors for demand and supply zones, market structure, breakouts, and FVGs.
Dynamic Zone Management: The script allows zones to be deleted after a certain number of bars or dynamically adjusts zones based on recent price action.
Max Zone Count: Limits the number of supply and demand zones shown on the chart to maintain clarity.
Backtesting & Win Rate: The script includes a backtesting engine to calculate the percentage of respect on the interaction between price and demand/supply zones. Results are displayed in a table at the bottom of the chart, showing the percentage rating for both long and short zones. Please note that this is not a win rate of a simulated strategy, it simply is a measure to understand if the current assets tends to respect more supply or demand zones.
How to Use:
Load the script onto your chart. The default settings are optimized for identifying key price action zones and structure on intraday charts of liquid assets.
Customize the settings according to your strategy. For example, adjust the "Max Orderblocks" and "Strength Filter" to focus on more significant price action areas.
Monitor the liquidity grabs, breakouts, and FVGs for potential trade opportunities.
Use the bias and market structure analysis to align your trades with the prevailing market trend.
Refer to the backtesting win rates to evaluate the effectiveness of the zones in your trading.
Terms & Conditions:
By using this script, you agree to the following terms:
Educational Purposes Only: This script is provided for informational and educational purposes and does not constitute financial advice. Use at your own risk.
No Warranty: The script is provided "as-is" without any guarantees or warranties regarding its accuracy or completeness. The creator is not responsible for any losses incurred from the use of this tool.
Open-Source License: This script is open-source and may be modified or redistributed in accordance with the TradingView open-source license. Proper credit to the original creator, OmegaTools, must be maintained in any derivative works.

Killzones And Macros LibraryKillzones & Macros Library for Trading Sessions
This Pine Script library is designed to help traders identify and act during high-volatility trading windows, commonly referred to as "Killzones." These are specific times during the day when institutional traders are most active, resulting in increased liquidity and price movement. The library provides boolean fields that return true when the current time falls within one of the killzones or macroeconomic event windows, allowing for enhanced trade timing and precision.
Killzones Include:
London Open, New York Open, Midnight Open, London Lunch, New York PM, and more.
Capture high-volume periods like Power Hour, Equities Open, and Asian Range.
Macros:
Identify key moments like London 02:33, New York 08:50, and other significant times aligned with market movements or events.
This library is perfect for integrating into your custom strategies, backtesting, or setting alerts for optimal trade execution during major trading sessions and events.
Supply Demand by WowTradingInfoThis indicator identifies supply and demand zones based on price action, which is a crucial concept for technical analysis. Supply zones represent areas where the price has historically shown selling pressure, while demand zones show areas with strong buying interest.
Explanation:
Rally-Base-Rally (RBR):
A rally is defined as a price movement where the percentage increase between the current high and the previous low.
A base is defined as a period of consolidation where price stays within a narrow range, with low volatility.
A RBR pattern is detected when a rally occurs, followed by a base, and then another rally.
Drop-Base-Drop (DBD):
A drop is identified when the price decrease between the current low and the previous high.
A DBD pattern is detected when a drop occurs, followed by a base, and then another drop.
Zone Marking:
RBR Zones are drawn with repaint the candles color as yellow (where buyers are likely to step in).
DBD Zones are drawn with repaint the candles color as pink (where sellers are likely to step in).
Example Use Case:
Rally-Base-Rally: When you see a yellow zone, it suggests that price rallied, consolidated, and is likely to rally again. It can be used as a potential demand zone.
Drop-Base-Drop: pink zones indicate that price dropped, consolidated, and may drop again. It can be used as a potential supply zone.
This script will help you automatically detect and visualize RBR and DBD patterns on your TradingView chart. These zones can provide valuable insights into areas where price may react due to past buying or selling pressure.

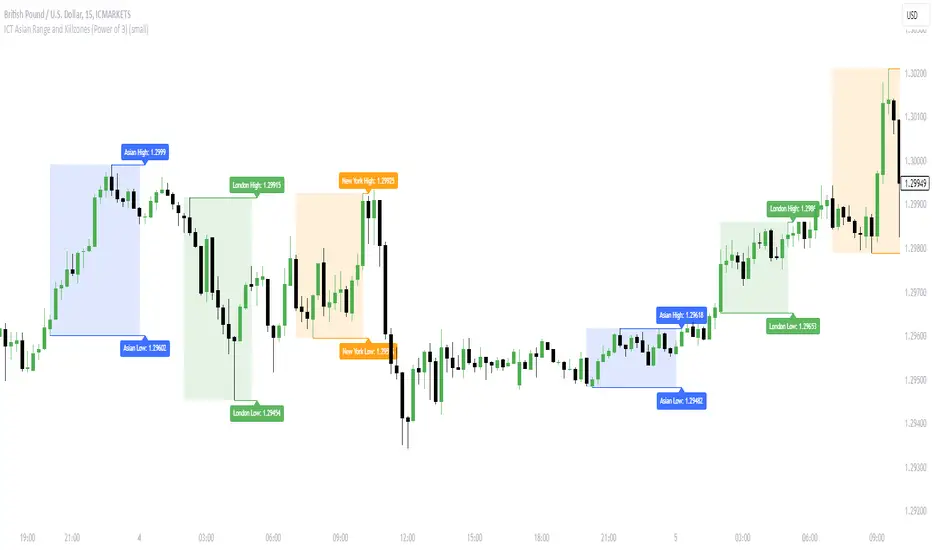
ICT Asian Range and KillzonesThis TradingView indicator highlights key trading sessions and their price ranges on a chart. It identifies the Asian Range and the Killzones for both the London Open and New York Open sessions. Here’s a brief breakdown:
Asian Range:
Defines the high and low price levels during the Asian trading session (between the specified start and end hours, default 00:00 to 04:00 UTC).
Plots horizontal lines to mark the highest and lowest prices reached during the Asian session.
Adds labels showing the values of these high and low points after the session ends.
London and New York Killzones:
Identifies the “Killzones” or key trading windows for the London Open (default 06:00 to 09:00 UTC) and the New York Open (default 11:00 to 14:00 UTC).
Tracks the high and low price levels within these windows and plots rectangles ("boxes") on the chart to visualize these ranges.
The boxes are color-coded and customizable, indicating potential areas of high market activity or volatility.
Customizable Visuals:
Users can adjust the colors, border widths, and other visual properties for better clarity and chart integration.
Unicorn ICT Signals [TradingFinder] Breaker Block + FVG Zones🔵 Introduction
The "ICT Unicorn Model" trading strategy in the "Inner Circle Trader" (ICT) style is one of the well-known strategies in the world of Forex and financial market trading.
The ICT methodology was developed by Michael Huddleston and is based on technical analysis and Price Action concepts.
This style focuses specifically on interpreting price movements and identifying optimal entry and exit points in the market.
In the Unicorn strategy, traders seek points where the probability of price reversal or trend continuation is high. This strategy is primarily based on recognizing and analyzing Price Action patterns and market structure.
By understanding"ICT Unicorn Model", traders can make more informed decisions about where to enter or exit trades, thereby increasing their chances of success in the market.
🟣 Understanding the Breaker Block
A Breaker Block is a specialized form of an Order Block that changes its role after a key market level is broken. Typically, an Order Block is an area on the chart where large institutional orders are likely to be placed, providing strong support or resistance.
However, when this area is breached, and the price moves in the opposite direction, it transforms into what is known as a Breaker Block. This shift indicates a reversal in market sentiment, turning the previous support into resistance or vice versa, thereby signaling a potential trend change to traders.
🟣 The Significance of the Fair Value Gap (FVG)
The Fair Value Gap (FVG) refers to an area on a price chart where the price rapidly moves through a level, leaving behind a gap. This gap represents an imbalance between supply and demand and is often seen as a potential area for price to return and fill the gap.
These zones are crucial for traders as they can indicate future price movements, providing opportunities to enter or exit trades.
🟣 Defining the ICT Unicorn Model
When an FVG overlaps with a Breaker Block, it forms a highly significant trading area known as a Unicorn. This overlap creates an ideal zone for traders to enter the market, as it combines two powerful technical signals.
The Unicorn Model is therefore considered an optimal strategy for identifying precise entry and exit points in the financial markets.
Demand ICT Unicorn Model :
Supply ICT Unicorn Model :
🔵 How to Use
🟣 Bullish ICT Unicorn
The Bullish ICT Unicorn model is applicable when the market is in an uptrend, and traders are seeking buying opportunities.
Follow these steps to identify Bullish ICT Unicorn :
Identify the Bullish Breaker Block : Locate an area where the price moved upward after breaking an Order Block. This area now acts as a Breaker Block.
Identify the Bullish FVG : Look for a Fair Value Gap near the Breaker Block.
Confirm the Unicorn : When the Bullish Breaker Block and Bullish FVG overlap, a Bullish Unicorn is confirmed. Traders can enter a buy position when the price returns to this zone.
🟣Bearish ICT Unicorn
The Bearish ICT Unicorn model is used when the market is in a downtrend, and traders are looking for selling opportunities.
To identify Bearish ICT Unicorn, follow these steps :
Identify the Bearish Breaker Block : Find an area where the price moved downward after breaking an Order Block. This area now acts as a Breaker Block.
Identify the Bearish FVG : Check if a Fair Value Gap has formed near the Breaker Block.
Confirm the Unicorn : When the Bearish Breaker Block and Bearish FVG overlap, a Bearish Unicorn is confirmed. Traders can enter a sell position when the price returns to this zone.
🔵 Setting
🟣 Global Setting
Pivot Period of Order Blocks Detector : Enter the desired pivot period to identify the Order Block.
Order Block Validity Period (Bar) : You can specify the maximum time the Order Block remains valid based on the number of candles from the origin.
Mitigation Level Breaker Block : Determining the basic level of a Breaker Block. When the price hits the basic level, the Breaker Block due to mitigation.
Mitigation Level FVG : Determining the basic level of a FVG. When the price hits the basic level, the FVG due to mitigation.
Mitigation Level Unicorn : Determining the basic level of a Unicorn Block. When the price hits the basic level, the Unicorn Block due to mitigation.
🟣 Unicorn Block Display
Show All Unicorn Block : If it is turned off, only the last Order Block will be displayed.
Demand Unicorn Block : Show or not show and specify color.
Supply Unicorn Block : Show or not show and specify color.
🟣 Breaker Block Display
Show All Breaker Block : If it is turned off, only the last Breaker Block will be displayed.
Demand Main Breaker Block : Show or not show and specify color.
Demand Sub (Propulsion & BoS Origin) Breaker Block : Show or not show and specify color.
Supply Main Breaker Block : Show or not show and specify color.
Supply Sub (Propulsion & BoS Origin) Breaker Block : Show or not show and specify color.
🟣 Fair Value Gap Display
Show Bullish FVG : Toggles the display of demand-related boxes.
Show Bearish FVG : Toggles the display of supply-related boxes.
🟣 Logic Settings
🟣 Order Block Refinement
Refine Order Blocks : Enable or disable the refinement feature. Mode selection.
🟣 FVG Filter
FVG Filter : This refines the number of identified FVG areas based on a specified algorithm to focus on higher quality signals and reduce noise.
Types of FVG filters :
Very Aggressive Filter: Adds a condition where, for an upward FVG, the last candle's highest price must exceed the middle candle's highest price, and for a downward FVG, the last candle's lowest price must be lower than the middle candle's lowest price. This minimally filters out FVGs.
Aggressive Filter: Builds on the Very Aggressive mode by ensuring the middle candle is not too small, filtering out more FVGs.
Defensive Filter: Adds criteria regarding the size and structure of the middle candle, requiring it to have a substantial body and specific polarity conditions, filtering out a significant number of FVGs.
Very Defensive Filter: Further refines filtering by ensuring the first and third candles are not small-bodied doji candles, retaining only the highest quality signals.
🟣 Alert
Alert Name : The name of the alert you receive.
Alert ICT Unicorn Model Block Mitigation :
On / Off
Message Frequency :
This string parameter defines the announcement frequency. Choices include: "All" (activates the alert every time the function is called), "Once Per Bar" (activates the alert only on the first call within the bar), and "Once Per Bar Close" (the alert is activated only by a call at the last script execution of the real-time bar upon closing). The default setting is "Once per Bar".
Show Alert Time by Time Zone :
The date, hour, and minute you receive in alert messages can be based on any time zone you choose. For example, if you want New York time, you should enter "UTC-4". This input is set to the time zone "UTC" by default.
🔵Conclusion
The Unicorn Model in ICT, utilizing the concepts of Breaker Blocks and Fair Value Gaps, provides an effective tool for identifying entry and exit points in financial markets. By offering more precise signals, this model helps traders make better decisions and minimize trading risks.
Success in applying this model requires practice and a deep understanding of market structure, but it can significantly improve trading performance.

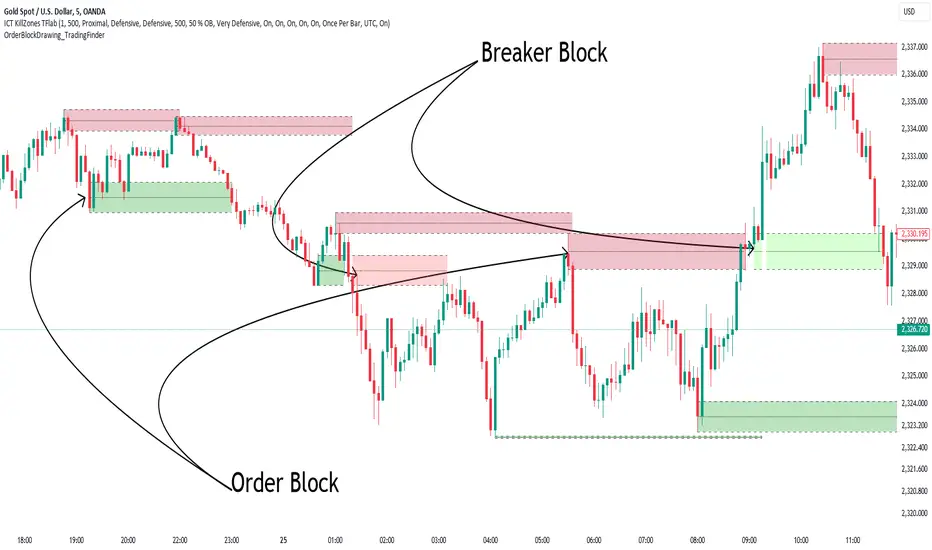
Breaker Blocks + Order Blocks confirm [TradingFinder] BBOB Alert🔵 Introduction
In the realm of technical analysis, various tools and concepts are employed to identify key levels on price charts. These tools assist traders in analyzing market trends with greater precision, enabling them to optimize their trading decisions. Among these tools, the Order Block and Breaker Block hold a significant place, serving as effective instruments for analyzing market structure.
🟣 Order Block
An Order Block refers to zones on a chart where large financial institutions and high-volume traders place their orders. Due to the substantial volume of buy or sell orders in these areas, they are often regarded as pivotal points for potential price reversals or temporary pauses in a trend. Order Blocks are particularly crucial when prices react to these zones after a strong market move, acting as strong support or resistance levels.
🟣 Breaker Block
On the other hand, a Breaker Block refers to areas on a chart that previously functioned as Order Blocks but where the price has managed to break through and continue in the opposite direction. These zones are typically recognized as key points where market trends might shift, helping traders identify potential reversal points in the market.
🟣 Overlapping Block (BBOB)
Now, imagine a scenario where these two essential concepts in technical analysis—Order Blocks and Breaker Blocks—overlap on a chart. Although this overlap is not specifically discussed within the ICT (Inner Circle Trader) trading framework, exploring and utilizing this overlap can provide traders with powerful insights into strong support and resistance zones. The combination of these two robust concepts can highlight critical areas in trading, potentially offering significant advantages in making informed trading decisions.
In this article, we will delve into the concept of this overlap, explaining how to utilize it in trading strategies. Additionally, we will analyze the potential outcomes and benefits of incorporating this concept into your trading decisions.
Bullish Overlapping Block (BBOB) :
Bearish Overlapping Block (BBOB) :
🔵 How to Use
The overlap between Order Blocks and Breaker Blocks is a compelling and powerful concept that can help traders identify key levels on the chart with a high probability of success. This overlap is particularly valuable because it combines two well-regarded concepts in technical analysis—zones of high order volume and critical market shifts.
🟣 Here’s how to effectively use this overlap in your trading
1. Dentifying the Overlapping Block : To make the most of the overlap between Order Blocks and Breaker Blocks, begin by identifying these zones separately. Order Blocks are areas where price typically reacts and reverses after a strong market move.
Breaker Blocks are areas where a previous Order Block has been breached, and the price continues in the opposite direction. When these two zones overlap on a chart, it’s crucial to pay close attention to this area, as it represents a high-probability reaction zone.
2. Analyzing the Overlapping Block : After identifying the overlap zone, carefully analyze price action within this region. Candlestick patterns and price behavior can provide essential clues.
If the price reaches this overlap zone and strong reversal patterns such as Pin Bars or Engulfing patterns are observed, it’s likely that this zone will act as a pivotal reversal point. In such cases, entering a trade with confidence becomes more feasible.
3. Entering the Trade : When sufficient signs of price reaction are present in the overlap zone, you can proceed to enter the trade. If the overlap zone is within an uptrend and bullish reversal signals are evident, a long position might be appropriate.
Conversely, if the overlap zone is in a downtrend and bearish reversal signals are observed, a short position would be more suitable.
4. Risk Management : One of the most critical aspects of trading in overlap zones is managing risk. To protect your capital, place your stop loss near the lowest point of the Order Block (for buy trades) or the highest point (for sell trades). This approach minimizes potential losses if the overlap zone fails to hold.
5. Price Targets : After entering the trade, set your price targets based on other key levels on the chart. These targets could include other support and resistance zones, Fibonacci levels, or pivot points.
Bullish Overlapping Block :
Bearish Overlapping Block :
🟣 Benefits of the Overlapping Block Between Order Block and Breaker Block
1. Enhanced Precision in Identifying Key Levels : The overlap between these two zones usually acts as a highly reliable area for price reactions, increasing the accuracy of identifying entry and exit points.
2. Reduced Trading Risk : Given the high importance of the overlap zone, the likelihood of making incorrect decisions is reduced, contributing to overall lower trading risk.
3. Increased Probability of Success : The overlap between Order Blocks and Breaker Blocks combines two powerful concepts, enhancing the likelihood of success in trades, as multiple indicators confirm the importance of the area.
4. Creation of Better Trading Opportunities : Overlap zones often provide traders with more robust trading opportunities, as these areas typically represent strong reversal points in the market.
5. Compatibility with Other Technical Tools : This concept seamlessly integrates with other technical analysis tools such as Fibonacci retracements, trend lines, and chart patterns, offering a more comprehensive market analysis.
🔵 Setting
🟣 Global Setting
Pivot Period of Order Blocks Detector : Enter the desired pivot period to identify the Order Block.
Order Block Validity Period (Bar) : You can specify the maximum time the Order Block remains valid based on the number of candles from the origin.
Mitigation Level Order Block : Determining the basic level of a Order Block. When the price hits the basic level, the Order Block due to mitigation.
Mitigation Level Breaker Block : Determining the basic level of a Breaker Block. When the price hits the basic level, the Breaker Block due to mitigation.
Mitigation Level Overlapping Block : Determining the basic level of a Overlapping Block. When the price hits the basic level, the Overlapping Block due to mitigation.
🟣 Overlapping Block Display
Show All Overlapping Block : If it is turned off, only the last Order Block will be displayed.
Demand Overlapping Block : Show or not show and specify color.
Supply Overlapping Block : Show or not show and specify color.
🟣 Order Block Display
Show All Order Block : If it is turned off, only the last Order Block will be displayed.
Demand Main Order Block : Show or not show and specify color.
Demand Sub (Propulsion & BoS Origin) Order Block : Show or not show and specify color.
Supply Main Order Block : Show or not show and specify color.
Supply Sub (Propulsion & BoS Origin) Order Block : Show or not show and specify color.
🟣 Breaker Block Display
Show All Breaker Block : If it is turned off, only the last Breaker Block will be displayed.
Demand Main Breaker Block : Show or not show and specify color.
Demand Sub (Propulsion & BoS Origin) Breaker Block : Show or not show and specify color.
Supply Main Breaker Block : Show or not show and specify color.
Supply Sub (Propulsion & BoS Origin) Breaker Block : Show or not show and specify color.
🟣 Order Block Refinement
Refine Order Blocks : Enable or disable the refinement feature. Mode selection.
🟣 Alert
Alert Name : The name of the alert you receive.
Alert Overlapping Block Mitigation :
On / Off
Message Frequency :
This string parameter defines the announcement frequency. Choices include: "All" (activates the alert every time the function is called), "Once Per Bar" (activates the alert only on the first call within the bar), and "Once Per Bar Close" (the alert is activated only by a call at the last script execution of the real-time bar upon closing). The default setting is "Once per Bar".
Show Alert Time by Time Zone :
The date, hour, and minute you receive in alert messages can be based on any time zone you choose. For example, if you want New York time, you should enter "UTC-4". This input is set to the time zone "UTC" by default.
🔵 Conclusion
The overlap between Order Blocks and Breaker Blocks represents a critical and powerful area in technical analysis that can serve as an effective tool for determining entry and exit points in trading.
These zones, due to the combination of two key concepts in technical analysis, hold significant importance and can help traders make more confident trading decisions.
Although this concept is not specifically discussed in the ICT framework and is introduced as a new idea, traders can achieve better results in their trades through practice and testing.
Utilizing the overlap between Order Blocks and Breaker Blocks, in conjunction with other technical analysis tools, can significantly improve the chances of success in trading.

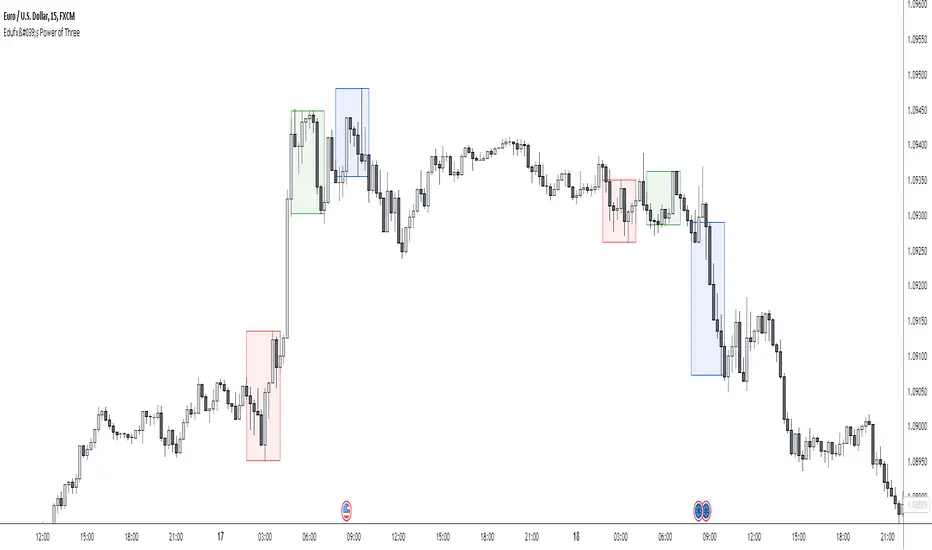
Edufx's Power of ThreeIndicator Overview
Name: Edufx's Power of Three
Purpose:
To highlight the high and low price ranges of specific hourly candles on a chart.
To visualize these ranges using rectangles.
Features
Visibility Toggle:
Users can enable or disable the visibility of the rectangles highlighting the high and low price ranges of the specified candles.
Customizable Rectangle Length:
Users can adjust the length of the rectangles that extend from the specified candle's high and low prices.
Price Range Tracking:
The high and low prices of the specified candles are tracked and stored.
Rectangle Drawing:
Rectangles are drawn from 5 bars before the end of the specified hour, highlighting the high and low price ranges.
How It Works
Price Range Tracking:
During each specified hour, the high and low prices are updated with the highest and lowest prices observed.
Rectangle Drawing:
At the end of each specified hour, the high and low prices are used to draw rectangles extending 5 bars backward from the end of the hour.
Rectangles are color-coded (red, green, and blue) for easy identification.
Usage
This indicator is useful for traders who want to monitor and react to key price levels at specific times of the day.
The visual rectangles help in identifying potential trading opportunities based on price action relative to these key levels.
Example
If the price moves above the high of the specified candle but fails to close above it, a visual rectangle will highlight this price range.
Similarly, if the price moves below the low of the specified candle but fails to close below it, the rectangle will indicate this range.
This indicator provides visual aids to assist traders in making informed decisions based on the behavior of price at specific key levels.
Relative Equal Highs/LowsThis Pine script indicator is designed to create a visual representation of the relative equal highs & lows formed and automatically removed mitigated ones. Unlike indicators designed to show exact equal high/lows this indicator allows a small, configurable degree of variance between price to identify areas where price stops.
Relevance:
Relative Equal highs and lows can serve as valuable tools in identifying potential shifts in trend direction. They come into play when the price hits a support or resistance level and can’t advance further, signaling a possible reversal or pivot point. When the price sufficiently retreats from these levels, relative equal highs and lows can also indicate liquidity draws where buy/sell stops might be positioned, in accordance with SMC/ICT concepts.
How It Works:
The indicator tracks all unmitigated highs & lows within the chart’s present timeframe, limited to the user-defined max bars lookback for optimal performance. If the prices are within the configured variance they are marked as relatively equal and at that point are visually identified by a horizontal line, which connects the two (or more) points of price. Depending on configuration of the indicator, a line is rendered from the 1st, last or both values within the relatively equal range of price. A unique feature of this indicator is its ability to remove the line once the price mitigates the relative equal high/low by falling below the lows or rising above highs. This ensures the chart remains uncluttered and highlights only the currently relevant levels, setting it apart from other indicators providing similar functionality.
Configurability:
The indicator offers five style settings for complete customization of the lines that represent equal highs/lows. These settings include line style, color, and width, along with an option to extend the lines to the right of the chart for enhanced visibility of equal high/low levels. To optimize performance, the indicator allows users to configure the lookback length, determining how far back the price history should be examined. In most instances, the default setting of 500 bars proves more than adequate. Additionally, you can set thresholds via separate configs for stocks & indices that will determine if the price is relatively equal and lastly allow you to configure where the indicator line should be drawn, the first, last or all the values.
Additional notes:
This uses a different approach then my “equal highs/lows” indicator to identify price levels and because it focuses specifically on relative as opposed to exact values it is entirely different and may show “weaker”, but still important levels of liquidity. This indicator is more suited for analysis of stocks and indices or higher-timeframes where price-action rarely forms exact equal values instead more frequently forming almost equal values. My other indicator is more suited for smaller (15m or less) timeframe on indices where exact equal prices are often identical. Depending on situation different indicators should be used.

Equal Highs and LowsDescription:
The ‘Equal Highs and Lows’ indicator is a technical analysis tool that marks identical price levels on a trading chart using the current time-frame, assisting traders in identifying potential support and resistance zones or liquidity draws. It creates a horizontal line connecting points where the price has created equal highs and lows within a specified lookback period. Unique to this tool, it maintains a clean chart by removing the line once the price surpasses the equal highs or falls below the equal lows, ensuring only the currently relevant equal highs and lows are highlighted.
Features:
Customization Options: Users can adjust the appearance of the lines (color, width, and style) to match their chart setup or preferences. Users can also choose to extend the lines marking the equal highs/lows to the right of the chart making the equal high/low levels more easier to visualize.
User-Defined Lookback Length: The number of bars to look back for finding equal highs and lows can be set by the user, allowing for flexibility in different market conditions.
How It Works:
The indicator meticulously scans the chart over a user-specified lookback duration, identifying bars with matching high or low values that have not been mitigated on the current chat timeframe, thereby constructing an index of equal values. It subsequently connects these equal values on the chart with a line. While this intuitive indicator does not forecast future market trends, it emphasizes significant price levels derived from historical data.
Usage:
Identifying Support and Resistance: The lines drawn by the indicator can be used to identify potential support and resistance zones and/or draws of liquidity, which are crucial for making informed trading decisions.
Strategy Development: Traders can incorporate the visual cues provided by the indicator into their trading strategies, using them as one of the factors for entry or exit decisions.
Originality:
This indicator presents a distinctive method for pinpointing and illustrating equal highs and lows, granting traders a crucial insight into key price levels. It stands apart from conventional indicators by offering extensive personalization and employing a novel approach to augment chart analysis. Uniquely, it retains only unmitigated equal high/low levels on the chart, automatically discarding mitigated price levels once the price has reached that level.
Conclusion:
The "Equal Highs and Lows" indicator is a practical tool for traders looking to enhance their chart analysis with visual cues of significant price levels. Its customization options and innovative approach make it a valuable addition to the trading toolkit, suitable for various trading styles and strategies.

Fair Value Gaps Setup 01 [TradingFinder] FVG Absorption + CHoCH🔵 Introduction
🟣 Market Structures
Market structures exhibit a fractal and nested nature, which leads us to classify them into internal (minor) and external (major) categories. Definitions of market structure vary, with different methodologies such as Smart Money and ICT offering distinct interpretations.
To identify market structure, the initial step involves examining key highs and lows. An uptrend is characterized by successive highs and lows that are higher than their predecessors. Conversely, a downtrend is marked by successive lows and highs that are lower than their previous counterparts.
🟣 Market Trends and Movements
Market trends consist of two primary types of movements :
Impulsive Movements : These movements align with the main trend and are characterized by high strength and momentum.
Corrective Movements : These movements counter the main trend and are marked by lower strength and momentum.
🟣 Break of Structure (BOS)
In a downtrend, a Break of Structure (BOS) occurs when the price falls below the previous low and establishes a new low (LL). In an uptrend, a BOS, also known as a Market Structure Break (MSB), happens when the price rises above the last high.
To confirm a trend, at least one BOS is necessary, which requires the price to close at least one candle beyond the previous high or low.
🟣 Change of Character (CHOCH)
Change of Character (CHOCH) is a crucial concept in market structure analysis, indicating a shift in trend. A trend concludes with a CHOCH, also referred to as a Market Structure Shift (MSS).
For example, in a downtrend, the price continues to drop with BOS, showcasing the trend's strength. However, when the price rises and exceeds the last high, a CHOCH occurs, signaling a potential transition from a downtrend to an uptrend.
It is essential to note that a CHOCH does not immediately indicate a buy trade. Instead, it is prudent to wait for a BOS in the upward direction to confirm the uptrend. Unlike BOS, a CHOCH confirmation does not require a candle to close; merely breaking the previous high or low with the candle's wick is sufficient.
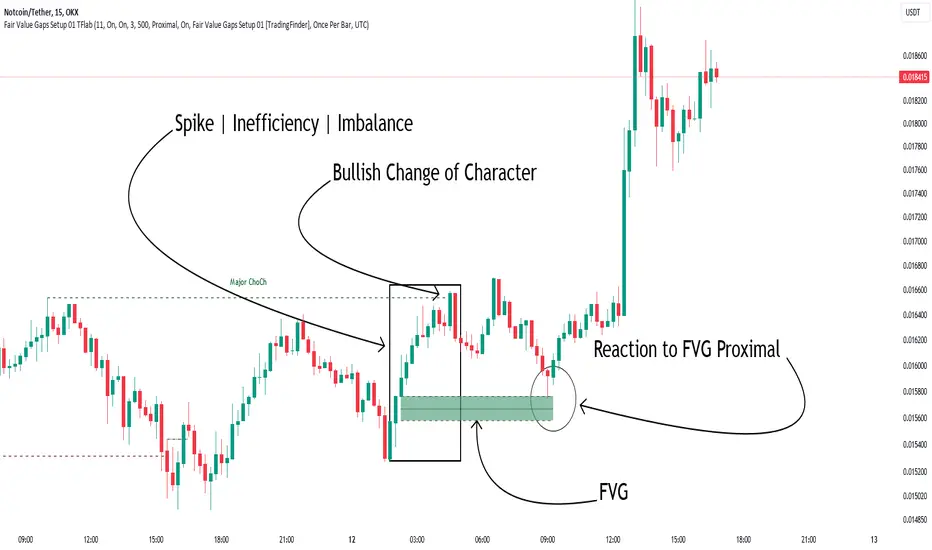
🟣 Spike | Inefficiency | Imbalance
All these terms mean fast price movement in the shortest possible time.
🟣 Fair Value Gap (FVG)
To pinpoint the "Fair Value Gap" (FVG) on a chart, a detailed candle-by-candle analysis is necessary. This process involves focusing on candles with substantial bodies and evaluating them in relation to the candles immediately before and after them.
Here are the steps :
Identify the Central Candle : Look for a candle with a large body.
Examine Adjacent Candles : The candles before and after this central candle should have long shadows, and their bodies must not overlap with the body of the central candle.
Determine the FVG Range : The distance between the shadows of the first and third candles defines the FVG range.
This method helps in accurately identifying the Fair Value Gap, which is crucial for understanding market inefficiencies and potential price movements.
🟣 Setup
This setup is based on Market Structure and FVG. After a change of character and the formation of FVG in the last lag of the price movement, we are looking for trading positions in the price pullback.
Bullish Setup :
Bearish Setup :
🔵 How to Use
After forming the setup, you can enter the trade using a pending order or after receiving confirmation. To increase the probability of success, you can adjust the pivot period market structure settings or modify the market movement coefficient in the formation leg of the FVG.
Bullish Setup :
Bearish Setup :
🔵 Setting
Pivot Period of Market Structure Detector :
This parameter allows you to configure the zigzag period based on pivots. Adjusting this helps in accurately detecting order blocks.
Show major Bullish ChoCh Lines :
You can toggle the visibility of the Demand Main Zone and "ChoCh" Origin, and customize their color as needed.
Show major Bearish ChoCh Lines :
Similar to the Demand Main Zone, you can control the visibility and color of the Supply Main Zone and "ChoCh" Origin.
FVG Detector Multiplier Factor :
This feature lets you adjust the size of the moves forming the Fair Value Gaps (FVGs) using the Average True Range (ATR). The default value is 1, suitable for identifying most setups. Adjust this value based on the specific symbol and market for optimal results.
FVG Validity Period :
This parameter defines the validity period of an FVG in terms of the number of candles. By default, an FVG remains valid for up to 15 candles, but you can adjust this period as needed.
Mitigation Level FVG :
This setting establishes the basic level of an FVG. When the price reaches this level, the FVG is considered mitigated.
Level in Low-Risk Zone :
This feature aims to reduce risk by dividing the FVG into two equal areas: "Premium" (upper area) and "Discount" (lower area). For lower risk, ensure that "Demand FVG" is in the "Discount" area and "Supply FVG" in the "Premium" area. This feature is off by default.
Show or Hide :
Given the potential abundance of setups, displaying all on the chart can be overwhelming. By default, only the last setup is shown, but you can enable the option to view all setups.
Alert Settings :
On / Off : Toggle alerts on or off.
Message Frequency : Determine how often alerts are triggered.
Options include :
"All" (alerts every time the function is called)
"Once Per Bar" (alerts only on the first call within the bar)
"Once Per Bar Close" (alerts only at the last script execution of the real-time bar upon closing)
The default setting is "Once Per Bar".
Show Alert Time by Time Zone : Set the alert time based on your preferred time zone, such as "UTC-4" for New York time. The default is "UTC".
Display More Info : Optionally show additional details like the price range of the order blocks and the date, hour, and minute in the alert message. Set this to "Off" if you prefer not to receive this information.
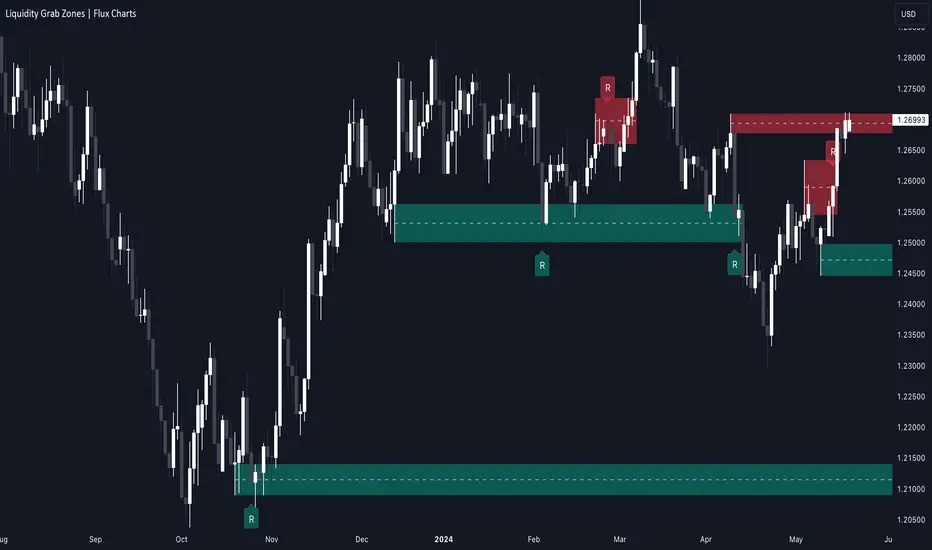
Liquidity Grab Zones | Flux Charts💎 GENERAL OVERVIEW
Introducing our new Liquidity Grab Zones Indicator! This indicator finds liquidity grabs in the current ticker and renders buyside & sellside liquidity grab zones. The retests and breakout of the zones are labeled, and you can set up alerts to get notified. For more information, please check the "HOW DOES IT WORK" section.
Features of the new Liquidity Grab Zones Indicator :
Renders Buyside & Sellside Liquidity Grab Zones
Retests & Breaks
Inverse Zones After Broken Feature
Alerts For All Features
Customizable Algorithm
Customizable Styles
🚩UNIQUENESS
Liquidity grabs can be useful when determining candles that have executed a lot of market orders, so you can plann your trades accordingly. This indicator lets you customize the pivot length and the wick-body ratio for liquidity grabs, provide retest & breakout labels, with customized styling and alerts.
📌 HOW DOES IT WORK ?
Liquidity grabs occur when one of the latest pivots has a false breakout. Then, if the wick to body ratio of the bar is higher than 0.5 (can be changed from the settings) a zone is plotted.
These zones usually indicate areas of high market interest where price action may reverse or accelerate. Identifying these zones can provide traders with critical levels for entering or exiting trades. A breakout of these zones generally mean strong movements are inbound, while failing breakouts make these zones act like support / resistance zones.
The indicator also reverses the type of the zone after an invalidation (can be turned off from the settings). This feature helps traders identify potential reversals more accurately.
The zone width is set to the area from the wick to the body of the candlestick, which can be seen here :
⚙️SETTINGS
1. General Configuration
Pivot Length -> This setting determines the range of the pivots. This means a candle has to have the highest / lowest wick of the previous X bars and the next X bars to become a high / low pivot.
Wick-Body Ratio -> After a pivot has a false breakout, the wick-body ratio of the latest candle is tested. The resulting ratio must be higher than this setting for it to be considered as a liquidity grab.
Zone Invalidation -> Select between Wick & Close price for Liquidity Grab Zone Invalidation.
Use these customizable settings to fine-tune the indicator according to your trading strategy and preferences.
Smart Money Concept [TradingFinder] Major OB + FVG + Liquidity🔵 Introduction
"Smart Money" refers to funds under the control of institutional investors, central banks, funds, market makers, and other financial entities. Ordinary people recognize investments made by those who have a deep understanding of market performance and possess information typically inaccessible to regular investors as "Smart Money".
Consequently, when market movements often diverge from expectations, traders identify the footprints of smart money. For example, when a classic pattern forms in the market, traders take short positions. However, the market might move upward instead. They attribute this contradiction to smart money and seek to capitalize on such inconsistencies in their trades.
The "Smart Money Concept" (SMC) is one of the primary styles of technical analysis that falls under the subset of "Price Action". Price action encompasses various subcategories, with one of the most significant being "Supply and Demand", in which SMC is categorized.
The SMC method aims to identify trading opportunities by emphasizing the impact of large traders (Smart Money) on the market, offering specific patterns, techniques, and trading strategies.
🟣 Key Terms of Smart Money Concept (SMC)
• Market Structure (Trend)
• Change of Character (ChoCh)
• Break of Structure (BoS)
• Order Blocks (Supply and Demand)
• Imbalance (IMB)
• Inefficiency (IFC)
• Fair Value Gap (FVG)
• Liquidity
• Premium and Discount
🔵 How Does the "Smart Money Concept Indicator" Work?
🟣 Market Structure
a. Accumulation
b. Market-Up
c. Distribution
d. Market-Down
a) Accumulation Phase : During the accumulation period, typically following a downtrend, smart money enters the market without significantly affecting the pricing trend.
b) Market-Up Phase : In this phase, the price of an asset moves upward from the accumulation range and begins to rise. Usually, the buying by retail investors is the main driver of this trend, and due to positive market sentiment, it continues.
c) Distribution Phase : The distribution phase, unlike the accumulation stage, occurs after an uptrend. In this phase, smart money attempts to exit the market without causing significant price fluctuations.
d) Market-Down Phase : In this stage, the price of an asset moves downward from the distribution phase, initiating a prolonged downtrend. Smart money liquidates all its positions by creating selling pressure, trapping latecomer investors.
The result of these four phases in the market becomes the market trend.
Types of Trends in Financial Markets :
a. Up-Trend
b. Down Trend
c. Range (No Trend)
a) Up-Trend : The market breaks consecutive highs.
b) Down Trend : The market breaks consecutive lows.
c) No Trend or Range : The market oscillates within a range without breaking either highs or lows.
🟣 Change of Character (ChoCh)
The "ChoCh" or "Change of Character" pattern indicates an initial change in order flow in financial markets. This structural change occurs when a major pivot in the opposite direction of the market trend fails. It signals a potential change in the market trend and can serve as a signal for short-term or long-term trend changes in a trading symbol.
🟣 Break of Structure (BoS)
The "BoS" or "Break of Structure" pattern indicates the continuation of the trend in financial markets. This structure forms when, in an uptrend, the price breaks its ceiling or, in a downtrend, the price breaks its floor.
🟣 Order Blocks (Supply and Demand)
Order blocks consist of supply and demand areas where the likelihood of price reversal is higher. There are six order blocks in this indicator, categorized based on their origin and formation reasons.
a. Demand Main Zone, "ChoCh" Origin.
b. Demand Sub Zone, "ChoCh" Origin.
c. Demand All Zone, "BoS" Origin.
d. Supply Main Zone, "ChoCh" Origin.
e. Supply Sub Zone, "ChoCh" Origin.
f. Supply All Zone, "BoS" Origin.
🟣 FVG | Inefficiency | Imbalance
These three terms are almost synonymous. They describe the presence of gaps between consecutive candle shadows. This inefficiency occurs when the market moves rapidly. Primarily, imbalances and these rapid movements stem from the entry of smart money and the imbalance between buyer and seller power. Therefore, identifying these movements is crucial for traders.
These areas are significant because prices often return to fill these gaps or even before they occur to fill price gaps.
🟣 Liquidity
Liquidity zones are areas where there is a likelihood of congestion of stop-loss orders. Liquidity is considered the driving force of the entire market, and market makers may manipulate the market using these zones. However, in many cases, this does not happen because there is insufficient liquidity in some areas.
Types of Liquidity in Financial Markets :
a. Trend Lines
b. Double Tops | Double Bottoms
c. Triple Tops | Triple Bottoms
d. Support Lines | Resistance Lines
All four types of liquidity in this indicator are automatically identified.
🟣 Premium and Discount
Premium and discount zones can assist traders in making better decisions. For instance, they may sell positions in expensive ranges and buy in cheaper ranges. The closer the price is to the major resistance, the more expensive it is, and the closer it is to the major support, the cheaper it is.
🔵 How to Use
🟣 Change of Character (ChoCh) and Break of Structure (BoS)
This indicator detects "ChoCh" and "BoS" in both Minor and Major states. You can turn on the display of these lines by referring to the last part of the settings.
🟣 Order Blocks (Supply and Demand)
Order blocks are Zones where the probability of price reversal is higher. In demand Zones you can buy opportunities and in supply Zones you can check sell opportunities.
The "Refinement" feature allows you to adjust the width of the order block according to your strategy. There are two modes, "Aggressive" and "Defensive," in the "Order Block Refine". The difference between "Aggressive" and "Defensive" lies in the width of the order block.
For risk-averse traders, the "Defensive" mode is suitable as it provides a lower loss limit and a greater reward-to-risk ratio. For risk-taking traders, the "Aggressive" mode is more appropriate. These traders prefer to enter trades at higher prices, and this mode, which has a wider order block width, is more suitable for this group of individuals.
🟣 Fair Value Gap (FVG) | Imbalance (IMB) | Inefficiency (IFC)
In order to identify the "fair value gap" on the chart, it must be analyzed candle by candle. In this process, it is important to pay attention to candles with a large size, and a candle and a candle should be examined before that.
Candles before and after this central candle should have long shadows and their bodies should not overlap with the central candle body. The distance between the shadows of the first and third candles is known as the FVG range.
These areas work in two ways :
• Supply and demand area : In this case, the price reacts to these areas and the trend is reversed.
• Liquidity zone : In this scenario, the price "fills" the zone and then reaches the order block.
Important note : In most cases, the FVG zone of very small width acts as a supply and demand zone, while the zone of significant width acts as a liquidity zone and absorbs price.
When the FVG filter is activated, the FVG regions are filtered based on the specified algorithm.
FVG filter types include the following :
1. Very Aggressive Mode : In addition to the initial condition, an additional condition is considered. For bullish FVG, the maximum price of the last candle must be greater than the maximum price of the middle candle.
Similarly, for a bearish FVG, the minimum price of the last candle must be lower than the minimum price of the middle candle. This mode removes the minimum number of FVGs.
2. Aggressive : In addition to the very aggressive condition, the size of the middle candle is also considered. The size of the center candle should not be small and therefore more FVGs are removed in this case.
3. Defensive : In addition to the conditions of the very aggressive mode, this mode also considers the size of the middle pile, which should be relatively large and make up the majority of the body.
Also, to identify bullish FVGs, the second and third candles must be positive, while for bearish FVGs, the second and third candles must be negative. This mode filters out a significant number of FVGs and keeps only those of good quality.
4. Very Defensive : In addition to the conditions of the defensive mode, in this mode the first and third candles should not be very small-bodied doji candles. This mode filters out most FVGs and only the best quality ones remain.
🟣 Liquidity
These levels are where traders intend to exit their trades. "Market makers" or smart money usually accumulate or distribute their trading positions near these levels, where many retail traders have placed their "stop loss" orders. When liquidity is collected from these losses, the price often reverses.
A "Stop hunt" is a move designed to offset liquidity generated by established stop losses. Banks often use major news events to trigger stop hunts and capture liquidity released into the market. For example, if they intend to execute heavy buy orders, they encourage others to sell through stop-hots.
Consequently, if there is liquidity in the market before reaching the order block area, the validity of that order block is higher. Conversely, if the liquidity is close to the order block, that is, the price reaches the order block before reaching the liquidity limit, the validity of that order block is lower.
🟣 Alert
With the new alert functionality in this indicator, you won't miss any important trading signals. Alerts are activated when the price hits the last order block.
1. It is possible to set alerts for each "symbol" and "time frame". The system will automatically detect both and include them in the warning message.
2. Each alert provides the exact date and time it was triggered. This helps you measure the timeliness of the signal and evaluate its relevance.
3. Alerts include target order block price ranges. The "Proximal" level represents the initial price level strike, while the "Distal" level represents the maximum price gap in the block. These details are included in the warning message.
4. You can customize the alert name through the "Alert Name" entry.
5. Create custom messages for "long" and "short" alerts to be sent with notifications.
🔵 Setting
a. Pivot Period of Order Blocks Detector :
Using this parameter, you can set the zigzag period that is formed based on the pivots.
b. Order Blocks Validity Period (Bar) :
You can set the validity period of each Order Block based on the number of candles that have passed since the origin of the Order Block.
c. Demand Main Zone, "ChoCh" Origin :
You can control the display or not display as well as the color of Demand Main Zone, "ChoCh" Origin.
d. Demand Sub Zone, "ChoCh" Origin :
You can control the display or not display as well as the color of Demand Sub Zone, "ChoCh" Origin.
e. Demand All Zone, "BoS" Origin :
You can control the display or not display as well as the color of Demand All Zone, "BoS" Origin.
f. Supply Main Zone, "ChoCh" Origin :
You can control the display or not display as well as the color of Supply Main Zone, "ChoCh" Origin.
g. Supply Sub Zone, "ChoCh" Origin :
You can control the display or not display as well as the color of Supply Sub Zone, "ChoCh" Origin.
h. Supply All Zone, "BoS" Origin :
You can control the display or not display as well as the color of Supply All Zone, "BoS" Origin.
i. Refine Demand Main : You can choose to be refined or not and also the type of refining.
j. Refine Demand Sub : You can choose to be refined or not and also the type of refining.
k. Refine Demand BoS : You can choose to be refined or not and also the type of refining.
l. Refine Supply Main : You can choose to be refined or not and also the type of refining.
m. Refine Supply Sub : You can choose to be refined or not and also the type of refining.
n. Refine Supply BoS : You can choose to be refined or not and also the type of refining.
o. Show Demand FVG : You can choose to show or not show Demand FVG.
p. Show Supply FVG : You can choose to show or not show Supply FVG
q. FVG Filter : You can choose whether FVG is filtered or not. Also specify the type of filter you want to use.
r. Show Statics High Liquidity Line : Show or not show Statics High Liquidity Line.
s. Show Statics Low Liquidity Line : Show or not show Statics Low Liquidity Line.
t. Show Dynamics High Liquidity Line : Show or not show Dynamics High Liquidity Line.
u. Show Dynamics Low Liquidity Line : Show or not show Dynamics Low Liquidity Line.
v. Statics Period Pivot :
Using this parameter, you can set the Swing period that is formed based on Static Liquidity Lines.
w. Dynamics Period Pivot :
Using this parameter, you can set the Swing period that is formed based Dynamics Liquidity Lines.
x. Statics Liquidity Line Sensitivity :
is a number between 0 and 0.4. Increasing this number decreases the sensitivity of the "Statics Liquidity Line Detection" function and increases the number of lines identified. The default value is 0.3.
y. Dynamics Liquidity Line Sensitivity :
is a number between 0.4 and 1.95. Increasing this number increases the sensitivity of the "Dynamics Liquidity Line Detection" function and decreases the number of lines identified. The default value is 1.
z. Alerts Name : You can customize the alert name using this input and set it to your desired name.
aa. Alert Demand Main Mitigation :
If you want to receive the alert about Demand Main 's mitigation after setting the alerts, leave this tick on. Otherwise, turn it off.
bb. Alert Demand Sub Mitigation :
If you want to receive the alert about Demand Sub's mitigation after setting the alerts, leave this tick on. Otherwise, turn it off.
cc. Alert Demand BoS Mitigation :
If you want to receive the alert about Demand BoS's mitigation after setting the alerts, leave this tick on. Otherwise, turn it off.
dd. Alert Supply Main Mitigation :
If you want to receive the alert about Supply Main's mitigation after setting the alerts, leave this tick on. Otherwise, turn it off.
ee. Alert Supply Sub Mitigation :
If you want to receive the alert about Supply Sub's mitigation after setting the alerts, leave this tick on. Otherwise, turn it off.
ff. Alert Supply BoS Mitigation :
If you want to receive the alert about Supply BoS's mitigation after setting the alerts, leave this tick on. Otherwise, turn it off.
gg. Message Frequency :
This parameter, represented as a string, determines the frequency of announcements. Options include: 'All' (triggers the alert every time the function is called), 'Once Per Bar' (triggers the alert only on the first call within the bar), and 'Once Per Bar Close' (activates the alert only during the final script execution of the real-time bar upon closure). The default setting is 'Once per Bar'.
hh. Show Alert time by Time Zone :
The date, hour, and minute displayed in alert messages can be configured to reflect any chosen time zone. For instance, if you prefer London time, you should input 'UTC+1'. By default, this input is configured to the 'UTC' time zone.
ii. Display More Info : The 'Display More Info' option provides details regarding the price range of the order blocks (Zone Price), along with the date, hour, and minute. If you prefer not to include this information in the alert message, you should set it to 'Off'.
You also have access to display or not to display, choose the Style and Color of all the lines below :
a. Major Bullish "BoS" Lines
b. Major Bearish "BoS" Lines
c. Minor Bullish "BoS" Lines
d. Minor Bearish "BoS" Lines
e. Major Bullish "ChoCh" Lines
f. Major Bearish "ChoCh" Lines
g. Minor Bullish "ChoCh" Lines
h. Minor Bearish "ChoCh" Lines
i. Last Major Support Line
j. Last Major Resistance Line
k. Last Minor Support Line
l. Last Minor Resistance Line
Order Block Drawing [TradingFinder]🔵 Introduction
Perhaps one of the most challenging tasks for Pine script developers (especially beginners) is properly drawing order blocks. While utilizing the latest technical analysis methods for "Price Action," beginners heavily rely on accurately plotting "Supply" and "Demand" zones, following concepts like "Smart Money Concept" and "ICT".
However, drawing "Order Blocks" may pose a challenge for developers. Therefore, to minimize bugs, increase accuracy, and speed up the process of coding order blocks, we have released the "Order Block Drawing" library.
Below, you can read more details about how to use this library.
Important :
This library has direct and indirect outputs. The indirect output includes the ranges of order blocks plotted on the chart. However, the direct output is a "Boolean" value that becomes "true" only when the price touches an order block, colloquially termed as "Mitigate." You can use this output for setting up alerts.
🔵 How to Use
First, you can add the library to your code as shown in the example below.
import TFlab/OrderBlockDrawing_TradingFinder/1
🟣Parameters
OBDrawing(OBType, TriggerCondition, DistalPrice, ProximalPrice, Index, OBValidDis, Show, ColorZone) =>
Parameters:
• OBType (string)
• TriggerCondition (bool)
• DistalPrice (float)
• ProximalPrice (float)
• Index (int)
• OBValidDis (int)
• Show (bool)
• ColorZone (color)
OBType : All order blocks are summarized into two types: "Supply" and "Demand." You should input your order block type in this parameter. Enter "Demand" for drawing demand zones and "Supply" for drawing supply zones.
TriggerCondition : Input the condition under which you want the order block to be drawn in this parameter.
DistalPrice : Generally, if each zone is formed by two lines, the farthest line from the price is termed "Distal." This input receives the price of the "Distal" line.
ProximalPrice : Generally, if each zone is formed by two lines, the nearest line to the price is termed "Proximal" line.
Index : This input receives the value of the "bar_index" at the beginning of the order block. You should store the "bar_index" value at the occurrence of the condition for the order block to be drawn and input it here.
OBValidDis : Order blocks continue to be drawn until a new order block is drawn or the order block is "Mitigate." You can specify how many candles after their initiation order blocks should continue. If you want no limitation, enter the number 4998.
Show : You may need to manage whether to display or hide order blocks. When this input is "On", order blocks are displayed, and when it's "Off", order blocks are not displayed.
ColorZone : You can input your preferred color for drawing order blocks.
🔵 Function Outputs
This function has only one output. This output is of type "Boolean" and becomes "true" only when the price touches an order block. Each order block can be touched only once and then loses its validity. You can use this output for alerts.
= Drawing.OBDrawing('Demand', Condition, Distal, Proximal, Index, 4998, true, Color)
Smart Money Setup 06 [TradingFinder] Liquidity Sweeps + OB Swing🔵 Introduction
Smart Money, managed by large investors, injects significant capital into financial markets by entering real capital markets.
Capital entering the market by this group of individuals is called smart money. Traders can profit from financial markets by following such individuals.
Therefore, smart money can be considered one of the effective methods for analyzing financial markets.
Sometimes, before a market movement, fluctuation movements that create price movement cause many traders' "Stop Loss" to be triggered. These movements are created in various patterns.
One of these patterns is similar to an "Expanding Triangle", which touches the stop loss of individuals who have placed their stop loss in the cash area in the form of 5 consecutive openings.
To better understand this setup, pay attention to the images below.
Bullish Setup Details :
Bearish Setup Details :
🔵 How to Use
After adding the indicator to the chart, wait for trading opportunities to appear. By changing the "Time Frame" and "Pivot Period", you can see different trading positions.
In general, the smaller the "Time Frame" and "Pivot Period", the more likely trading opportunities will appear.
Bullish Setup Details on Chart :
Bearish Setup Details on Chart :
🔵 Settings
You have access to "Pivot Period", "Order Block Refine", and "Refine Mode" through settings.
By changing the "Pivot Period", you can change the range of zigzag that identifies the setup.
Through "Order Block Refine", you can specify whether you want to refine the width of the order blocks or not. It is set to "On" by default.
Through "Refine Mode", you can specify how to improve order blocks.
If you are "risk-averse", you should set it to "Defensive" mode because in this mode, the width of the order blocks decreases, the number of your trades decreases, and the "reward-to-risk ratio "increases.
If you are on the opposite side and are "risk-taker", you can set it to "Aggressive" mode. In this mode, the width of the order blocks increases, and the likelihood of losing positions decreases.

MTF OB Supply Demand ZonesHello everyone,
This exceptional indicator provides you with visual representations of bullish and bearish order blocks or supply and demand zones across multiple timeframes. In simple terms, bullish order blocks are represented by a small red candle followed by a large red candle, while bearish order blocks are depicted as a small green candle followed by a large red candle. Supply and demand zones are drawn by using order blocks.
Features:
Display order blocks from up to three different timeframes.
Customize the maximum number of boxes shown and the colors of the zones.
Choose from three different modes: OB (Order Block), Extended OB, and Supply/Demand.
Mode Descriptions:
OB: Includes the body of the candle.
Extended OB: Encompasses the body and wick of the candle.
Supply/Demand: Covers the body, wick, and half the body of the large candle.
Usage:
Ensure that charts 2 and 3 are set to a higher timeframe. For modes 2 and 3, it’s recommended to reduce the maximum number of boxes shown. The zones or boxes are transparent, allowing for overlap. This feature aids in identifying reversal zones or confirmed zones. The more intense the color, the stronger the confirmation. If a green zone overlaps a red zone (or vice versa), it signifies a reversal zone.
Thank you for checking out this indicator!
---
Additional Information:
Order blocks refer to specific price areas where large market participants, such as institutional traders, have previously placed significant buy or sell orders. These clusters of orders can impact price movement, liquidity, and market sentiment.
Order blocks are a strategic approach to identifying key levels of support and resistance based on the behavior of institutional traders. These key levels are then utilized as entry or exit points for trades.
An order block is an area where there has been a large concentration of limit orders awaiting execution. These blocks are identified on a chart by observing previous price action and pinpointing areas where the price experienced significant movement or abrupt changes in direction.
Order blocks are used in the following popular trading philosophies:
Smart Money Concepts (SMC)
Inner Circle Trading (ICT)
Price Action
---
Credits to: @AGFXTRADING

Mxwll Price Action Suite [Mxwll]Introducing the Mxwll Price Action Suite!
The Mxwll Price Action Suite is an all-in-one analysis indicator incorporating elements of SMC and also ideas extending beyond the trading methodology!
Features
Internal structures
External structures
Customizable Sensitivities
BoS/CHoCH
Order Blocks
HH/LH/LL/LH Areas
Rolling TF highs/lows
Rolling Volume Comparisons
Auto Fibs
And more!
The image above shows the indicator's market structure identification capabilities. Internal BoS and CHoCH structures in addition to overarching market structures are available with customizable sensitivities.
The image above shows the indicator identifying order blocks! Additionally, HH/LH/LL/LH areas are also identified.
The image above shows a rolling area of interest. These areas can be compared to supply/demand zones, where traders might consider a bargain long/short/sell area.
The indicator displays a rolling 4hr high/low and 1D high/low, alongside auto fibonacci levels with a customizable sensitivity.
Finally, the Mxwll Price Action Suite shows relevant session information.
Table information
Current Session
Countdown to session close
Next Session
Countdown to next session open
Rolling 4-Hr volume intensity
Rolling 24-Hr volume intensity
Introducing the Mxwll SMC Suite!
The Mxwll SMC Suite is an all-in-one analysis indicator incorporating elements of SMC and also ideas extending beyond the trading methodology!
Features
Internal structures
External structures
Customizable Sensitivities
BoS/CHoCH
Order Blocks
HH/LH/LL/LH Areas
Rolling TF highs/lows
Rolling Volume Comparisons
Auto Fibs
And more!
The image above shows the indicator's market structure identification capabilities. Internal BoS and CHoCH structures in addition to overarching market structures are available with customizable sensitivities.
The image above shows the indicator identifying order blocks! Additionally, HH/LH/LL/LH areas are also identified.
The image above shows a rolling area of interest. These areas can be compared to supply/demand zones, where traders might consider a bargain long/short/sell area.
The indicator displays a rolling 4hr high/low and 1D high/low, alongside auto fibonacci levels with a customizable sensitivity.
Finally, the Mxwll Price Action Suite shows relevant session information.
Table information
Current Session
Countdown to session close
Next Session
Countdown to next session open
Rolling 4-Hr volume intensity
Rolling 24-Hr volume intensity
Expanded Features of Mxwll Price Action Suite
Internal and External Structures
Internal Structures: These elements refer to the price formations and patterns that occur within a smaller scope or a specific trading session. The suite can detect intricate details like minor support/resistance levels or short-term trend reversals.
External Structures: These involve larger, more significant market patterns and trends spanning multiple sessions or time frames. This capability helps traders understand overarching market directions.
Customizable Sensitivities
Adjusting sensitivity settings allows users to tailor the indicator's responsiveness to market changes. Higher sensitivity can catch smaller fluctuations, while lower sensitivity might focus on more significant, reliable market moves.
Break of Structure (BoS) and Change of Character (CHoCH)
BoS: This feature identifies points where the price breaks a significant structure, potentially indicating a new trend or a trend reversal.
CHoCH: Detects subtle shifts in the market's behavior, which could suggest the early stages of a trend change before they become apparent to the broader market.
Order Blocks and Market Phases
Order Blocks: These are essentially price levels or zones where significant trading activities previously occurred, likely pointing to the positions of smart money.
HH/LH/LL/LH Areas: Identifying Higher Highs (HH), Lower Highs (LH), Lower Lows (LL), and Lower Highs (LH) helps in understanding the trend and market structure, aiding in predictive analysis.
Rolling Timeframe Highs/Lows and Volume Comparisons
Tracks highs and lows over specified rolling periods, providing dynamic support and resistance levels.
Compares volume data across different timeframes to assess the strength or weakness of the current price movements.
Auto Fibonacci Levels
Automatically calculates and plots Fibonacci retracement levels, a popular tool among traders to identify potential reversal points based on past movements.
Session Data and Volume Intensity
Session Information: Displays current and upcoming trading sessions along with countdown timers, which is crucial for day traders and those trading on session overlaps.
Volume Intensity: Measures and compares the volume within the last 4 hours and 24 hours to gauge market activity and potential breakout/breakdown movements.
Visualizations and Practical Use
Dynamic Visuals: The suite provides dynamic visual aids, such as real-time updating of high/low markers and Fibonacci levels, which adjust as new data comes in. This feature is critical in fast-paced markets.
Strategic Entry/Exit Points: By identifying order blocks and using Fibonacci levels, traders can pinpoint strategic entry and exit points, maximizing potential returns.
Risk Management: Enhanced features like session countdowns and volume intensity help in better risk management by providing traders with more data on market sentiment and potential volatility.
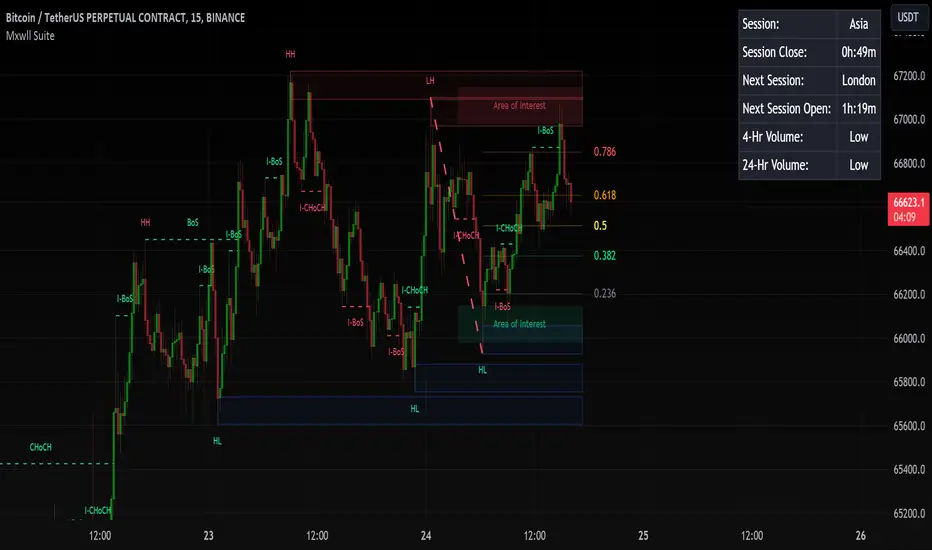
Smart Money Setup 05 [TradingFinder] Minor OB & Trend Proof🔵 Introduction
The "Smart Money Concept" transcends the realm of mere technical trading strategies to embody a comprehensive philosophy on the dynamics of market operations. It posits that key market participants engage in price manipulation, thereby complicating the trading landscape for smaller, retail traders.
Under this doctrine, retail traders are advised to tailor their strategies in alignment with the maneuvers of "Smart Money" - essentially, the capital operated by market makers.
To this end, one should endeavor to mirror the trading patterns of these influential market participants, who are adept at navigating through the nuances of supply, demand, and overall market structure. As a proponent of Smart Money trading, these elements are pivotal in your decision-making process for trade entries.
🟣 Key Insights
The core principle of this strategy hinges on misleading other traders. A sudden market movement against the prevailing trend that results in the formation of either a lower low or a higher high, followed by a pullback where a divergence pattern emerges, sets the stage.
Subsequently, the market may form another lower low or higher high. Traders, persuaded that the market will continue along the trajectory of the new movement, are caught off-guard when the price abruptly reverses direction. Following a "Stop Hunt" of the traders' open positions, the market resumes its initial trend.
To grasp the essence of this setup, observe the following illustrations.
"Bullish Setup" :
"Bearish Setup" :
🔵 How to Use
The setups can be customized based on the desired formation period. This adjustment can be made through the indicator's price setting options, where the default period is set at 2.
Upon configuring your preferred period, the signals become actionable. Once a setup forms, the subsequent step involves waiting for the price to reach the "Order Block".
"Bullish Setup" :
"Bearish Setup" :

Smart Money Setup 04 [TradingFinder] Three Drive (Harmonic) + OB🔵 Introduction
The "Three Drive" pattern is a well-known formation in technical analysis, recognized for its ability to signal potential trend reversals in price action. Within the realm of trading, particularly in the context of "Reversal Patterns," the Three Drive pattern holds significance as a reliable indicator of shifts in market sentiment.
🟣 Bullish 3 Drive
This pattern typically manifests at a price bottom, where a sequence of lower lows suggests a prevailing negative trend. However, within the structure of the Three Drive pattern, a notable occurrence unfolds.
The second low breaches the range of the first low, followed by the third low surpassing the range of the second low. These penetrations signify a diminishing selling pressure and an emerging buying interest.
Traders often await the confirmation of the third low surpassing the second low as an entry point, with price targets set at the highs formed within the Three Drive pattern.
🟣 Bearish 3 Drive
Conversely, the Bearish Three Drive pattern emerges at a price top, characterized by a sequence of higher highs indicating an upward trend. Yet, amidst this apparent bullish momentum, a shift occurs.
The second high breaks beyond the range of the first high, succeeded by the third high exceeding the range of the second high. These breaches signify a waning buying strength and a resurgence in selling pressure.
Entry into a trade is often executed after the confirmation of the third high surpassing the second high, with targets set at the lows formed within the Three Drive pattern.
Importance :
Understanding the Three Drive pattern's significance extends beyond mere technical analysis. It bears resemblance to other established patterns, such as the Harmonic Pattern and Ending Diagonal within the Elliott Wave Theory.
Recognizing these parallels aids traders in comprehending broader market dynamics and potential price movements.
🔵 Formation of 3 Drive in Order Block Zone
The convergence of the Three Drive pattern with the concept of the Order Block Zone introduces a nuanced layer to traders' analytical approach.
In "Price Action" methodology, Order Blocks represent areas on the price chart where significant market players, such as institutional traders, have executed notable orders.
These zones often act as barriers, with price encountering resistance or support upon reaching them.
When the Three Drive pattern forms within an Order Block Zone, it signifies a confluence of market dynamics.
The completion of the pattern within this zone suggests a potential reversal in the prevailing trend, augmented by the presence of significant institutional orders.
Traders incorporate these Order Blocks into their analysis to identify probable levels where price may change direction, enhancing the reliability of their trading decisions.
🔵 How to Use :
To effectively utilize the Three Drive pattern within the Order Block Zone, traders seek alignment between the completion of the pattern and the presence of significant Order Blocks.
This convergence enhances the reliability of the pattern's signals, increasing the likelihood of successful trade outcomes.
Bullish Three Drive in Demand Zone :
Bearish Three Drive in Supply Zone :
Settings :
You can set your desired "Pivot Period" via settings for the indicator to identify setups based on it.

Smart Money Setup 03 [TradingFinder] Minor OB & Trend Proof🔵 Introduction
The "Smart Money Concept" transcends mere technical trading strategies; it embodies a comprehensive philosophy elucidating market dynamics. Central to this concept is the acknowledgment that influential market participants manipulate price actions, presenting challenges for retail traders.
As a "retail trader", aligning your strategy with the behavior of "Smart Money," primarily market makers, is paramount. Understanding their trading patterns, which revolve around supply, demand, and market structure, forms the cornerstone of your approach. Consequently, decisions to enter trades should be informed by these considerations.
🟣 Important Note
In this setup, pattern formation revolves around the robustness of the "Stop Hunt" targeting retail traders.
When this stop hunt occurs, if the price tests below the minor pivot or above the minor pivot, a "Minor Order Block" is formed.
Similarly, if the price tests below the major pivot or above the major pivot, a "Major Order Block" is formed.
Since the price hasn't successfully broken the major pivots before breaking the Top or Bottom, it can be inferred that the minor pivots formed within a leg of price movement exhibit a "Range" structure.
For a deeper comprehension of this setup, refer to the accompanying visual aids below.
Bullish Setup Details :
Bearish Setup Details :
🔵 How to Use
Upon integrating the indicator into your chart, exercise patience as you await the evolution of the trading setup.
Experiment with different trading positions by adjusting both the "Time Frame" and "Pivot Period". Typically, setups materializing over longer "Time Frames" and "Pivot Periods" carry heightened validity.
Bullish Setup Details on Chart :
Bearish Setup Details on Chart :
Within the settings, you possess the flexibility to modify the "Pivot Period" input to tailor the indicator to your preferences.

Smart Money Setup 02 [TradingFinder] Mitigated Major OB Proof🔵 Introduction
"Smart money" is money invested by knowledgeable individuals at the right time, and this investment can yield the highest returns.
The concept we focus on in this indicator is whether the market is in an uptrend or downtrend. The market briefly takes a weak and reversal trend with "Minor BoS" without being able to break the major pivot.
In the next step, it returns to its main trend with a strong bullish move and continues its trend with a "Major BoS". The "order block" behind this rapid and powerful movement can be a valid order block for trading.
To better understand this setup, please refer to the explanations in the two images below.
Bullish Setup Details :
Bearish Setup Details :
🔵 How to Use
After adding the indicator to the chart, you should wait for trading opportunities to form. By changing the "Time Frame" and "Period Pivot", you can see different trading positions. In general, the lower the "Time Frame" and "Period Pivot", the higher the likelihood of forming trading opportunities.
Bullish Setup Details on Chart :
Bearish Setup Details on Chart :
You can access "Period Pivot" via settings as an input.